

Abstract
Objective:
To identify microRNAs (miRNAs) differentially expressed in plasma exosomes collected in women diagnosed with preeclampsia compared with women with uncomplicated pregnancies.
Materials and Methods:
Exosomes were purified from plasma samples obtained at each trimester from four women subsequently diagnosed with preeclampsia and from five matched healthy controls. RNA was purified from the exosomes and expression of 368 miRNAs was profiled using the A-Set TaqMan Low Density Array (TLDA).
Results:
One-third of the 368 miRNAs profiled are not expressed in exosomes. Further, those that are not expressed tend to be evolutionarily younger and have a significantly different mature sequence signature than do miRNAs that are expressed in exosomes. Among miRNAs that are expressed in exosomes, a total of eight (miR-134, miR-196b, miR-302c, miR-346, miR-376c, miR-486-3p, miR-590-5p and miR-618) were found to display statistically significant differential expression between women who developed preeclampsia as compared with those who did not. Moreover, half of these miRNAs (miR-134, miR-376c, miR-486-3p and miR-590-5p) displayed statistically significant differential expression in the first trimester.
Conclusions:
Not all miRNAs are expressed in exosomes. Those that are tend to be evolutionarily older and have a significantly different mature sequence signature than those that are not. A few exosome-expressed miRNAs do display expression patterns in women subsequently diagnosed with preeclampsia that are significantly different than in women having an uncomplicated and, among these, several appear in the first trimester. These miRNAs are potential early markers of preeclampsia risk.
Keywords: Preeclampsia, Exosome, microRNA, Profile, Trimester-specific
Introduction
Preeclampsia (PE) is a disorder specific to pregnancy that affects up to 5–7% of pregnancies and is a leading cause of maternal and neonatal morbidity and mortality worldwide [1, 2, 3, 4]. The cause of preeclampsia remains unknown but much of the pathologic process has come into better focus over the past two decades [5].
MicroRNAs (miRNAs) are small, 21-23nt, regulatory RNAs first identified in the early 1990s [6, 7]. Since their discovery, miRNAs have been found in nearly all plant and animal species and have been associated with a vast array of both normal and pathologic cellular processes [8, 9]. Numerous investigators have examined the role of miRNAs in preeclampsia [10, 11, 12, 13, 14, 15, 16] including some that have focused upon extra-cellular miRNAs [17, 18]. Most of these studies have, by the nature of the disorder, been restricted to using tissues collected at the time of delivery or, at the very least, quite late in gestation after the diagnosis has been made. Here, we have taken advantage of our prospectively collected Maternal Fetal Tissue Bank (MFTB) curated at the University of Iowa Hospitals and Clinics [19] to examine extracellular (exosomal) miRNA expression in samples obtained prior to the diagnosis of preeclampsia. Thus, we have been able to assess extracellular miRNA expression profiles in plasma samples obtained during each trimester in a cohort of women who developed preeclampsia (n = 4) and compare them with women who had full-term, unremarkable pregnancies (n = 5).
Trimester-specific exosome miRNA profiles identify eight miRNAs; miR-134, miR-196b, miR-302c, miR-346, miR-376c, miR-486-3p, miR-590-5p and miR-618, whose expression is sufficiently robust and display statistically significant changes among women who developed preeclampsia versus those who did not. Some of these miRNAs represent potential minimally invasive markers both for the development of preeclampsia and, perhaps more importantly, for temporal monitoring of intervention efficacy. In addition, our plasma exosome miRNA expression profiling has revealed that, regardless of trimester or gestational outcome, expression of miRNAs in exosomes is not random and is determined, at least in part, by specific sequence signatures in the 3’ half of the mature miRNA. Moreover, miRNAs not detectable in exosomes are primarily lineage-specific (found only in primates and humans) and were generated by transposons. Thus, miRNAs that are present in plasma exosomes are older, evolutionarily conserved miRNAs many of which have previously been linked to preeclampsia.
Subjects and Methods
Plasma Sample Collection
Preeclamptic and control subjects were identified within the University of Iowa Hospitals and Clinics Maternal Fetal Tissue Bank (MFTB), established and maintained in the Department of Obstetrics and Gynecology (IRB#200910784). Coded biosamples and clinical data were obtained from the MFTB per the IRB approved, published processes [19]. Specifically, this study included women with singleton pregnancies older than 18 years, less than 40 years old presenting for prenatal care prior to twelve weeks. Women who were HIV positive, Hepatitis C positive, incarcerated, or who had fetuses with a major structural or chromosomal abnormality were excluded from recruitment to the study. Women also needed to plan to deliver at the University of Iowa. The diagnosis and classification of preeclampsia were based on the standard American College of Obstetrics and Gynecology (ACOG) definitions for analysis with a minimum clinical presentation of elevated blood pressures of greater than 140/90 on at least 2 occasions 6 hours apart accompanied by proteinuria [20]. The coded clinical data of cases and controls were evaluated by a maternal fetal medicine specialist (MKS) to confirm the diagnosis of preeclampsia by the ACOG definitions.
Plasma samples taken in each trimester of gestation from women subsequently diagnosed with term preeclampsia without severe features (n = 4) and from matched healthy controls (n = 5) who underwent a normal spontaneous vaginal delivery. The control and preeclampsia groups exhibited similar average maternal age (Control: 29.2 ± 2.1 vs. Preeclampsia: 35.8 ± 2.8 years old, p=0.09) and average body mass index (Control: 23.1 ± 1.0 vs. Preeclampsia: 30.6 ± 5.2, kilograms/meters2, p=0.17). While all deliveries occurred at greater than 37 weeks gestation, as expected, the preeclampsia group exhibited a lower gestational age of delivery (Control: 39.3 ± 0.6 vs. Preeclampsia: 37.6 ± 0.4 , gestational weeks, p=0.05). Trimesters were designated at the time of sample collection as trimester 1 (<13 weeks gestation), trimester 2 (13-26 weeks gestation), or trimester 3 (26-40 weeks gestation).
RNA Purification
Plasma RNA was purified from exosomes. Initially, 400μl of fresh frozen plasma was treated with 200μl of Thromboplastin D for 15 minutes at 37°C to bind fibrinogens and other non-exosome cellular materials. This mixture was centrifuged at 10,000 rpm for five minutes at room temperature. The supernatant was then transferred to a new nuclease free microcentrifuge tube and 120μl of ExoQuick exosome binding buffer (System Bioscience) was added. This mixture was then incubated overnight at 4°C with constant mixing on a rotator.
Following the overnight incubation, the mixture was centrifuged at 1500g for 30 minutes at 4°C. The supernatant was removed and the pellet resuspended in 200μl of room temperature 1X PBS. This pellet is very sticky and requires vigorous agitation to fully resuspend. Once fully suspended, 400μl of 4°C TRI reagent (Life Technologies) is added and mixed by vortexing. Then, 80μl of room temperature CHCl3 is added and mixed by shaking for 15 seconds. The mixture is incubated at room temperature for 15 minutes.
Following incubation, the mixture is centrifuged at 10,000rpm for 15 minutes at 4°C. The upper (aqueous) phase is transferred to a new nuclease free tube and 3μl of 10mg/ml glycogen and 400μl of room temperature isopropanol is added. This is incubated at room temperature for 15 minutes and then centrifuged at 10,000rpm for 15 minutes at 4°C. The supernatant is removed and the pellet is washed once in 400μl of 75% EtOH, centrifuged at 10,000rpm for 15 minutes at 4°C, the supernatant removed and the pellet air dried. Finally, the RNA pellet is rehydrated in 20μl of nuclease free water and stored at −20°C until used.
microRNA Expression Assays
MicroRNA expression levels in plasma exosome-derived RNA samples were assayed using A-set TaqMan Low Density microRNA Arrays (TLDA, Life Technologies). The A-set TLDA array assesses expression of 368 validated human miRNAs among which are the most common and most studied well-known miRNAs. Fixed RNA mass aliquots (1 ng) from each trimester plasma sample for all nine subjects, five with preeclampsia and five controls, were reverse transcribed with MultiScribe reverse transcriptase (Life Technologies) in the presence of the A-set MegaPlex Primer Pool (Life Technologies). The resulting cDNAs were then subjected to an unbiased pre-amplification in the presence of the A-set MegaPlex PreAmp Primer pool. Finally, the pre-amplified cDNAs were loaded into A-set TLDA Array cards and the cards run on an Applied Biosystems 7900HT real-time PCR system. This final step was performed in the Genomics Division of the University of Iowa Institute of Human Genetics (IIHG).
MicroRNA Expression Analyses
In all cases, raw expression values (Ct) are normalized (ΔCt) against the well-validated endogenous control RNU48. All group-wise comparisons are based upon mean ΔCt values. Thus, fold change is computed as 2−(ΔΔCt) where ΔΔCt = Mean ΔCtexp - Mean ΔCtctrl [21, 22]. Statistical significance of comparisons is assessed on ΔCt values using a standard t-test with unequal variances [23].
MicroRNA Sequence Analyses
The mature miRNA sequence (22-mer) for each member of the A-set TLDA array (n = 386) was down-loaded from miRBase Release 21. Sequences were edited for duplications and then classified as to whether or not that it was expressed at Ct < 35 or Ct ≥ 35 in at least six of the nine subjects in each trimester. Mature miRNA sequences for two bins, High Expression (Ct < 25) and Low Expression (Ct ≥ 35), were submitted to a nucleotide by position information analysis using WebLogo (weblogo.berkeley.edu/logo.cgi) [24]. Results from WebLogo are presented in graphic form in which each nucleotide in each position is weighted by its overall occurrence and group discrimination information content.
Results
MicroRNA expression in plasma
The average number of miRNAs detectable in plasma exosome samples is shown by group and by trimester in Table 1. While there is a slight tendency for fewer miRNAs to be expressed in plasma exosomes each subsequent trimester, the observed variation is not statistically significant (χ2 = 0.19, ns, df = 2). In the third trimester, a total of 219 miRNAs (59.5% of the 368 A-set TLDA miRNAs) were detectable in at least three of the four preeclamptics and three of the five controls. Of these, 197 were also detectable in A-set TLDA arrays from four normal, term placentas. Taking mean normalized (ΔCt using RNU48 as the endogenous control) expression values for these 197 miRNAs and comparing them to mean normalized (ΔCt also using RNU48 as the endogenous control) A-set TLDA expression values for the same miRNAs in four normal, term placentas shows that there is a statistically significant correlation (r = 0.34, p < 0.001, df = 195) between detectable third trimester plasma miRNA expression and placental miRNA expression at term (Figure 1).
Table 1.
Mean number of miRNAs detectable in plasma exosomes by group and trimester. Within-group membership consistency exceeds 90%. Overall plasma exosome miRNA detection is 227.6±17.1 out of 368 valid human miRNAs on the A-set TLDA array (61.8%). The observed variation by group and trimester is not statistically significant (χ2 = 0.19, ns, df = 2).
| Trimester | Control | Preeclampsia |
|---|---|---|
| First | 239.0±10.1 | 251.0±8.5 |
| Second | 239.3±24.5 | 235.0±22.6 |
| Third | 230.3±16.9 | 226.0±12.8 |
Figure 1:
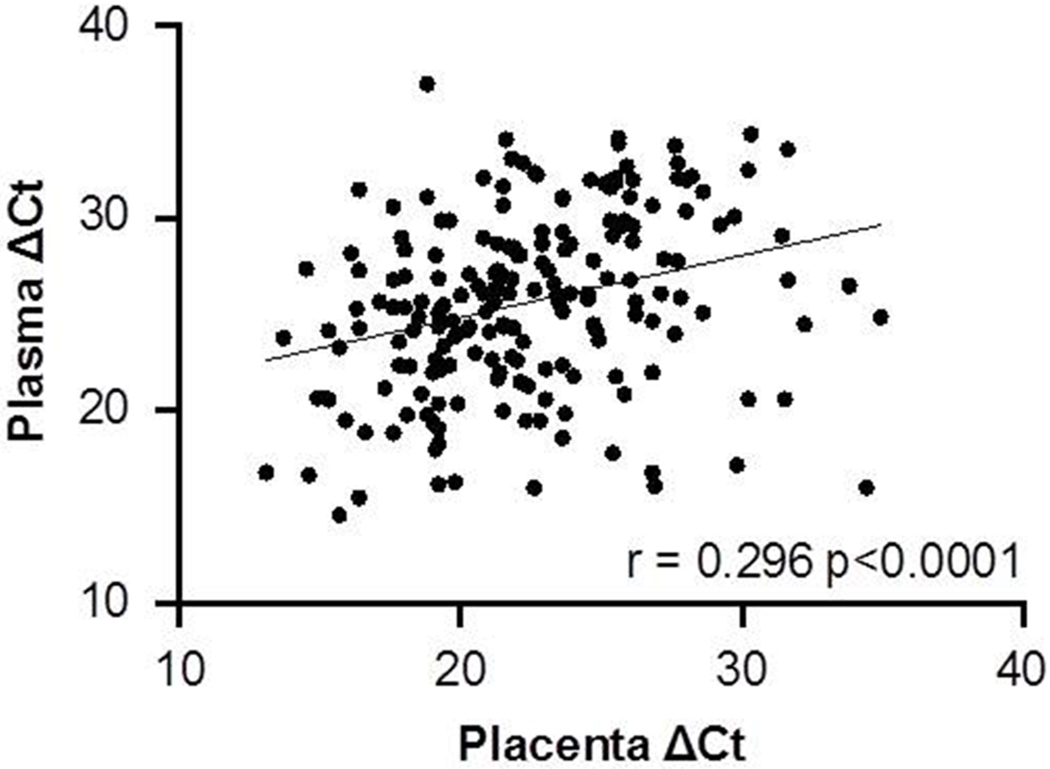
Scatterplot showing the distribution of RNU48 normalized expression (ΔCt) in plasma exosomes and in placental tissues for miRNAs on the A-set TLDA miRNA array. Of the total of 368 miRNAs, 193 were detectable (Ct < 35) in both plasma exosomes and placental tissues. Normalized expression (∆Ct) values are significantly correlated (r = 0.2957, p < 0.001, df = 195).
The 153 miRNAs that were not detectable in exosomal RNA included a number of notable miRs including 28 of the 38 (73.7%) chromosome 19 cluster (C19MC) members that are represented on the A-set array. By contrast only 14 of the 42 (33.3%) chromosome 14 cluster (C14MC) members on the A-set array were undetected. Moreover, among the 28 C14MC members that were detectable in plasma exosomes were many that were among the most highly expressed miRNAs in the samples. Also, none of the eight representatives of the huge transposon-derived miR-548 family [25, 26] were detected.
It has been suggested that specific mature miRNA sequence motifs are required for loading into exosomes [27, 28]. Thus, we binned mature miRNA sequences into a High Expression Group (mean Ct < 25) and a Low Expression Group (mean Ct ≥ 35). In the end there were 107 miRNAs in the High Expression Group and 165 miRNAs in the Low Expression Group. These included 43 miRNAs for which the A-set TLDA contains both the −5p and −3p sequences. Notably, of these 43 miRNAs, 38 (88.4%) were expression concordant and most (33 of 38, 86.8%) were in the Low Expression Group. WebLogo analysis indicated that mature miRNA sequence positions 1 to 10 were not different between miRNAs that were in the Low Expression Group compared with those in the High Expression Group but that positions 11 to 22 were different. Those in the Low Expression Group tend to have a more U-rich sequence than those in the High Expression Group, particularly in positions 14, 15 and 17-20 (Figure 2A). Moreover, the presence of runs of three or more U’s, particularly in positions 17-21, was significantly higher in the Low Expression Group (χ2 = 42.5, p < 0.0001, df = 270). We observed that most of the sequences containing U-rich runs belonged to miRNAs in the duplication/insertion generated C19MC and to the duplication/insertion generated miR-548 family (53 of 82, 64.6%). However, removing these miRNAs from the analysis still resulted in a significant over-representation of U-rich runs in the Low Expression Group (χ2 = 8.3, p < 0.01, df = 214). Finally, the High Expression Group displays a pronounced preference for the sequence CnGGU in positions 17-21 (Figure 2B).
Figure 2:
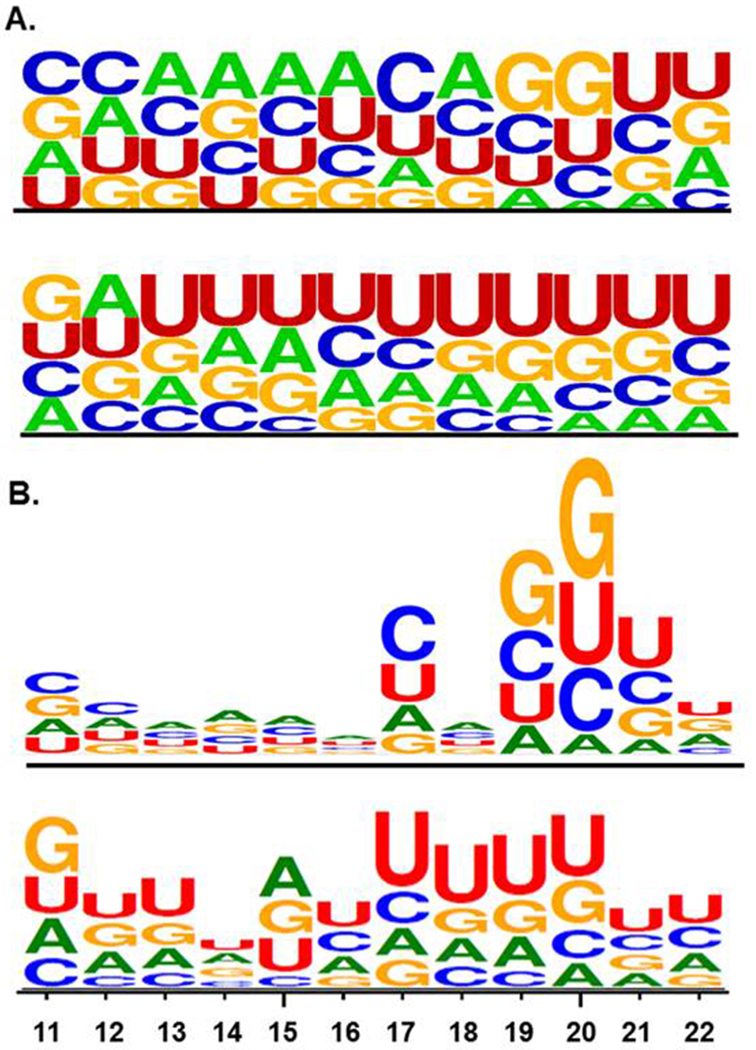
Sequence LOGO plots of positions 11-22 of mature miRNAs . A. Relative abundance of each nucleotide by position. The upper LOGO shows miRNAs detectable in plasma exosomes while the lower LOGO shows those miRNAs not detectable in plasma exosomes. B. Information content in each nucleotide position. The relative size of each position relative to each other position is a measure of the importance of that position for group membership. Thus, for detectable miRNAs (upper LOGO), the sequence CnGGU in positions 17-21 is the most important shared sequence with other permutations such as CnGUU, UnCGU, and so on also characteristic of membership. For those miRNAs not detectable in plasma exosomes (lower LOGO), U-rich runs, particularly in positions 17-22, are characteristic of non-membership.
We recently showed that miRNA expression in human cancers is highly correlated and, further, that the most highly expressed miRNAs are almost exclusively members of the oldest miRNA families [29]. Using experimentally determined evolutionary age estimates for all 368 miRNAs in the A-set TLDA array [30, 31, 32] we grouped high expression (Ct < 25), intermediate expression (25 ≤ Ct ≤ 35) and low expression (Ct > 35) miRNAs into four evolutionary epochs (1: Pre-Cambrian, 2: Chordates and Bony Fishes, 3: Tetrapods and Eutherians and 4: Primates including Humans). Proportionate representation by expression level and evolutionary epoch is presented in Table 2. It can be seen that none of the most highly expressed miRNAs belongs to a family unique to primates and that the older the miRNA family, the more likely it is to be highly expressed in exosomes.
Table 2.
Proportionate exosome miRNA expression levels by Evolutionary epoch. This distribution is statistically significant (χ2 = 101.0, p < 0.0001, df = 6) but is completely driven by the young, lineage-specific primate and human miRNAs (χ2 = 5.7, ns, df = 4 when epoch 4 is removed).
| miRNA Expression | |||
|---|---|---|---|
| Epoch# | Ct ≤ 25 | 25 ≤ Ct ≤ 35 | Ct ≥ 35 |
| 1 | 37.1 | 40.0 | 22.9 |
| 2 | 40.2 | 40.2 | 19.6 |
| 3 | 28.7 | 38.7 | 32.7 |
| 4 | 0.0 | 22.4 | 77.6 |
Evolutionary epochs are 1. Pre-Cambrian (~700mya – 500mya); 2. Chordates and Bony Fishes (500mya – 380mya); 3. Tetrapods Eutherians (380mya – 180mya); 4. Primates and Humans (65mya – 200,000 years ago).
MicroRNA Expression by Trimester
Plasma exosome miRNA expression patterns in women who developed preeclampsia and those who did not are presented by trimester in Table 3 As previously seen in Table 1, there is a tendency for fewer miRNAs to be expressed as gestation progresses but this tendency is not statistically significant. However, with respect to expression patterns there is a significant change in the proportion of miRNAs being over-expressed versus those being under-expressed among women who developed preeclampsia compared to controls. In the first trimester, 178 of 237 miRNAs are over-expressed in women who developed preeclampsia (24.9%). In the second trimester this proportion drops to 45.4% (125 of 229) and is nearly the same in the third trimester (41.3%, 131 of 223). Overall, this change is significant (χ2 = 23.6, p < 0.0001, df = 2) but clearly is most pronounced between the first and second trimesters. Among the individual miRNAs that reach statistical significance, all eight in the first trimester are overexpressed in the women who developed preeclampsia as is the one miRNA in the second trimester whereas, of the five statistically significant miRNAs in the third trimester, three are overexpressed and two are underexpressed. However, among all 14 miRNAs that achieve statistical significance six displayed raw Ct values ≥ 35 and were, therefore, not deemed to be reliably informative. The expression patterns of the remaining eight miRNAs are shown in Figure 3. Five of these miRNAs; miR-134, miR-196b, miR-376c, miR-486-3p and miR-590-5p, are over-expressed in the first trimester among women who developed preeclampsia compared with those who did not but then become under-expressed in subsequent trimesters. The other three miRNAs; miR-302c, miR-346 and miR-618, display the opposite expression pattern. It can also be seen that statistical significance is achieved in the first trimester in four of the eight and in the third trimester in the other four.
Table 3.
Changes in plasma exosome miRNA expression between women who developed preeclampsia and those did not by trimester. Significance is taken to be p < 0.05.
| Trimester | First | Second | Third |
|---|---|---|---|
| Detected* | 237 | 229 | 223 |
| Expression# | |||
| Up | 178 | 125 | 131 |
| Down | 59 | 104 | 92 |
| Significant | 8 | 1 | 5 |
Expression detected (Ct ≤ 35.0) in at least three samples in both the control and the preeclamptic groups.
Refers to ΔΔCt-derived fold change in the preeclampsia group relative to the control group.
Figure 3:
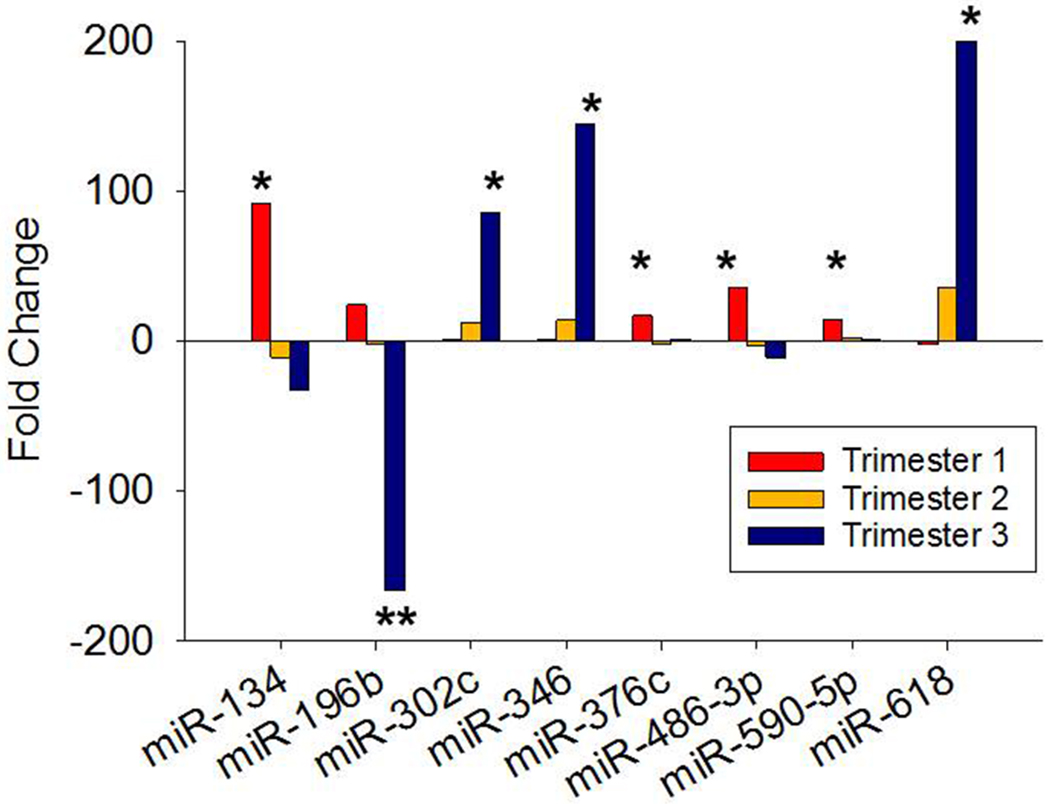
Fold change expression by trimester of eight miRNAs that achieved individual statistical significance in plasma exosomes of women who developed preeclampsia compared with those who did not. First trimester is shown as blue bars, second trimester as red bars and third trimester as green bars. *p < 0.05, **p < 0.01.
Discussion
Overall observations
We have determined expression profiles of 368 human miRNAs from plasma exosomes in each trimester of pregnancy in nine women of whom five carried out a normal, uncomplicated full-term delivery and four who developed preeclampsia (a total of 9,936 profiles). Expression profiling was performed using A-set TaqMan Low Density miRNA Arrays (TLDAs). These data reveal a series of observations and conclusions including, 1) that there is a consistent and reproducible pattern of expression in exosomes in which roughly one-third of miRNAs are expressed at very low levels or not at all, 2) that miRNA expression in exosomes is determined, at least in part, by specific sequence signatures residing in positions 11-21 of the mature miRNA and that those miRNAs bearing a U-rich non-expression signature have a very different evolutionary history than those that are expressed, 3) that among miRNAs that are expressed, expression profiles in third trimester plasma are significantly correlated with expression in placental tissues taken at delivery, 4) that there is a significant downward shift in the proportion of miRNAs that are over-expressed between the first and second trimesters, 5) that few miRNAs achieve individual statistical significance in comparative expression.
miRNAs in plasma exosomes
As shown in Table 3, there is a consistent absence or near-absence of one-third of the miRNAs on the A-set miRNA TLDA array in plasma exosomes. Moreover, membership in the presence or absence cohort is not at all random as more than 90% of the miRNAs either absent or present in the first trimester will be absent or present in the second and third trimesters as well. Nor is this a phenomenon restricted to the plasma exosomes of pregnant women. MiRNA deep sequencing of plasma from three blood donors was carried out and there is a consistent pattern of presence or absence of specific miRNAs based upon normalized hits per million bases [33]. At least one hit per million bases on 594 miRNAs was reported but the greatest majority of total hits was taken up by a relatively small percentage of miRNAs. Merging that miRNA hits list with the 368 miRNAs present in the A-set TLDA, we were able to confirm an over-lap of 272 miRNAs (Figure 4A). Comparing normalized “hits” (sequence matches per megabase) to our average Ct values for these 272 miRNAs we observed a statistically significant negative correlation (Figure 4B). That is, the more “hits” the lower the Ct value which is associated with higher expression in qPCR. These data confirm, on a completely different platform with non-pregnant (presumably) plasma donors, that the pattern of presence and absence of miRNAs in plasma exosomes is consistent and not unique to the plasma of pregnant women nor to the TLDA array platform used here.
Figure 4:
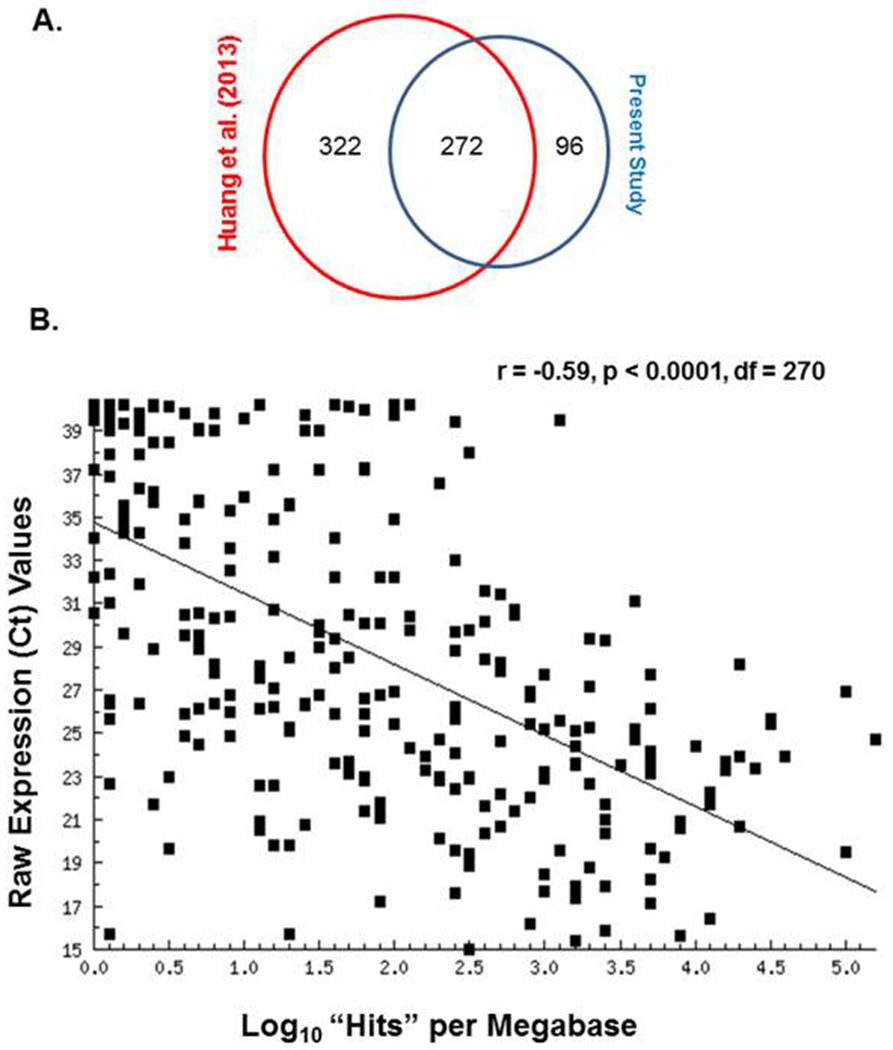
A. Venn diagram showing the miRNA overlap between the present study and that of Huang et al. [32]. B. Scatter-plot of the regression of 272 mean over-all Ct values from plasma exosome miRNA arrays in the present study against log10 “hits” per megabase from the Huang et al. deep sequencing of plasma exosomes [32].
Finally, with regard to miRNA presence or absence in plasma exosomes, those miRNAs that are packaged into exosomes belong to the evolutionarily oldest miRNA families. These results are consistent with our previous observation using data from the Cancer Genome Atlas (TCGA) [34, 35, 36, 37] that evolutionarily older miRNAs are also the most highly expressed in cancers [29]. We suggested that this pattern of miRNA expression in cancers reflects a probability that older miRNAs are more integral to fundamental cellular processes. However, that evolutionarily younger, lineage-specific miRNAs are disproportionately absent in exosomes may simply suggest that there has not been sufficient time for them to evolve an exosome loading mechanism. This not to say that such young miRNAs are not present at all in plasma it merely suggests that they are not present in exosomes. Indeed, miR-520d-5p has been detected in sera of pregnant women and its expression does increase by trimester [38] but it is not detected in exosomes in our study nor in the deep sequencing data [33].
Plasma exosome miRNAs in preeclampsia
For those miRNAs that are detectable in plasma exosomes there is virtually no change in terms of which miRNAs are present or absent but we have shown that there are changes in relative expression between women who developed preeclampsia and those who did not. We observe that 14 miRNAs did achieve individual statistical differences between women who developed preeclampsia and those who did not in a trimester. We also note that, among these 14 miRNAs, the raw expression values of six were ≥ 35 which rendered them unreliable in our view. Of the eight remaining miRNAs, shown in Figure 3, some may have potential relevance to the development and/or progression of preeclampsia. Among those that are significantly over-expressed in the first trimester in exosomes of women who developed preeclampsia, miR-134 is known to have an mRNA target that could be relevant. This miRNA, which is one of two highly expressed members of the chromosome 14 miRNA cluster (C14MC) in this list, the other being miR-376c, has been shown to directly target the forkhead-box transcriptional activator FOXM1 [39]. MiR-134 down-regulation of FOXM1 in inhibition of angiogenesis in pancreatic cancer cells has also been shown [40]. However, it is possible that the pattern of decreasing miR-134 expression seen here could relate to the observation, using peripheral blood samples taken at term, that FOXM1 is highly over-expressed in severe preeclampsia [41].
The most significant change in miRNA expression is the decrease displayed by miR-196b in the third trimester. Over-expression of this miRNA has been shown to be associated with poor prognosis in several cancers by fostering enhanced cellular proliferation [42, 43]. One study of miR-196b expression in late gestation plasma from women with preeclampsia saw significant under-expression consistent with that seen here [44] and a recent study of embryonic tissues from ectopic pregnancies showed that miR-196b expression is significantly lower than in normal pregnancies [45]. Unfortunately, to date, no experimentally validated target mRNAs are known for this miRNA.
Three miRNAs display significant over-expression in the third trimester in women who developed preeclampsia. One of these, miR-302c, is a member of a highly conserved, evolutionarily ancient miRNA family found on human chromosome 4 that is well known to target cyclin D1 and AKT1 and to be expressed in embryonic stem cells [46, 47]. It has also been shown that loss of Akt activity in placental tissues of preeclamptic women significantly increases circulating levels of soluble endoglin (sENG), a TGF-β antagonist known to be elevated in preeclampsia [48]. Further implicating this pathway in pregnancy, AKT has been shown to regulate placental development and fetal growth [49]. Whether miR-302c has anything to do with these observations has not been examined as far as we are aware.
The most highly over-expressed miRNA, miR-618, is linked to the regulation of the innate immune response and also tenuously linked to human gestation. MiR-618 regulates interferon regulatory factor-8 (IRF-8) [50, 51]. IRF-8 has been shown to regulate the survival and function of dendritic cells [52, 53]. In preeclampsia, the inflammatory immune response is upregulated, including increased activation of dendritic cells. Our data imply that the elevated inflammatory immune response in preeclampsia may be mediated via overexpression of miR-618 and its regulation of IRF-8. Recently, miR-618 was one of several miRNAs found to be expressed only in the amnion of obese women (BMI > 30) [54]. Interestingly, the mean BMI of our four preeclamptic patients was 30.9 ±5.4 (range 21.9 to 45.3) versus 23.1 ±1.0 (range 19.1 to 24.9) in controls. Future work will need to investigate the role of miR-618 in preeclampsia and obesity in pregnancy.
Finally, miR-346 has been shown to be elevated in the maternal plasma at the time of delivery in women whose pregnancy was complicated by preeclampsia [55]. In the current study, miR-346 displays a steady increase by trimester from no difference in the first trimester to 13.7-fold over-expression in the second trimester to, finally, a significant 145.0-fold over-expression in the third trimester. It is known that miR-346 transcription is induced in response to endoplasmic reticulum (ER) stress through a two-step mechanism in which inositol-requiring enzyme 1 (IRE1α) is activated and then splices X-box binding protein 1 (sXBP1) which, in turn, becomes the miR-346 transcription factor [56]. Placental ER stress elevates XBP-1 levels and ER stress has been suggested to be a factor in preeclampsia as a potential upstream regulator of maternal vascular compromise [57, 58]. Increasing transcription of miR-346 as a consequence of increasing ER stress during preeclamptic gestation would be an expected outcome. Further, miR-346 directly targets the ER antigen peptide transporter TAP1 which introduces an immuno-modulatory component at the end of this ER stress cascade [56]. Thus, miR-346 is closely associated with a clear preeclampsia-relevant pathway.
Conclusions
We have examined miRNA expression profiles in plasma exosomes from each gestational trimester from a panel of women who developed preeclampsia and who did not develop preeclampsia. One of the unexpected results of this study is the identification of specific RNA sequence characteristics and miRNA family evolutionary histories that correlate with whether or not a specific miRNA is actually packaged into exosomes. Expression profiles among miRNAs that are present in plasma exosomes have revealed a number of miRNAs that display statistically different expression between the two groups of women in one or another trimester. After filtering for overall expression levels, a few of the significant miRNAs have been found to have a potentially relevant connection with preeclampsia. Notable among these are miR-302c, miR-618, miR-134, and miR-346 as these point to pathways associated with preelclampsia, definitely meriting further detailed examination in preeclampsia. Moreover, it is possible that circulating miRs may be used to identify women in early pregnancy that may be at increased risk for poor maternal outcomes. Specifically, miR-346 levels could be developed as a monitoring system to assess ER stress in women at risk for preeclampsia or miR-618 as an indicator of increased inflammation and dendritic cell dysfunction.
Acknowledgements
We thank the Department of Obstetrics and Gynecology Women’s Health Tissue Repository (Dr. Donna Santillan, Director) for access to the materials used in this study and the continued invaluable assistance of the University Of Iowa Institute Of Human Genetics Genomics Facility, in particular Garry Hauser and Mary Boes.
Funding:
This project was funded in part by the American Heart Association Postdoctoral Fellowship, American Heart Association Strategically Focused Research Network, Shelly Bridgewater Dreams Foundation, Preeclampsia Foundation, Department of Obstetrics and Gynecology Research Development Fund, NIH Reproductive Scientist Development Program (NIH K12 HD000849), and the University of Iowa Institute for Clinical and Translational Science (NIH KL2 RR024980-2, NIH U54TR001356).
Footnotes
Conflict of Interest:
The authors declare that there are no conflicts of interest regarding publication of this study.
Data Availability Statement
The data that support the findings of this study are available from the co-corresponding authors, MKS or EJD, upon reasonable request.
References
- 1.Carty DM, Delles C, Dominiczak AF. Preeclampsia and future maternal health. Journal of hypertension. 2010. July;28(7):1349–55. doi: 10.1097/HJH.0b013e32833a39d0.. [DOI] [PubMed] [Google Scholar]
- 2.Duley L The global impact of pre-eclampsia and eclampsia. Semin Perinatol. 2009. June;33(3):130–7. doi: 10.1053/j.semperi.2009.02.010. . [DOI] [PubMed] [Google Scholar]
- 3.Kuklina EV, Ayala C, Callaghan WM. Hypertensive disorders and severe obstetric morbidity in the United States. Obstetrics and gynecology. 2009. Jun;113(6):1299–306. doi: 10.1097/AOG.0b013e3181a45b25. . [DOI] [PubMed] [Google Scholar]
- 4.Pauli JM, Repke JT. Preeclampsia: Short-term and Long-term Implications. Obstetrics and gynecology clinics of North America. 2015. Jun;42(2):299–313. doi: 10.1016/j.ogc.2015.01.007. . [DOI] [PubMed] [Google Scholar]
- 5.Fisher SJ. Why is placentation abnormal in preeclampsia? Am J Obstet Gynecol. 2015. October;213(4 Suppl):S115–22. doi: 10.1016/j.ajog.2015.08.042. . [DOI] [PMC free article] [PubMed] [Google Scholar]
- 6.Lee RC, Feinbaum RL, Ambros V. The C. elegans heterochronic gene lin-4 encodes small RNAs with antisense complementarity to lin-14. Cell. 1993. December 3;75(5):843–54. [DOI] [PubMed] [Google Scholar]
- 7.Wightman B, Ha I, Ruvkun G. Posttranscriptional regulation of the heterochronic gene lin-14 by lin-4 mediates temporal pattern formation in C. elegans. Cell. 1993. December 3;75(5):855–62. [DOI] [PubMed] [Google Scholar]
- 8.Di Leva G, Garofalo M, Croce CM. MicroRNAs in cancer. Annu Rev Pathol. 2014;9:287–314. doi: 10.1146/annurev-pathol-012513-104715. [DOI] [PMC free article] [PubMed] [Google Scholar]
- 9.Valinezhad Orang A, Safaralizadeh R, Kazemzadeh-Bavili M. Mechanisms of miRNA-Mediated Gene Regulation from Common Downregulation to mRNA-Specific Upregulation. International journal of genomics. 2014;2014:970607. doi: 10.1155/2014/970607. [DOI] [PMC free article] [PubMed] [Google Scholar]
- 10.Enquobahrie DA, Abetew DF, Sorensen TK, et al. Placental microRNA expression in pregnancies complicated by preeclampsia. Am J Obstet Gynecol. 2011. February;204(2):178 e12–21. doi: 10.1016/j.ajog.2010.09.004. [DOI] [PMC free article] [PubMed] [Google Scholar]
- 11.Hu Y, Li P, Hao S, et al. Differential expression of microRNAs in the placentae of Chinese patients with severe pre-eclampsia. Clin Chem Lab Med. 2009;47(8):923–9. doi: 10.1515/CCLM.2009.228. [DOI] [PubMed] [Google Scholar]
- 12.Mayor-Lynn K, Toloubeydokhti T, Cruz AC, et al. Expression profile of microRNAs and mRNAs in human placentas from pregnancies complicated by preeclampsia and preterm labor. Reprod Sci. 2011. January;18(1):46–56. doi: 10.1177/1933719110374115. [DOI] [PMC free article] [PubMed] [Google Scholar]
- 13.Pineles BL, Romero R, Montenegro D, et al. Distinct subsets of microRNAs are expressed differentially in the human placentas of patients with preeclampsia. Am J Obstet Gynecol. 2007. March;196(3):261 e1–6. doi: 10.1016/j.ajog.2007.01.008. [DOI] [PubMed] [Google Scholar]
- 14.Wu L, Zhou H, Lin H, et al. Circulating microRNAs are elevated in plasma from severe preeclamptic pregnancies. Reproduction. 2012. March;143(3):389–97. doi: 10.1530/REP-11-0304. [DOI] [PubMed] [Google Scholar]
- 15.Zhang Y, Diao Z, Su L, et al. MicroRNA-155 contributes to preeclampsia by down-regulating CYR61. Am J Obstet Gynecol. 2010. May;202(5):466 e1–7. doi: 10.1016/j.ajog.2010.01.057. [DOI] [PubMed] [Google Scholar]
- 16.Zhu XM, Han T, Sargent IL, et al. Differential expression profile of microRNAs in human placentas from preeclamptic pregnancies vs normal pregnancies. Am J Obstet Gynecol. 2009. June;200(6):661 e1–7. doi: 10.1016/j.ajog.2008.12.045. [DOI] [PubMed] [Google Scholar]
- 17.Murphy MS, Casselman RC, Tayade C, et al. Differential expression of plasma microRNA in preeclamptic patients at delivery and 1 year postpartum. American journal of obstetrics and gynecology. 2015. September;213(3):367 e1–9. doi: 10.1016/j.ajog.2015.05.013. [DOI] [PubMed] [Google Scholar]
- 18.Yang S, Li H, Ge Q, et al. Deregulated microRNA species in the plasma and placenta of patients with preeclampsia. Mol Med Rep. 2015. July;12(1):527–34. doi: 10.3892/mmr.2015.3414. [DOI] [PubMed] [Google Scholar]
- 19.Santillan MK, Leslie KK, Hamilton WS, et al. “Collection of a lifetime: a practical approach to developing a longitudinal collection of women’s healthcare biological samples”. Eur J Obstet Gynecol Reprod Biol. 2014. August;179:94–9. doi: 10.1016/j.ejogrb.2014.05.023. [DOI] [PMC free article] [PubMed] [Google Scholar]
- 20.American College of O, Gynecologists, Task Force on Hypertension in P. Hypertension in pregnancy. Report of the American College of Obstetricians and Gynecologists’ Task Force on Hypertension in Pregnancy. Obstetrics and gynecology. 2013. November;122(5):1122–31. doi: 10.1097/01.AOG.0000437382.03963.88. [DOI] [PubMed] [Google Scholar]
- 21.Livak KJ, Schmittgen TD. Analysis of relative gene expression data using real-time quantitative PCR and the 2(-Delta Delta C(T)) Method. Methods. 2001. December;25(4):402–8. doi: 10.1006/meth.2001.1262. [DOI] [PubMed] [Google Scholar]
- 22.Schmittgen TD, Livak KJ. Analyzing real-time PCR data by the comparative C(T) method. Nature protocols. 2008;3(6):1101–8. [DOI] [PubMed] [Google Scholar]
- 23.Snedecor GW, Cochran WG. Statisical Methods. 8th ed.: Iowa State University Press; 1989. [Google Scholar]
- 24.Crooks GE, Hon G, Chandonia JM, et al. WebLogo: a sequence logo generator. Genome research. 2004. June;14(6):1188–90. doi: 10.1101/gr.849004. [DOI] [PMC free article] [PubMed] [Google Scholar]
- 25.Liang T, Guo L, Liu C. Genome-wide analysis of mir-548 gene family reveals evolutionary and functional implications. Journal of biomedicine & biotechnology. 2012;2012:679563. doi: 10.1155/2012/679563. [DOI] [PMC free article] [PubMed] [Google Scholar]
- 26.Piriyapongsa J, Jordan IK. A family of human microRNA genes from miniature inverted-repeat transposable elements. PloS one. 2007;2(2):e203. doi: 10.1371/journal.pone.0000203. [DOI] [PMC free article] [PubMed] [Google Scholar]
- 27.Villarroya-Beltri C, Baixauli F, Gutierrez-Vazquez C, et al. Sorting it out: regulation of exosome loading. Semin Cancer Biol. 2014. October;28:3–13. doi: 10.1016/j.semcancer.2014.04.009. [DOI] [PMC free article] [PubMed] [Google Scholar]
- 28.Villarroya-Beltri C, Gutierrez-Vazquez C, Sanchez-Cabo F, et al. Sumoylated hnRNPA2B1 controls the sorting of miRNAs into exosomes through binding to specific motifs. Nat Commun. 2013;4:2980. doi: 10.1038/ncomms3980. [DOI] [PMC free article] [PubMed] [Google Scholar]
- 29.Devor EJ, Schickling BM, Leslie KK. microRNA expression patterns across seven cancers are highly correlated and dominated by evolutionarily ancient families. Biomedical reports. 2014. May;2(3):384–387. doi: 10.3892/br.2014.239. [DOI] [PMC free article] [PubMed] [Google Scholar]
- 30.Heimberg AM, Sempere LF, Moy VN, et al. MicroRNAs and the advent of vertebrate morphological complexity. Proceedings of the National Academy of Sciences of the United States of America. 2008. February 26;105(8):2946–50. doi: 10.1073/pnas.0712259105. [DOI] [PMC free article] [PubMed] [Google Scholar]
- 31.Sempere LF, Cole CN, McPeek MA, et al. The phylogenetic distribution of metazoan microRNAs: insights into evolutionary complexity and constraint. Journal of experimental zoology Part B, Molecular and developmental evolution. 2006. November 15;306(6):575–88. doi: 10.1002/jez.b.21118. [DOI] [PubMed] [Google Scholar]
- 32.Wheeler BM, Heimberg AM, Moy VN, et al. The deep evolution of metazoan microRNAs. Evolution & development. 2009. Jan-Feb;11(1):50–68. doi: 10.1111/j.1525-142X.2008.00302.x. [DOI] [PubMed] [Google Scholar]
- 33.Huang X, Yuan T, Tschannen M, et al. Characterization of human plasma-derived exosomal RNAs by deep sequencing. BMC genomics. 2013;14:319. doi: 10.1186/1471-2164-14-319. [DOI] [PMC free article] [PubMed] [Google Scholar]
- 34.Cancer Genome Atlas Research N, Weinstein JN, Collisson EA, et al. The Cancer Genome Atlas Pan-Cancer analysis project. Nature genetics. 2013. October;45(10):1113–20. doi: 10.1038/ng.2764. [DOI] [PMC free article] [PubMed] [Google Scholar]
- 35.Hamilton MP, Rajapakshe K, Hartig SM, et al. Identification of a pan-cancer oncogenic microRNA superfamily anchored by a central core seed motif. Nat Commun. 2013;4:2730. doi: 10.1038/ncomms3730. [DOI] [PMC free article] [PubMed] [Google Scholar]
- 36.Kandoth C, McLellan MD, Vandin F, et al. Mutational landscape and significance across 12 major cancer types. Nature. 2013. October 17;502(7471):333–339. doi: 10.1038/nature12634. [DOI] [PMC free article] [PubMed] [Google Scholar]
- 37.Yang Y, Han L, Yuan Y, et al. Gene co-expression network analysis reveals common system-level properties of prognostic genes across cancer types. Nature communications. 2014;5:3231. doi: 10.1038/ncomms4231. [DOI] [PMC free article] [PubMed] [Google Scholar]
- 38.Gilad S, Meiri E, Yogev Y, et al. Serum microRNAs are promising novel biomarkers. PLoS One. 2008. September 5;3(9):e3148. doi: 10.1371/journal.pone.0003148. [DOI] [PMC free article] [PubMed] [Google Scholar]
- 39.Li J, Wang Y, Luo J, et al. miR-134 inhibits epithelial to mesenchymal transition by targeting FOXM1 in non-small cell lung cancer cells. FEBS letters. 2012. October 19;586(20):3761–5. doi: 10.1016/j.febslet.2012.09.016. [DOI] [PubMed] [Google Scholar]
- 40.Wang Z, Banerjee S, Kong D, et al. Down-regulation of Forkhead Box M1 transcription factor leads to the inhibition of invasion and angiogenesis of pancreatic cancer cells. Cancer research. 2007. September 1;67(17):8293–300. doi: 10.1158/0008-5472.CAN-07-1265. [DOI] [PubMed] [Google Scholar]
- 41.Rajakumar A, Chu T, Handley DE, et al. Maternal gene expression profiling during pregnancy and preeclampsia in human peripheral blood mononuclear cells. Placenta. 2011. January;32(1):70–8. doi: 10.1016/j.placenta.2010.10.004. [DOI] [PMC free article] [PubMed] [Google Scholar]
- 42.Ge J, Chen Z, Li R, et al. Upregulation of microRNA-196a and microRNA-196b cooperatively correlate with aggressive progression and unfavorable prognosis in patients with colorectal cancer. Cancer cell international. 2014;14(1):128. doi: 10.1186/s12935-014-0128-2. [DOI] [PMC free article] [PubMed] [Google Scholar]
- 43.Ma R, Yan W, Zhang G, et al. Upregulation of miR-196b confers a poor prognosis in glioblastoma patients via inducing a proliferative phenotype. PloS one. 2012;7(6):e38096. doi: 10.1371/journal.pone.0038096. [DOI] [PMC free article] [PubMed] [Google Scholar]
- 44.Campos CB, Marques TM, Pereira RW, et al. Reduced circulating miR-196b levels is associated with preeclampsia. Pregnancy hypertension. 2014. January;4(1):11–3. doi: 10.1016/j.preghy.2013.10.002. [DOI] [PubMed] [Google Scholar]
- 45.Dominguez F, Moreno-Moya JM, Lozoya T, et al. Embryonic miRNA profiles of normal and ectopic pregnancies. PloS one. 2014;9(7):e102185. doi: 10.1371/journal.pone.0102185. [DOI] [PMC free article] [PubMed] [Google Scholar]
- 46.Cai N, Wang YD, Zheng PS. The microRNA-302-367 cluster suppresses the proliferation of cervical carcinoma cells through the novel target AKT1. Rna. 2013. January;19(1):85–95. doi: 10.1261/rna.035295.112. [DOI] [PMC free article] [PubMed] [Google Scholar]
- 47.Chen L, Heikkinen L, Emily Knott K, et al. Evolutionary conservation and function of the human embryonic stem cell specific miR-302/367 cluster. Comparative biochemistry and physiology Part D, Genomics & proteomics. 2015. August 29;16:83–98. doi: 10.1016/j.cbd.2015.08.002. [DOI] [PubMed] [Google Scholar]
- 48.Cudmore MJ, Ahmad S, Sissaoui S, et al. Loss of Akt activity increases circulating soluble endoglin release in preeclampsia: identification of inter-dependency between Akt-1 and heme oxygenase-1. European heart journal. 2012. May;33(9):1150–8. doi: 10.1093/eurheartj/ehr065. [DOI] [PMC free article] [PubMed] [Google Scholar]
- 49.Yang ZZ, Tschopp O, Hemmings-Mieszczak M, et al. Protein kinase B alpha/Akt1 regulates placental development and fetal growth. J Biol Chem. 2003. August 22;278(34):32124–31. doi: 10.1074/jbc.M302847200. [DOI] [PubMed] [Google Scholar]
- 50.Honarpisheh M, Kohler P, von Rauchhaupt E, et al. The Involvement of MicroRNAs in Modulation of Innate and Adaptive Immunity in Systemic Lupus Erythematosus and Lupus Nephritis. J Immunol Res. 2018;2018:4126106. doi: 10.1155/2018/4126106. [DOI] [PMC free article] [PubMed] [Google Scholar]
- 51.Rossato M, Affandi AJ, Thordardottir S, et al. Association of MicroRNA-618 Expression With Altered Frequency and Activation of Plasmacytoid Dendritic Cells in Patients With Systemic Sclerosis. Arthritis Rheumatol. 2017. Sep;69(9):1891–1902. doi: 10.1002/art.40163. [DOI] [PubMed] [Google Scholar]
- 52.Sichien D, Scott CL, Martens L, et al. IRF8 Transcription Factor Controls Survival and Function of Terminally Differentiated Conventional and Plasmacytoid Dendritic Cells, Respectively. Immunity. 2016. September 20;45(3):626–640. doi: 10.1016/j.immuni.2016.08.013. [DOI] [PubMed] [Google Scholar]
- 53.Hambleton S, Salem S, Bustamante J, et al. IRF8 mutations and human dendritic-cell immunodeficiency. N Engl J Med. 2011. July 14;365(2):127–38. doi: 10.1056/NEJMoa1100066. [DOI] [PMC free article] [PubMed] [Google Scholar]
- 54.Nardelli C, Iaffaldano L, Ferrigno M, et al. Characterization and predicted role of the microRNA expression profile in amnion from obese pregnant women. International journal of obesity. 2014. March;38(3):466–9. doi: 10.1038/ijo.2013.121. [DOI] [PubMed] [Google Scholar]
- 55.Tsai PY, Li SH, Chen WN, et al. Differential miR-346 and miR-582–3p Expression in Association with Selected Maternal and Fetal Complications. Int J Mol Sci. 2017. July 19;18(7). doi: 10.3390/ijms18071570. [DOI] [PMC free article] [PubMed] [Google Scholar]
- 56.Bartoszewski R, Brewer JW, Rab A, et al. The unfolded protein response (UPR)-activated transcription factor X-box-binding protein 1 (XBP1) induces microRNA-346 expression that targets the human antigen peptide transporter 1 (TAP1) mRNA and governs immune regulatory genes. The Journal of biological chemistry. 2011. December 2;286(48):41862–70. doi: 10.1074/jbc.M111.304956. [DOI] [PMC free article] [PubMed] [Google Scholar]
- 57.Burton GJ, Yung HW, Cindrova-Davies T, et al. Placental endoplasmic reticulum stress and oxidative stress in the pathophysiology of unexplained intrauterine growth restriction and early onset preeclampsia. Placenta. 2009. March;30 Suppl A:S43–8. doi: 10.1016/j.placenta.2008.11.003. [DOI] [PMC free article] [PubMed] [Google Scholar]
- 58.Veerbeek JH, Tissot Van Patot MC, Burton GJ, et al. Endoplasmic reticulum stress is induced in the human placenta during labour. Placenta. 2015. January;36(1):88–92. doi: 10.1016/j.placenta.2014.11.005. [DOI] [PMC free article] [PubMed] [Google Scholar]