

Abstract
BACKGROUND:
Cutaneous T-cell lymphoma (CTCL) is a rare form of non-Hodgkin lymphoma arising in the skin. Geographic clustering of CTCL has recently been reported, but its association with environmental factors is unknown. Benzene and trichloroethylene (TCE) are environmental toxins with carcinogenic properties. The authors investigated associations between geographic clustering of CTCL incidence in the state of Georgia with benzene and TCE exposure.
METHODS:
The statewide county-level incidence of CTCL within Georgia was obtained from the Georgia Cancer Registry for the years 1999 to 2015. Standardized incidence ratios (SIRs) were calculated by dividing observed cases by expected cases using national incidence rates by age, sex, and race. Clustering of CTCL was analyzed using spatial analyses. County-level concentrations of benzene and TCE between 1996 and 2014 were collected from the Environmental Protection Agency’s National Air Toxics Assessment database. Linear regression analyses on CTCL incidence were performed comparing SIRs with levels of benzene and TCE by county.
RESULTS:
There was significant geographic clustering of CTCL in Georgia, particularly around Atlanta, which was correlated with an increased concentration of benzene and TCE exposure. Among the 4 most populous counties in Georgia, CTCL incidence was between 1.2 and 1.9 times higher than the state average, and benzene and TCE levels were between 2.9 and 8.8 times higher.
CONCLUSIONS:
The current results demonstrate nonrandom geographic clustering of CTCL incidence in Georgia. To the authors’ knowledge, this is the first analysis to identify a correlation between geographic clustering of CTCL and environmental toxic exposures.
Keywords: cutaneous T-cell lymphoma, environmental epidemiology, Environmental Protection Agency (EPA), spatial epidemiology, volatile organic compounds
INTRODUCTION
Cutaneous T-cell lymphoma (CTCL) is a rare subtype of non-Hodgkin lymphoma that refers to a group of lymphoproliferative disorders of the skin. Mycosis fungoides (MF), primary cutaneous anaplastic large-cell lymphoma (pcALCL), and Sezary syndrome (SS) are the most common forms, accounting together for approximately 80% of CTCLs. The incidence rate of CTCL in the United States increased nearly 3-fold from 1970 until 2000 but stabilized in the most recent decade.1,2 CTCL disproportionately affects black male patients, and further studies have shown that black male patients are diagnosed at younger ages and have inferior survival compared with Caucasians.3–5
Although approximately 50% of the increase in CTCL can be attributed to increased diagnosis and reporting of these cancers, this does not fully account for the population trends.6 Clues pointing to attribution of environmental exposure include the concomitant rise in CTCL cases with industrial expansion, increased incidence in nonblood-related relatives, and known associations of occupational chemicals with other hematologic malignancies.7–9 Clustering has been identified in several studies across the globe, including Sweden,10 Canada,11,12 Pittsburgh, Pennsylvania,13 and Texas.5,1 The analysis in Texas found 3 communities in metropolitan Houston with rates of CTCL that were between 5 and 20 times higher than the expected population rate.14 Each of these studies of geographic clustering of CTCL had proposed environmental and occupational exposures as inciting factors, but further analysis of toxic exposures had not previously been performed.
Many occupational chemicals contain carcinogenic properties; however, benzene and trichloroethylene (TCE) are 2 regulated carcinogens that have well established links to hematologic cancers, specifically non-Hodgkin lymphoma.15,16 Benzene is produced from coal and oil, is commonly found in motor fuels, and is a byproduct of gas stations and motor vehicle exhaust. Benzene is also emitted in cigarette smoke, accounting for approximately one-half of the national exposure17. The carcinogenic properties of benzene have been studied extensively, and air levels as low as 1 part per million have been found to be harmful18. TCE is a solvent often used in “degreasing” and is ubiquitously found in dry-cleaning products and to a lesser degree in degreasing consumer products.19
For the current study, the geospatial clustering of CTCL cases in the state of Georgia was investigated using geocoded incidences of CTCL from the Georgia Cancer Registry and demographic data from the US Census Bureau. CTCL incidence was correlated with ambient benzene and/or TCE levels, obtained through the Environmental Protection Agency’s (EPA) National Air Toxics Assessment (NATA) database in each county from 1996 to 2014.
MATERIALS AND METHODS
Patient Demographics and CTCL Data
Our protocol was approved by the Emory Institutional Review Board, the Winship Cancer Institute’s Clinical and Translational Review Committee, and the Georgia Department of Public Health’s Institutional Review Board. Consent was waived given the retrospective nature of the study, individual patients were not contacted, and unmasked data were handled according to Health Insurance Portability and Accountability Act of 1996 privacy standards. Patient identifiers were removed with the exception of census tracts. We included patients aged ≥15 years who had a new diagnosis of CTCL between 1999 and 2015 in the state of Georgia from the Georgia Cancer Registry. International Classification of Diseases for Oncology, third edition, histology codes used for data extraction included 9700 (MF), 9701 (SS), 9702 (mature T-cell lymphoma, not otherwise specified [NOS]), 9705 (angioimmunoblastic T-cell lymphoma), 9708 (subcutaneous panniculitis-like T-cell lymphoma), 9709 (CTCL, NOS), 9714 (anaplastic large cell lymphoma, CD30-positive), 9718 (pcALCL), 9719 (extranodal natural killer/T-cell lymphoma, nasal type), and 9827 (adult T-cell leukemia/lymphoma), and we selected for “primary site of skin,” which was coded 44.0 through 44.9, as documented in prior studies.1
Patient demographic and disease characteristics were collected, including age, sex, race, year of diagnosis, histology, primary site of the cancer, census tract, and county. In total, 1265 cases of CTCL were identified in the period. For the purposes of our analysis, we included only patients who had complete demographic data (race, age, and sex) because the data set from which we obtained national incidence rates was grouped by these demographic data. After excluding patients with missing demographic information, in total, 1239 patients who were diagnosed with CTCL were included in the analysis. Data were analyzed at the county level because of the small incidence of CTCL in each census tract, with >97% of census tracts containing <4 cases from 1999 through 2015.
To assess CTCL risk, standardized incidence ratios (SIRs) were created for each county in Georgia. The SIR was calculated by dividing the observed number of cases of CTCL within each county between 1999 and 2015 by the expected number of CTCL cases between 1999 and 2015. Expected cases per year were estimated by multiplying the national incidence rates for each race-sex-age subgroup by the corresponding number of individuals in each subgroup living in each Georgia county. Numbers of individuals within each subgroup living in Georgia were obtained from the 2010 US Census Data.20 We then multiplied the expected count for each county (for the year 2010) by the number of years of observed data (17 years) to obtain the expected count from 1999 through 2015. We obtained the national incidence rates of CTCL by race, sex, and age group using the National Cancer Institute’s Surveillance, Epidemiology, and End Results (SEER) program21. Subgroups included 8 total combinations of age group (ages 15-59 and ≥60 years), race group (white, nonwhite), and sex (male, female). The SIR for each county i can be calculated using the following formula:
where the expected cases per year in county i equal
and n = the number of subgroups.
An SIR >1.0 indicated a greater increase in the risk of CTCL than would be expected based on the demographic structure of that county.
In addition, crude CTCL incidence rates by county per 100,000 population also were reported, as well as an age-adjusted incidence rate for the state of Georgia, using the US 2000 standard populations.22 SIRs and crude incidence rates also were reported by metropolitan area (Atlanta, Augusta, Columbus, Macon, and Savannah), which were defined by using Metropolitan Statistical Areas.
Benzene and TCE Data
We obtained benzene and TCE exposure levels from the EPA’s NATA database.24 NATA provides an average chemical release estimate for each census tract and county based on several different dispersion models and from the Toxics Release Inventory database, which tracks toxic sites.25 One model, the Assessment System for Population Exposure Nationwide (ASPEN), is a conglomerate of data from state, local, and federal databases on businesses, housing, populations, and meteorology for each census tract and county. Complex data to clearly identify ambient toxic levels are included, such as release location, rate of release, wind speeds, breakdown, and settling of release. A second model called the Hazardous Air Pollutant Exposure Model (HAPEM) is used to estimate the exposure concentration of air toxics through ambient air concentration data, indoor/outdoor microenvironment concentration relationships, population data, and human activity pattern data.26 ASPEN and HAPEM databases were last updated in 2014, with archives from the years 2011, 2005, 2002, 1999, and 1996. We compiled and averaged the data from each of these years. Because of the expected extended exposure time to these chemicals required for a proportional increase in cancer risk, we also averaged the data from just 1996 through 2002 using the ASPEN and HAPEM models and used these data primarily in our analysis. These averaged exposure concentrations of benzene and TCE and their relationship to CTCL provided the basis of our statistical and spatial analyses, as discussed below. Both ASPEN and HAPEM report estimates by microgram per cubic meter (μg/m3).
Spatial Analysis
We used 2 programs to perform the spatial analysis of benzene/TCE and SIRs by county: ArcGIS 10 (Esri [Environmental Systems Research Institute]) and GeoDa 1.12 (The Center for Spatial Data Science of the University of Chicago). Through ArcGIS 10, we uploaded county shapefiles obtained from the US Census Bureau’s 2010 TIGER/Line files.27 These county shapefiles were overlaid with SIRs, benzene, and TCE to provide maps of these variables by county. Next, we created shapefiles with these maps and imported them into GeoDa 1.12 to evaluate the spatial relationship and assess for clustering of the SIRs and the toxins. We performed global and local spatial analyses with GeoDa to characterize the distribution of SIRs and toxins as either clustered, dispersed, or random. The global analysis created a Moran’s I statistic as well as a z-score and pseudo P value to test for statistical significance; these statistics are based on 999 Monte Carlo simulations. Our null hypothesis was that the features are randomly distributed. The Moran’s I statistic measures the spatial correlation and establishes whether the data are clustered (positive) or dispersed (negative). Finally, a Local Moran’s I is used to create cluster maps showing “hot spots,” which represent clusters of high SIRs or benzene/TCE or “cold spots” with clusters of lesser values28.
Statistical Analysis
Associations between SIRs (the measure of CTCL incidence) and benzene and TCE concentration and exposure data (ASPEN and HAPEM) were explored using simple linear regression at the county level. Model assumptions were checked and verified. The software package SAS 9.4 (SAS Institute Inc) was used for these analyses, and statistical significance was assessed at the .05 level.
RESULTS
CTCL and SIR Data
In total, 1239 patients in Georgia who had CTCL were included in the study; of these, 658 patients (53.1%) were male, and 581 (46.9%) were female. The median patient age was 58 years (age range, 15–98 years); 791 patients (63.8%) were white, 433 (35%) were black, and 15 (1.2%) were of another race. Of the 1239 cases, 571 (46.1%) were MF; 413 (33.3%) were CTCL, NOS; 128 (10.3%) were pcALCL; and 127 (10.3%) were another subtype (Table 1). Proportions of MF were 50%, 52.9%, 50.3%, and 51% for Cobb, DeKalb, Fulton, and Gwinnett counties, respectively, indicating consistent rates of the most common subtype among the 4 largest Georgia counties. The overall SIR for the state of Georgia was 0.92. The 4 largest counties in population—Cobb, DeKalb, Fulton, and Gwinnett—had SIRs of 1.1, 1.8, 1.3, and 1.1, respectively. This demonstrated that, although the overall SIR of CTCL in Georgia is lower than the national average, there exists a clustering of increased incidence in these large, urban counties. Respectively, the SIRs for Cobb, DeKalb, Fulton, and Gwinnett counties were 1.2 times, 1.9 times, 1.5 times, and 1.2 times the overall SIR in Georgia (Table 2). SIRs for the major Georgia metropolitan areas of Atlanta, Augusta, Columbus, Macon, and Savannah were 1.2, 0.86, 0.81, 0.65, and 0.72, respectively.
TABLE 1.
Descriptive Statistics for the 1239 Patients With Cutaneous T-Cell Lymphoma
| Characteristic | No. of Patients (%) or Median [Range] |
|---|---|
| Age, y | 58 [15-98] |
| Sex | |
| Male | 658 (53.1) |
| Female | 581 (46.9) |
| Race | |
| White | 791 (63.8) |
| Black | 433 (35.0) |
| Other | 15 (1.2) |
| Subtype | |
| MF | 571 (46.1) |
| CTCL, NOS | 413 (33.3) |
| pcALCL | 128 (10.3) |
| All others | 127 (10.3) |
Abbreviations: CTCL, cutaneous T-cell lymphoma; MF, mycosis fungoides; NOS, not otherwise specified; pcALCL, primary cutaneous anaplastic large cell lymphoma.
TABLE 2.
The Standardized Incidence Ratio and Crude Rate per 100,000 of Cutaneous T-Cell Lymphoma Between 1999 and 2015 for the 4 Largest Counties Surrounding the Atlanta Area and the 5 Major Metropolitan Areas in Georgia
| Area | Observed Cases | SIR | Crude Rate per 100,000 |
|---|---|---|---|
| Georgia | 1239 | 0.92 | 1.0 |
| Cobb County | 102 | 1.1 | 1.2 |
| DeKalb County | 157 | 1.8 | 1.8 |
| Fulton County | 161 | 1.3 | 1.4 |
| Gwinnett County | 102 | 1.1 | 1.1 |
| MSA | |||
| Atlanta | 822 | 1.2 | 1.2 |
| Augusta | 47 | 0.86 | 0.96 |
| Columbus | 30 | 0.81 | 0.91 |
| Macon | 23 | 0.65 | 0.75 |
| Savannah | 36 | 0.72 | 0.79 |
Abbreviations: MSA, Metropolitan Statistical Area; SIR, standardized incidence ratio.
Crude rates per 100,000 population also were reported (Table 2). The crude rate for Georgia was 1.0 cases per 100,000 from 1999 through 2015 (age-adjusted rate, 1.0 cases per 100,000). The crude rates per 100,000 for the 4 largest Atlanta counties were 1.2, 1.8, 1.4, and 1.1 for Cobb, DeKalb, Fulton, and Gwinnett counties, respectively. The crude rates per 100,000 for the major Georgia metropolitan areas were 1.2, 0.96, 0.91, 0.75, and 0.79 for Atlanta, Augusta, Columbus, Macon, and Savannah, respectively.
Benzene and TCE Data
The ASPEN concentrations and HAPEM exposure levels of benzene (in micrograms per cubic meter) per Georgia county, averaged from 1996 through 2002, were 0.73 μg/m3 and 0.71 μg/m3, respectively, which were lower than the national average. In Cobb, DeKalb, Fulton, and Gwinnett counties, however, the average ASPEN concentrations and HAPEM exposure levels of benzene were 2.5 μg/m3, 2.6 μg/m3, 2.8 μg/m3, and 2.3 μg/m3 (ASPEN), respectively, and 2.5 μg/m3, 2.7 μg/m3, 2.7 μg/m3, and 2.4 μg/m3 (HAPEM), respectively. These county estimates were 3.4 times, 3.6 times, 3.8 times, and 3.2 times higher (ASPEN), respectively, and 3.5 times, 3.8 times, 3.8 times, and 3.4 times higher (HAPEM), respectively, than the average values in Georgia. The average ASPEN concentrations and HAPEM exposure levels of TCE in all counties were 0.069 μg/m3 and 0.055 μg/m3, respectively; the TCE ASPEN concentrations in Cobb, DeKalb, Fulton, and Gwinnett counties were 0.61 μg/m3, 0.21 μg/m3, 0.26 μg/m3, and 0.20 μg/m3, respectively; whereas the TCE HAPEM exposure levels in Cobb, DeKalb, Fulton, and Gwinnett counties were 0.35 μg/m3, 0.16 μg/m3, 0.20 μg/m3, and 0.17 μg/m3, respectively. These TCE estimates were 8.8 times, 3.0 times, 3.8 times, and 2.9 times higher (ASPEN), respectively, and 6.4 times, 2.9 times, 3.6 times, and 3.1 times higher (HAPEM), respectively, than the average TCE concentrations in Georgia.
Spatial Analysis
SIR, benzene, and TCE maps are provided in Figures 1 and 2, with categories defined using quintiles. Areas of high SIRs, benzene levels, and TCE levels tended to be concentrated in and around metropolitan Atlanta, as well as in isolated pockets throughout southern Georgia. Cobb, DeKalb, Fulton and Gwinnett counties all lie in the highest quintile for SIR, benzene, and TCE. The Moran’s I statistics and P values for SIRs, benzene ASPEN concentrations and HAPEM exposure levels, and TCE ASPEN concentrations and HAPEM exposure levels were 0.099 (P = .022), 0.58 (P = .001), 0.62 (P = .001), 0.37 (P = .001), and 0.47 (P = .001), respectively. These positive, statistically significant values indicated that clustering exists in Georgia for all of these variables. The Local Moran’s I map for the SIR (Fig. 3) identified hot spots and cold spots throughout Georgia. Fulton, DeKalb, Cobb, Clayton, and Rockdale counties in metropolitan Atlanta, and Oglethorpe, Wilkes, and Warren counties to the west of Augusta represented “high-high” areas of SIR (ie, areas of high SIR surrounded by other areas of high SIR). In addition, we identified a cluster of lower SIRs, located in southwest Georgia. This “low-low” area of SIRs contained counties with lower estimates of both benzene and TCE.
Figure 1.
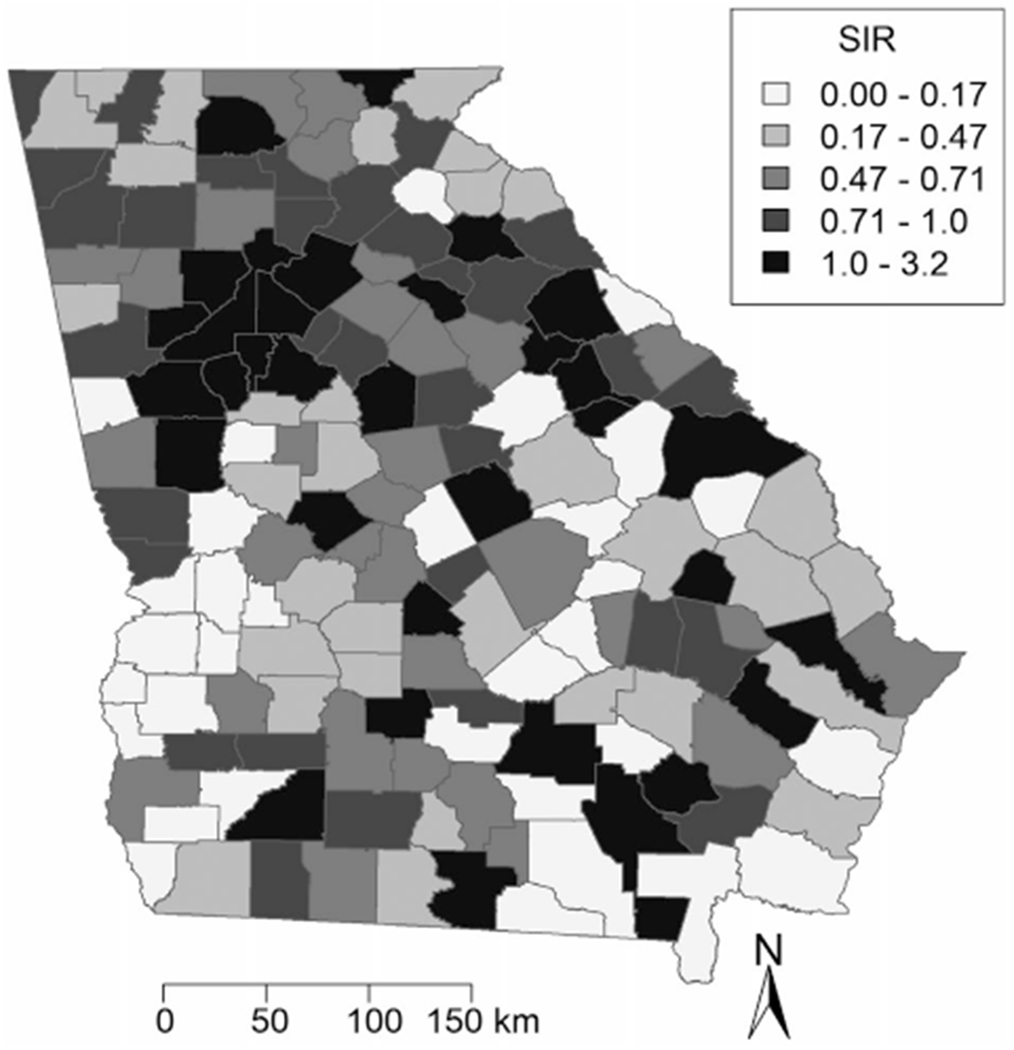
Standardized incidence ratios (SIR) of cutaneous T-cell lymphoma are illustrated for each county in Georgia, aggregating cases from 1999 through 2015.
Figure 2.
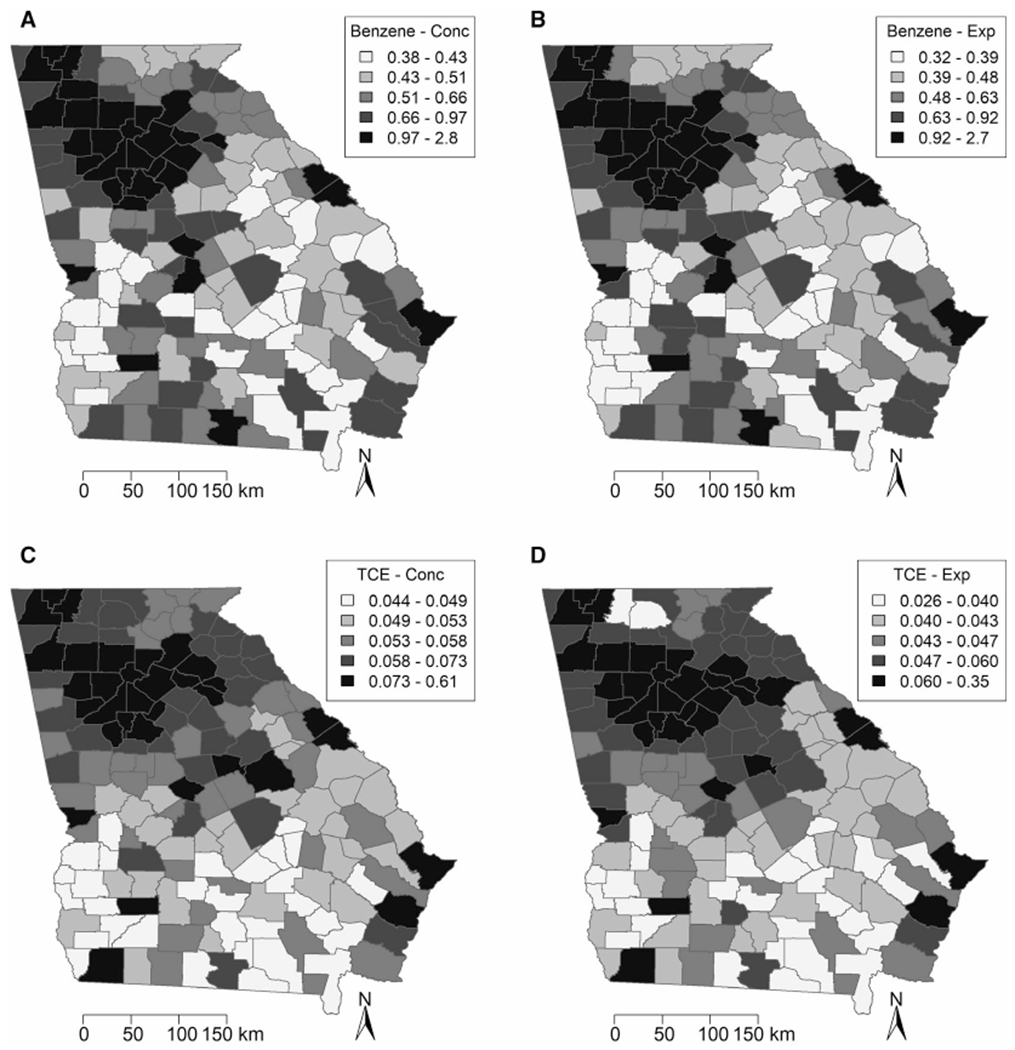
Images illustrate (A) Assessment System for Population Exposure Nationwide (ASPEN) concentrations (Conc) (in μg/m3) and (B) Hazardous Air Pollutant Exposure Model exposure (Exp) (in μg/m3) estimates for benzene, and (C) Assessment System for Population Exposure Nationwide concentrations (in μg/m3) and (D) and Hazardous Air Pollutant Exposure Model exposure (in μg/m3) estimates for trichloroethylene (TCE) for each county in Georgia.
Figure 3.
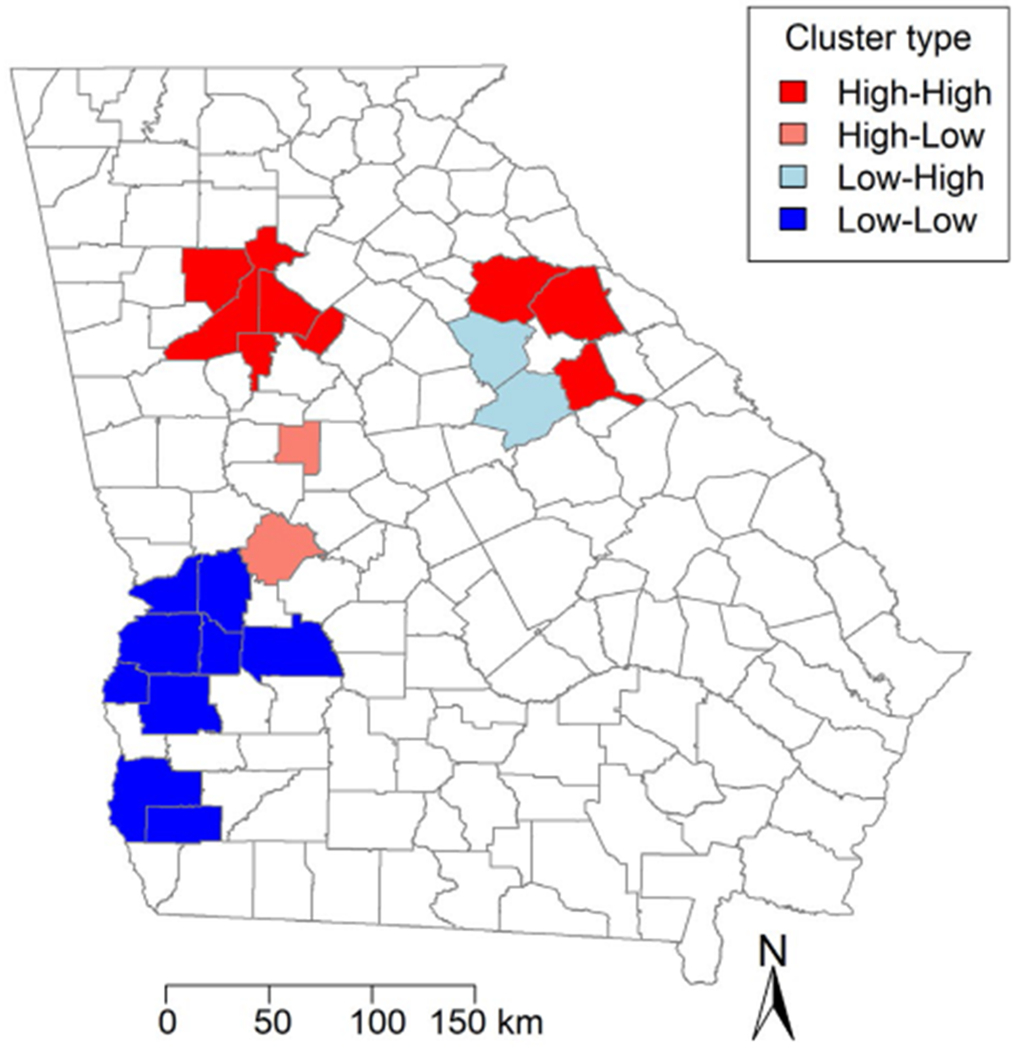
Local Moran’s / statistic results are illustrated by Georgia county. Dark red indicates “high-high” areas or areas of high values surrounded by other areas of high values; light red, “high-low” areas; light blue, “low-high” areas; and dark blue, “low-low” areas.
Statistical Analysis
We performed a simple linear regression analysis at the county level with SIR as the dependent variable and either benzene levels in μg/m3 or TCE levels in μg/m3 (ASPEN and HAPEM) as the independent variable for each of the 159 counties in Georgia. The resulting statistics are presented in Table 3. The β1 estimates and P values for SIR and benzene ASPEN concentrations (μg/m3) and for SIR and TCE ASPEN concentrations (μg/m3) were 0.34 (P < .001) and 2.1 (P = .0078), respectively. In addition, the β1 estimates and P values for SIR and benzene HAPEM exposure (μg/m3) and TCE HAPEM exposure (μg/m3) were 0.34 (P < .001) and 3.7 (P = .0025), respectively. The positive, significant values of β1 indicate that, for a 1-unit increase in μg/m3 in the benzene/TCE exposure level and concentration, there is an increased SIR by the corresponding value of β1. R2 values ranged from 4.4% to 8.2%, indicating that at least 4.4% of the variation in SIR is explained by regressing benzene/TCE concentration and exposure on SIR Estimates from HAPEM exposure were more strongly associated with SIR for both benzene and TCE compared with ASPEN concentration.
TABLE 3.
Linear Regression Parameters Estimates for Benzene and Trichloroethylene
| Variable | No. of Counties | β1 [95% CI] | P | R2 |
|---|---|---|---|---|
| Benzene, μg/m3 | ||||
| Concentration (ASPEN) | 159 | 0.34 [0.15-0.52] | <.001 | 0.077 |
| Exposure (HAPEM) | 159 | 0.34 [0.16-0.52] | <.001 | 0.082 |
| TCE, μg/m3 | ||||
| Concentration (ASPEN) | 159 | 2.1 [0.56-3.7] | .0078 | 0.044 |
| Exposure (HAPEM) | 159 | 3.7 [1.3-6.1] | .0025 | 0.057 |
Abbreviations: ASPEN, Assessment System for Population Exposure Nationwide; HAPEM, Hazardous Air Pollutant Exposure Model; TCE, trichloroethylene.
DISCUSSION
CTCL is an uncommon but devastating malignancy in advanced stages, with a median survival of <5 years29. Geographic clustering has been identified in several regions nationally and internationally, particularly in urban and industrial regions.10“1 However, the environmental risk factors for CTCL have not been previously evaluated. We found that increased exposure to the environmental toxins benzene and TCE was associated with increased incidence of CTCL in the state of Georgia, possibly explaining the increased incidence in urban and industrial areas from prior studies.
We identified 1265 new cases of CTCL diagnosed between 1999 and 2015 from the Georgia Cancer Registry. Full demographic data were available for 1239 of these patients and were used along with data from SEER and the US Census Bureau to establish SIRs for each county, taking into account race, sex, and age. Although the SIR in Georgia was <1.0, some areas exhibited incidence ratios well above the expected incidence. These areas included the most populous counties in Georgia surrounding the Atlanta area (Cobb, DeKalb, Fulton, and Gwinnett). Our spatial analysis further identified clusters of higher than expected CTCL incidence within Georgia that included Cobb, DeKalb, and Fulton counties, where the SIRs were up to 1.9 times the state’s overall SIR. We expected significantly higher concentrations and exposure levels of benzene and TCE in more populous counties because these chemicals are found in motor vehicle exhaust, gasoline, coal and oil burning, tobacco smoke, and dry-cleaning products. Consistent with our hypothesis, there were higher levels of ambient exposure in all 4 of the most populous counties that correlated to higher SIRs of CTCL. Ambient benzene levels were up to 3.8 times higher in the 4 metropolitan counties surrounding Atlanta, and TCE was up to 8.8 times higher than the average for Georgia. Both TCE and benzene were highly correlated to increased incidence of CTCL, such that an increase in TCE or benzene at the county level led to a statistically significant increase in the SIR. Surprisingly, other metropolitan areas, including Augusta, Columbus, Macon, and Savannah, had lower SIRs than Georgia as a state. However, whereas Augusta itself had a lower SIR, the metropolitan communities surrounding Augusta were identified as “hot-spots” on spatial clustering. “Cold-spots” also were identified in southwest Georgia, which is the least populated region in the state.
Our results support several prior analyses describing geographic clustering of CTCL in industrial areas.11– 14 In a Canadian analysis of 6685 patients from 1992 through 2010, CTCL incidence increased over time and had nonrandom geographic clustering.12 CTCL rates were analyzed by Canadian province, city, and postal code. Land-use maps were used to correlate the distribution of regions that had high incidence rates with land use, and many of the “hot-spots” were noted to be in industrial zones. Deeper analysis at the street level revealed additional clustering within the high-incidence regions that also were linked to industrial sites. Similarly, data from the Texas registry, including 1047 patients from The University of Texas MD Anderson Cancer Center and 1990 patients from the Texas Cancer Registry, indicated geographic clustering in the Houston metropolitan area; however, no links to etiologic factors were postulated.14 In contrast, a smaller study analyzing 274 patients with CTCL in the greater Pittsburgh area failed to find a correlation between environmental hazards and case distribution when controlling for dermatologist density.13 However, that study was underpowered to detect an association between environmental toxins and CTCL incidence and was biased in its selection of patients from a single academic hospital with an affiliated dermatology practice as part of a multidisciplinary CTCL clinic.
The current study had some limitations. Given the rarity of the disease, often with <5 cases per census tract, we were obligated to use larger geographic units; therefore, data were analyzed at the county level instead of the census tract. Exposure may vary significantly between census tracts in a county, so the aggregation is a significant limitation. Other limitations include the absence of data on cofounders, such as income and education level. In addition, all cases of CTCL may not have been captured if CTCL was misclassified as peripheral T-cell lymphoma or T-cell lymphoma NOS, and a skin primary was not included in the diagnosis. Although our findings were highly statistically significant, the relative contribution of TCE and benzene exposure to CTCL incidence in our analysis was small, accounting for only 4% to 8% of the variance in SIRs. The etiology and risk factors for CTCL are likely multifactorial. To further assess the risk of these and other toxins not included in this report, our results should be confirmed though a larger nationwide assessment of CTCL incidence that includes a broader list of regulated environmental toxins.
Overall, the current study demonstrates that geographic clustering of CTCL is correlated with exposure to the environmental toxins TCE and benzene in the state of Georgia, suggesting a possible etiologic role of pollution. To our knowledge, our data are the first to establish the association between benzene and TCE and the incidence of CTCL. Identifying specific etiologic triggers for CTCL has significant clinical implications because it may suggest a need for increased skin protection in certain high-risk exposure environments to reduce the risk of CTCL in the future or simply for increased awareness of the risks of exposure. Our findings should be validated in larger national and international studies that include efforts to identify the remaining triggers, such as infections, radioactivity, and other chemical agents.
Acknowledgments
FUNDING SUPPORT
The research reported in this publication was supported in part by the Biostatistics and Bioinformatics Shared Resource of Winship Cancer Institute of Emory University and the National Institutes of Health/National Cancer Institute under award P30 CA138292. The content is solely the responsibility of the authors and does not necessarily represent the official views of the National Institutes of Health.
CONFLICT OF INTEREST DISCLOSURES
Mary Jo Lechowicz reports personal fees from ADC Therapeutics and Kyowa Kirin’s outside the submitted work. Christopher R. Flowers reports research funding from The V Foundation and the National Cancer Institute (grant K24 CA208132) during the conduct of the study; research funding from AbbVie, Acerta, Bayer, BeiGene, the Burroughs Wellcome Fund, Celgene, the Eastern Cooperative Oncology Group, Genentech/Roche, Gilead Sciences, Infinity Pharmaceuticals, Janssen Pharmaceutical, Millennium/Takeda, the National Institutes of Health (NCI U01Ca195568 and U01CA220401), Onyx Pharmaceuticals, Pharmacyclics, Spectrum, and TG Therapeutics outside the submitted work; personal fees from Pharmacyclics, Genentech/Roche, OptumRx, Karyopharm, Gilead Sciences, Janssen Pharmaceutical, Spectrum, Denovo Biopharma, Bayer, and AbbVie outside the submitted work; and travel expenses from Genentech, Biogen-Idec, Roche, and Millennium/Takeda outside the submitted work. Pamela B. Allen reports personal fees from Bayer outside the submitted work. The remaining authors made no disclosures.
REFERENCES
- 1.Korgavkar K, Xiong M, Weinstock M. Changing incidence trends of cutaneous T-cell lymphoma. JAMA Dermatol. 2013;149:1295–1299. [DOI] [PubMed] [Google Scholar]
- 2.Criscione VD, Weinstock MA. Incidence of cutaneous T-cell lymphoma in the United States, 1973-2002. Arch Dermatol. 2007;143:854–859. [DOI] [PubMed] [Google Scholar]
- 3.Wilson LD, Hinds GA, Yu JB. Age, race, sex, stage, and incidence of cutaneous lymphoma. Clin Lymphoma Myeloma Leuk. 2012;12:291–296. [DOI] [PMC free article] [PubMed] [Google Scholar]
- 4.Imam MH, Shenoy PJ, Flowers CR, Phillips A, Lechowicz MJ. Incidence and survival patterns of cutaneous T-cell lymphomas in the United States. Leuk Lymphoma. 2013;54:752–759. [DOI] [PubMed] [Google Scholar]
- 5.Litvinov IV, Tetzlaff MT, Rahme E, et al. Demographic patterns of cutaneous T-cell lymphoma incidence in Texas based on two different cancer registries. Cancer Med. 2015;4:1440–1447. [DOI] [PMC free article] [PubMed] [Google Scholar]
- 6.Hartge P, Devesa SS. Quantification of the impact of known risk factors on time trends in non-Hodgkin’s lymphoma incidence. Cancer Res. 1992;52(19 suppl):5566s–5569s. [PubMed] [Google Scholar]
- 7.Lozano A, Duvic M. Cutaneous T-cell lymphoma in non-blood-related family members: report of an additional case. J Am Acad Dermatol. 2007;56:521. [DOI] [PubMed] [Google Scholar]
- 8.Ghazawi FM, Alghazawi N, Le M, et al. Environmental and other extrinsic risk factors contributing to the pathogenesis of cutaneous T cell lymphoma (CTCL). Front Oncol. 2019;9:300. [DOI] [PMC free article] [PubMed] [Google Scholar]
- 9.Smith MT. Advances in understanding benzene health effects and susceptibility. Annu Rev Public Health. 2010;31:133–148. [DOI] [PMC free article] [PubMed] [Google Scholar]
- 10.Gip L, Nilsson E. [Clustering of mycosis fungoides in the County of Vasternorrland]. Lakartidningen. 1977;74:1174–1176. [PubMed] [Google Scholar]
- 11.Ghazawi FM, Netchiporouk E, Rahme E, et al. Distribution and clustering of cutaneous T-cell lymphoma (CTCL) cases in Canada during 1992 to 2010. J Cutan Med Surg. 2018;22:154–165. [DOI] [PubMed] [Google Scholar]
- 12.Ghazawi FM, Netchiporouk E, Rahme E, et al. Comprehensive analysis of cutaneous T-cell lymphoma (CTCL) incidence and mortality in Canada reveals changing trends and geographic clustering for this malignancy. Cancer. 2017;123:3550–3567. [DOI] [PubMed] [Google Scholar]
- 13.Moreau JF, Buchanich JM, Geskin JZ, Akilov OE, Geskin LJ. Nonrandom geographic distribution of patients with cutaneous T-cell lymphoma in the Greater Pittsburgh Area. Dermatol Online J. 2014;20: pii: 13030/qt4nw7592w. [PubMed] [Google Scholar]
- 14.Litvinov IV, Tetzlaff MT, Rahme E, et al. Identification of geographic clustering and regions spared by the cutaneous T-cell lymphoma in Texas using 2 distinct cancer registries. Cancer. 2015;121:1993–2003. [DOI] [PMC free article] [PubMed] [Google Scholar]
- 15.Switchenko JM, Bulka C, Ward K, et al. Resolving uncertainty in the spatial relationships between passive benzene exposure and risk of non-Hodgkin lymphoma. Cancer Epidemiol. 2016;41:139–151. [DOI] [PMC free article] [PubMed] [Google Scholar]
- 16.Bassig BA, Zhang L, Vermeulen R, et al. Comparison of hematological alterations and markers of B-cell activation in workers exposed to benzene, formaldehyde and trichloroethylene. Carcinogenesis. 2016;37:692–700. [DOI] [PMC free article] [PubMed] [Google Scholar]
- 17.Wilbur S, Wohlers D, Paikoff S, Keith LS, Faroon O. ATSDR evaluation of potential for human exposure to benzene. Toxicol Ind Health. 2008;24(5-6):399–442. [DOI] [PubMed] [Google Scholar]
- 18.Rinsky RA, Hornung RW, Silver SR, Tseng CY. Benzene exposure and hematopoietic mortality: a long-term epidemiologic risk assessment. Am J Ind Med. 2002;42:474–480. [DOI] [PubMed] [Google Scholar]
- 19.US Environmental Protection Agency. Fact Sheet on Tricholoroethylene (TCE). Accessed March 1, 2019 https://www.epa.gov/assessing-and-managing-chemicals-under-tsca/fact-sheet-trichloroethylene-tce
- 20.US Census Bureau. Decennial Census of Population and Housing. Accessed November 1, 2018 https://www.census.gov/programs-surveys/decennialcensus/data/datasets.2010.html
- 21.Surveillance Epidemiology, and End Results (SEER) Program. SEER*Stat Database: Incidence-SEER 18 Registries Research Data, November 2017 Submission (2000-2015) <Katrina/Rita Population Adjustment>. National Cancer Institute, Division of Cancer Control and Population Sciences, Surveillance Research Program; 2017. [Google Scholar]
- 22.Surveillance Epidemiology, and End Results (SEER) Program. Step 3: Calculating Age-Adjusted Rates. Accessed October 16, 2019 https://seer.cancer.gov/seerstat/tutorials/aarates/step3.html
- 23.US Census Bureau. 2010. Office of Management and Budget (OMB) Standards. Accessed October 16, 2019 https://www.census.gov/programs-surveys/metro-micro/about/omb-standards.html
- 24.US Environmental Protection Agency. National Air Toxics Assessment. Accessed March 1, 2019 https://www.epa.gov/national-air-toxics-assessment
- 25.US Environmental Protection Agency. Toxic Release Inventory (TRI) Program. Accessed March 1, 2019 https://www.epa.gov/toxics-release-inventory-tri-program
- 26.US Environmental Protection Agency. Human Exposure Modeling—Hazardous Air Pollutant Exposure Model (HAPEM). Accessed March 1, 2019 https://www.epa.gov/fera/human-exposure-modeling-hazardous-air-pollutant-exposure-model-hapem
- 27.US Census Bureau. TIGER/Line Shapefiles and TIGER/Line Files. Accessed November 1, 2018 https://www.census.gov/geo/maps-data/data/tiger-line.html
- 28.Anselin L, Syabri I, Kho Y. GeoDa: an introduction to spatial data analysis. Geogr Anal. 2006;38:5–22. [Google Scholar]
- 29.Quaglino P, Maule M, Prince HM, et al. Global patterns of care in advanced stage mycosis fungoides/Sezary syndrome: a multicenter retrospective follow-up study from the Cutaneous Lymphoma International Consortium. Ann Oncol. 2017;28:2517–2525. [DOI] [PubMed] [Google Scholar]