

Abstract
Anti-cancer uses of non-oncology drugs have occasionally been found, but such discoveries have been serendipitous. We sought to create a public resource containing the growth inhibitory activity of 4,518 drugs tested across 578 human cancer cell lines. We used PRISM, a molecular barcoding method, to screen drugs against cell lines in pools. An unexpectedly large number of non-oncology drugs selectively inhibited subsets of cancer cell lines in a manner predictable from the cell lines’ molecular features. Our findings include compounds that killed by inducing PDE3A-SLFN12 complex formation; vanadium-containing compounds whose killing depended on the sulfate transporter SLC26A2; the alcohol dependence drug disulfiram, which killed cells with low expression of metallothioneins; and the anti-inflammatory drug tepoxalin, which killed via the multi-drug resistance protein ABCB1. The PRISM drug repurposing resource (https://depmap.org/repurposing) is a starting point to develop new oncology therapeutics, and more rarely, for potential direct clinical translation.
The prospect of repurposing existing drugs for new clinical indications is alluring: rapid clinical translation can occur for drugs already proven safe in humans. In principle, existing drugs can also establish starting points for drug development when new targets of old drugs are discovered. To date, most oncology repurposing discoveries have been serendipitous; systematic, at-scale screening of the entire pharmacopeia has not been feasible. The extent to which non-oncology drugs have potential as future cancer therapeutics is unknown.
Recent efforts, however, have demonstrated the power of large-scale cancer cell line screening – testing either a large number of compounds across a limited number of cell lines (e.g., the NCI-60 panel1), or a modest number of oncology compounds across a large number of cell lines (e.g., the GDSC project at the Sanger Institute2 and the CTD2 project at the Broad Institute3) (Fig. 1a). The ideal study would involve screening a large number of drugs (the majority of which are non-oncology drugs) across a large panel of genomically characterized cell lines so as to capture the molecular diversity of human cancer.
Fig 1. Generation of the PRISM Repurposing dataset.
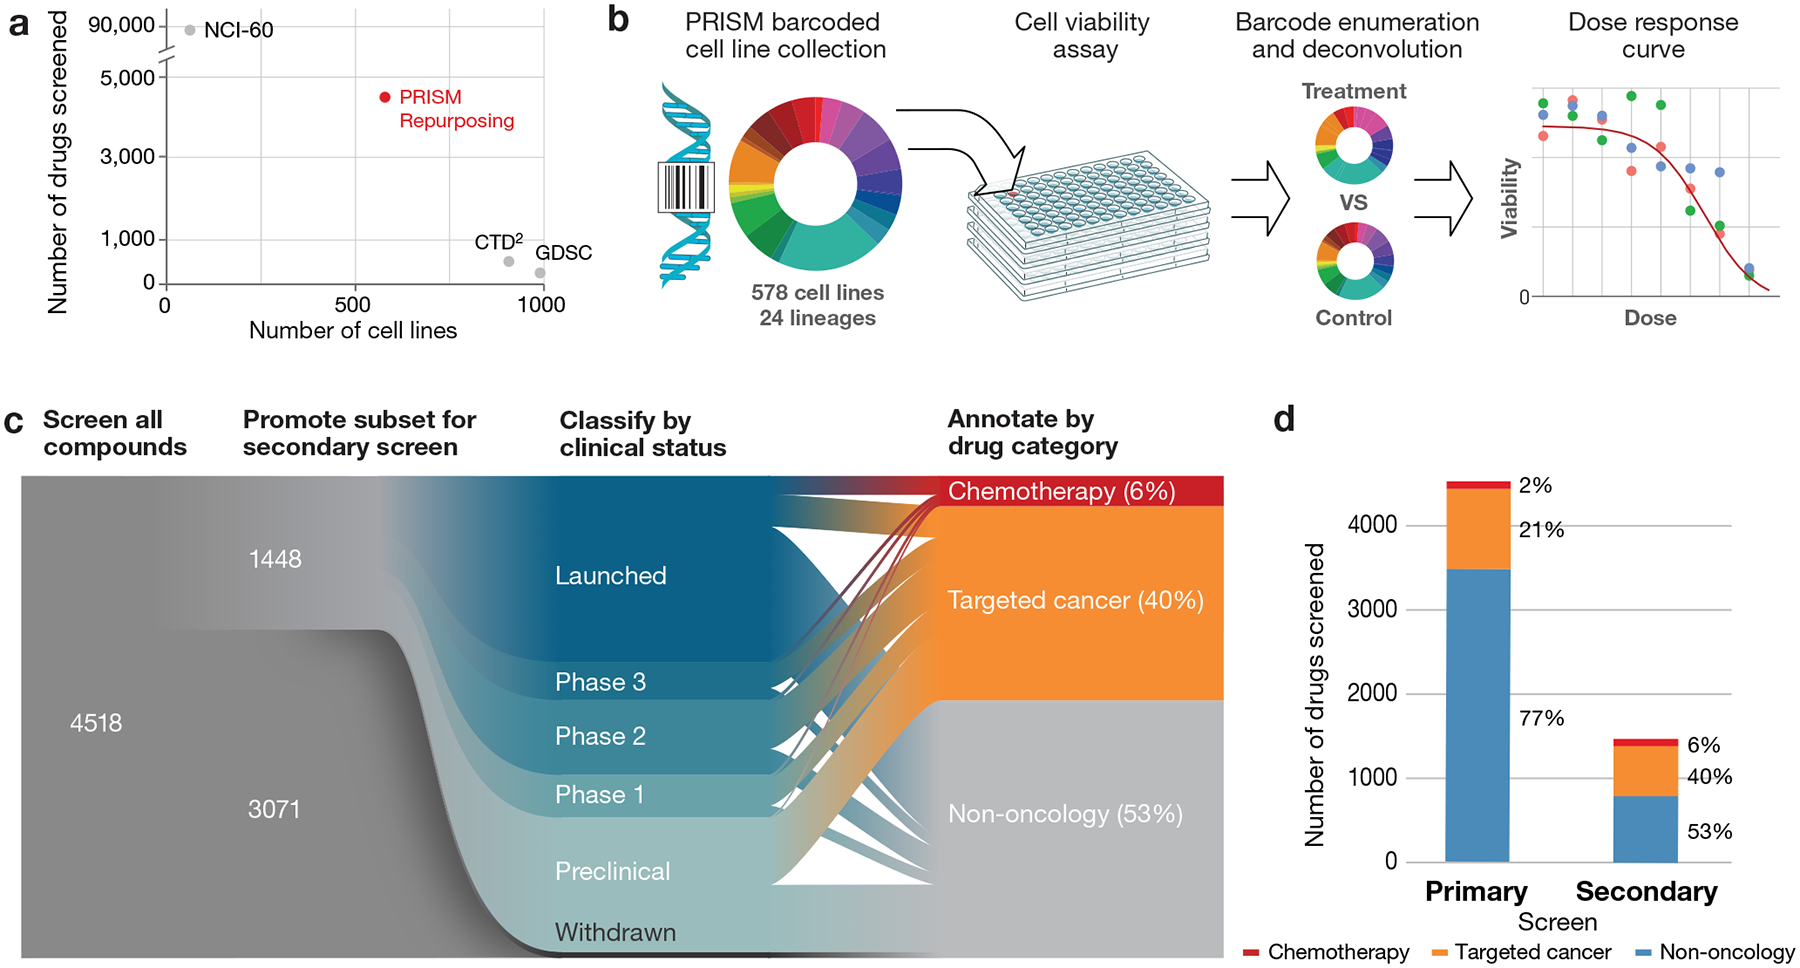
a, Dimensionality of publicly available pharmacogenomic drug screening experiments. The PRISM Repurposing dataset contains approximately ten-fold more compounds than CTD2 and approximately ten-fold more cell lines than NCI-60. b, PRISM method overview. Barcoded cell lines are pooled in groups of 25 and treated with chemical perturbagens. Pools are lysed 5days after perturbation and the relative abundance of mRNA barcodes is measured using Luminex MagPlex Microspheres to estimate cell viability. c, Repurposing screen workflow. A primary screen of 4,518 drugs was performed at 2.5 μM, followed by retesting of 1,448 active drugs at 8 doses. Compounds were annotated as chemotherapy drugs, targeted cancer drugs, or non-oncology drugs based on approved indications and prior clinical trial disease areas. d, Drug category representation in the primary and secondary screens. The secondary screen was enriched for chemotherapies and targeted cancer therapies.
We report here the feasibility of using the PRISM molecular barcoding and multiplexed screening method to test 4,518 existing drugs against 578 cancer cell lines. We find that non-oncology drugs have an unexpectedly high rate of anti-cancer activity. The sensitivity of cancer cell lines to many of these compounds can be predicted from the genomic features of the cell lines, thereby suggesting potentially relevant patient populations.
RESULTS
Drug selection and PRISM profiling
To facilitate the screening of thousands of compounds across hundreds of cell lines, we used the PRISM method. Cancer cell lines are labeled with unique DNA sequences, thereby allowing barcoded cell lines to be pooled with relative barcode abundance serving as a surrogate for cellular viability4 (Fig. 1b). We screened 578 adherent cell lines spanning 24 tumor types (Extended Data Fig. 1a, Supplementary Table 1).
We chose 4,518 drugs from the Drug Repurposing Hub5 (https://www.broadinstitute.org/repurposing) and confirmed the identity and purity of all compounds to be greater than 75% pure by liquid chromatography-mass spectrometry (LC-MS) (Supplementary Table 2). 3,350 of the compounds (74%) are either approved for clinical use in the United States or Europe, or are in clinical development. The remaining 1,168 (26%) are tool compounds with known activities. The majority of the compounds, 3,466 (77%), were non-oncology related, with the remaining compounds being either chemotherapeutics (2%) or targeted oncology agents (21%).
Screening results
We employed a 2-stage screening strategy whereby drugs were first screened in triplicate at a single dose (2.5 μM). 1,448 screening positives were then re-screened in triplicate in an 8-point dose-response ranging from 10 μM to 600 pM (Fig. 1c, Supplementary Table 2). Interestingly, the majority of active compounds (774 out of 1,448, 53%) were originally developed for non-oncology clinical indications (Fig. 1d). The primary and secondary screening datasets are available on the Cancer Dependency Map portal (https://depmap.org/repurposing) and Figshare (doi:10.6084/m9.figshare.9393293) (Extended Data Fig. 1–4). We compared the PRISM results to two gold standard datasets: GDSC2 and CTD23. The three datasets shared 84 compounds tested on a median of 236 common cell lines, yielding 16,650 shared data points. The PRISM dataset had a similar degree of concordance to GDSC and CTD2 (Pearson correlations of 0.60 and 0.61, respectively, over all shared data points), as the GDSC and CTD2 datasets had to each other (Pearson correlation 0.62) (Extended Data Fig. 5a). The three datasets remained similarly concordant when the analysis was restricted to data points showing evidence of anti-cancer activity (Extended Data Fig. 5b). We conclude that, despite differences in assay format, sources of compounds5, and sources of cell lines6, the PRISM Repurposing dataset is similarly robust compared to existing pharmacogenomic datasets.
At the level of individual compound dose responses, we note that the PRISM Repurposing dataset tends to be somewhat noisier, with a higher standard error estimated from vehicle control measurements (Extended Data Fig. 5c, Extended Data Fig. 6a–c). This variation may be explained by a combination of a longer assay duration, a smaller number of cells assayed, and/or variation attributable to growing cells in pools. Such noise, however, was not substantial enough to preclude the discovery of anti-cancer activities or their associated predictive biomarkers (see below).
Landscape of non-oncology drug effects on cancer viability
We performed unsupervised clustering of compound viability profiles independent of their functional annotations using the Uniform Manifold Approximation and Projection (UMAP) method7 (Fig. 2a; interactive plot available at https://depmap.org/repurposing). Compounds with similar mechanisms of action (MOA) tended to cluster together, indicating that expected activities were recovered by the PRISM assay. Interestingly, while we expected to recover known MOAs for cancer drugs, we also found clusters of functionally related non-cancer drugs, such as vitamin D receptor agonists and HMG-CoA reductase inhibitors. Of note, some functionally-related classes (e.g., glucocorticoid receptor agonists) showed two or more distinct clusters, suggesting that biologically relevant substructures may exist within the dataset.
Fig 2. Drug response landscape of human cancer cell lines.
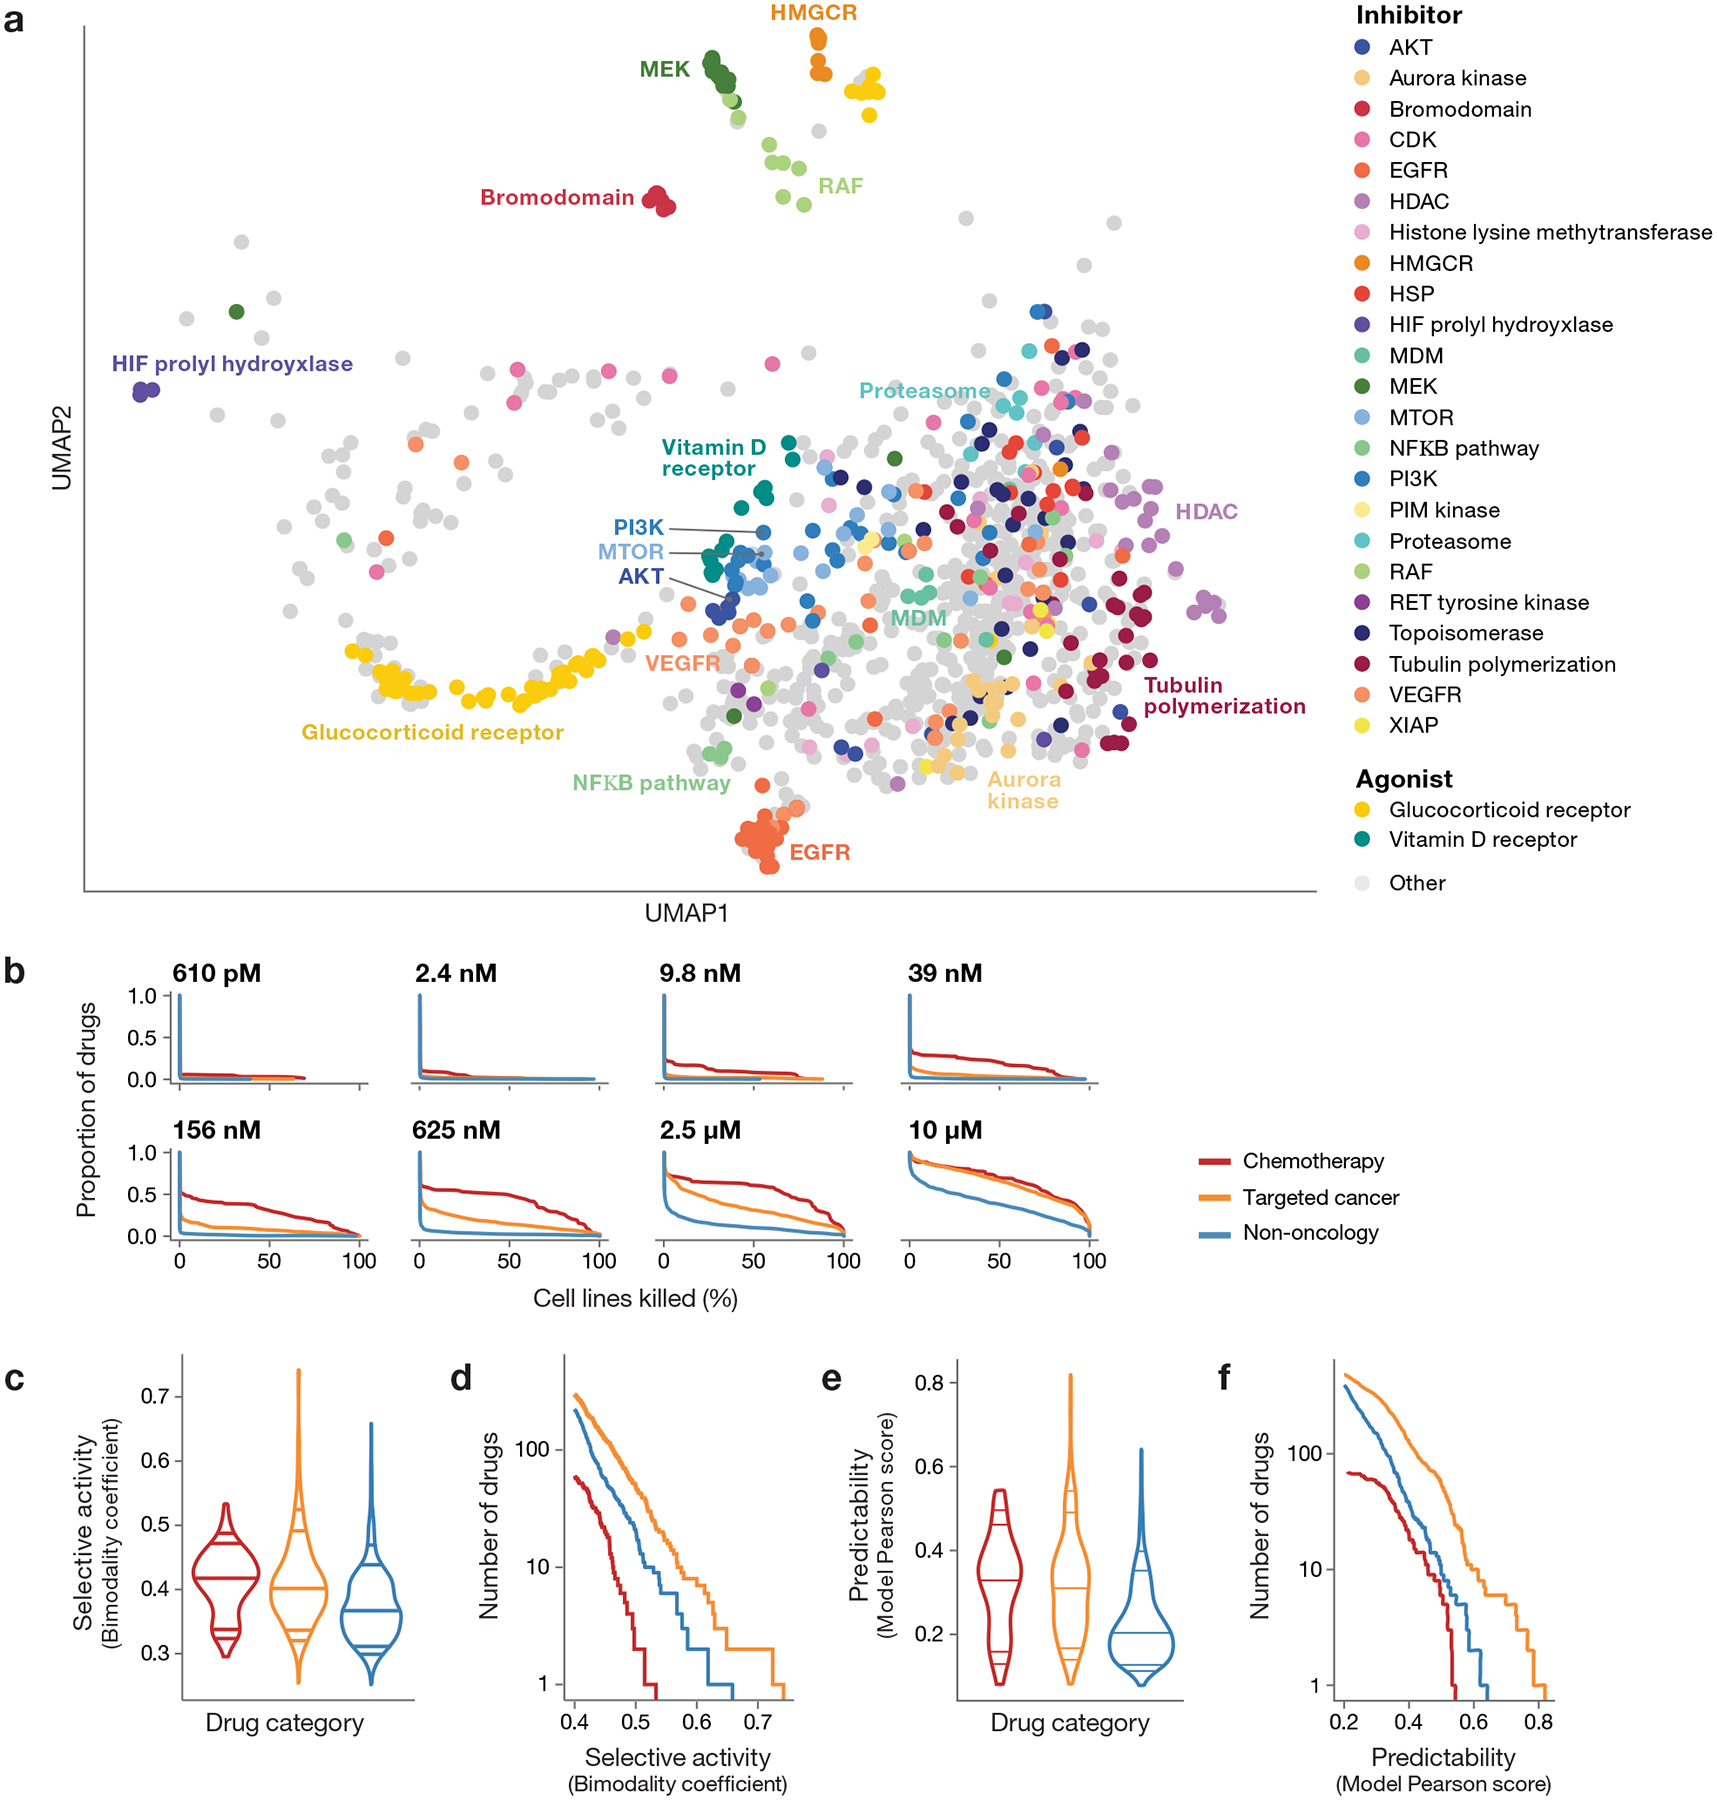
a, Two-dimensional UMAP projection of 990 drug killing profiles by cosine similarity. Compounds with shared annotated mechanism of action are labeled by color (n = 640 compounds). Compounds with average Pearson correlation below 0.25 across 3 independent plates in one PRISM screen are not shown. b, Secondary screen drug activity by dose. Complementary cumulative distribution functions for the percent of cell lines killed in each drug category (chemotherapy: n = 90 compounds, targeted cancer: n = 584 compounds, non-oncology: n = 774 compounds) at each dose of the secondary screen are shown. c, Selective compound activity by drug category. The global distribution of secondary screen bimodality coefficients is shown. Dosewise bimodality coefficients are calculated from log fold-change viability data; the maximum bimodality coefficient is shown for each compound. Violin plot lines correspond to the 5th, 10th, 50th, 90th, and 95th quantiles. d, Most selective sensitivity profiles by drug category. The number of drugs (y-axis) from each drug category with a bimodality coefficient at any dose greater than a given threshold (x-axis) are shown. For visualization purposes, only drugs with bimodality coefficient ≥ 0.4 are included. e, Predictability of compound activity by drug category. (chemotherapy: n = 90, targeted cancer: n = 584, non-oncology: n = 774). Global distribution of secondary screen Pearson scores is shown. ATLANTIS random forest models are trained to predict PRISM log fold-change values using cell line baseline omics and genomic perturbation profiles. The global distribution of secondary screen Pearson scores, defined as the correlation between actual and predicted PRISM profiles, is shown. The maximum Pearson score across all models is used for each compound. Violin plot lines correspond to the 5th, 10th, 50th, 90th, and 95th quantiles. f, Most predictable sensitivity profiles by drug category. The number of drugs (y-axis) from each drug category with a predictive model with a Pearson score greater than a given threshold (x-axis) are shown. For visualization purposes, only drugs with a maximum Pearson score ≥ 0.2 are included.
In general, chemotherapeutics killed the most cell lines and non-oncology drugs the fewest, with targeted oncology drugs being intermediate (Fig. 2b). However, this pattern was highly dose-dependent: at high doses, targeted agents lost their selectivity. Perhaps most interestingly, a subset of non-oncology drugs showed particularly potent activity: 91 drugs killed at least 1% of cell lines at a concentration of 625 nM or lower.
To further investigate the therapeutic potential of non-oncology drugs, we computed the bimodality coefficient8 of each compound’s dose-wise viability profile (Extended Data Fig. 6d, Supplementary Table 3) and then calculated the maximum for each compound. While non-oncology drugs showed less bimodality than cancer drugs on average (Fig. 2c), the most selective compounds in the dataset include non-oncology drugs (Fig. 2d). This provides further evidence that large-scale testing of non-cancer drugs can reveal selective anti-cancer activity.
Predictive models of killing activity
We next addressed the extent to which cell-killing activity was predictable based on the cell lines’ genomic features. For each drug, we used the random forest-based ATLANTIS algorithm9 employing the baseline molecular features (cell lineage; gene copy number; function-damaging, hotspot, or missense mutations; DNA methylation levels; mRNA, miRNA, protein or metabolite abundance) and genetic dependencies (genome-scale CRISPR/Cas9 knockout or RNA interference) as inputs to the model10–14. The majority of highly predictable killing profiles came from targeted oncology drugs, compared to chemotherapeutics or non-oncology drugs (Fig. 2e, Supplementary Tables 4–5). This is not surprising, as targeted oncology drugs have been optimized for their selective killing of subtypes of cancer. More striking was the observation that a substantial number of non-oncology drugs had highly predictable patterns of killing (38 with a Pearson score > 0.4 in the secondary screen, Fig. 2f).
Interestingly, mRNA expression was by far the most predictive feature type compared to other categories of genomic information (Fig. 3a). This observation is consistent with the findings of other pharmacogenomic screens15,16 as well as shRNA-based functional genomic screens9. By contrast, Iorio et al. reported that mutation, not gene expression, was most predictive of drug response within a cancer type. Whether that is explained by their focus on known cancer drugs (e.g., kinase inhibitors), as opposed to all classes of drugs analyzed in the present dataset remains to be determined17. Importantly, only rarely (in 0.8% of cases) did the pattern of killing by active non-oncology drugs correlate with knockout or knockdown of the drug’s intended target (versus 15.0% of active oncology drugs) (Fig. 3b, Supplementary Table 6). This suggests that the unexpected anti-cancer activity of non-oncology drugs is most likely explained by a previously unrecognized mechanism of action.
Fig 3. Predictors of drug sensitivity and comparison with genetic dependencies.
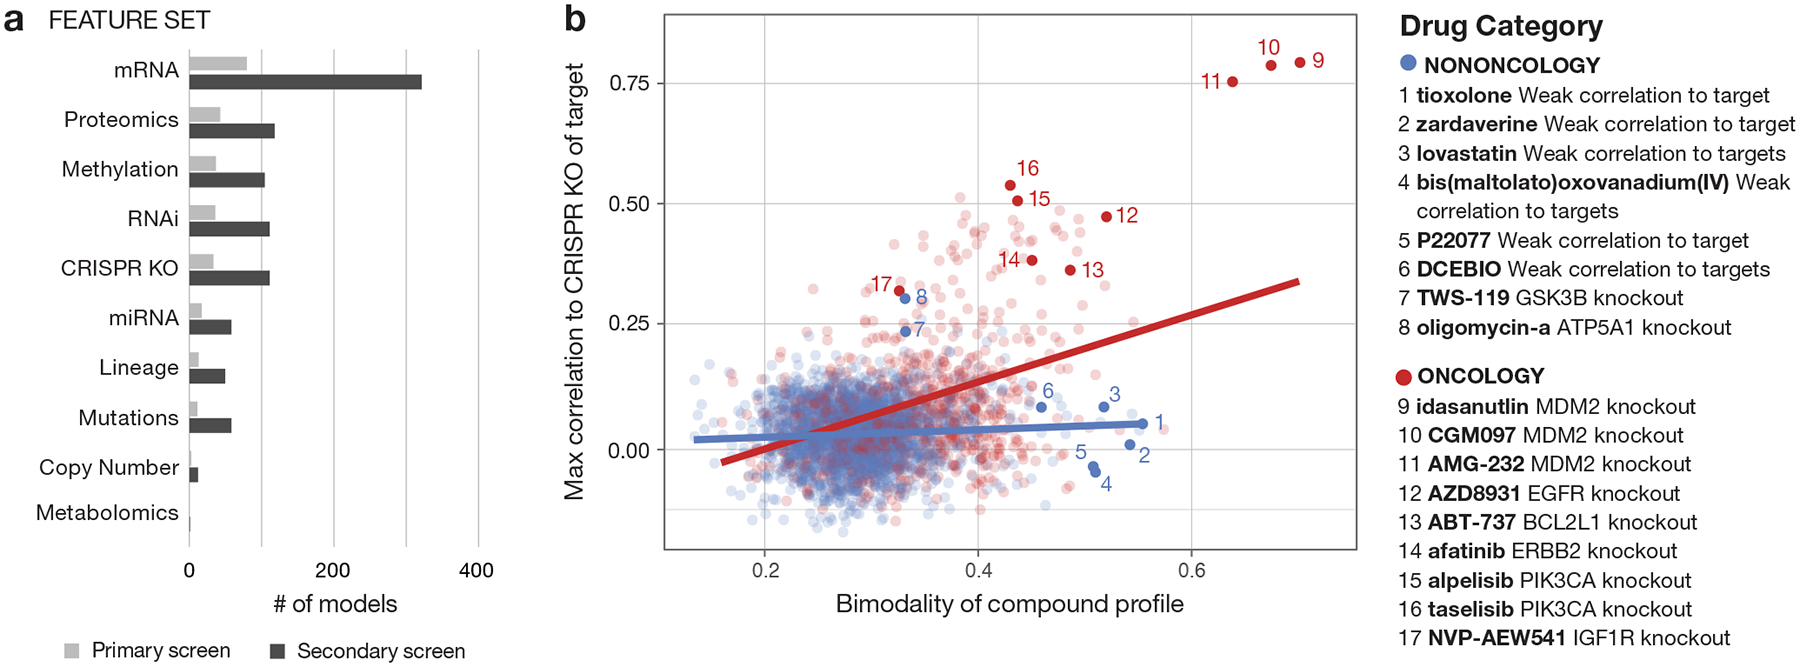
a, Contributions of different genomic feature types to strong predictive models. A weighted set of genomic features predictive of drug activity is determined using the ATLANTIS implementation of random forest. Models with a Pearson score ≥ 0.4 are included. b, Relationship between bimodality coefficient of PRISM viability profile and correlation with CRISPR knockout of annotated gene target (oncology: n = 885 compounds, non-oncology: n = 2361 compounds). Pearson correlations are computed between the primary screen log fold-change profile of each compound and the DepMap Avana CRISPR/Cas9 gene knockout scores (CERES) of its annotated targets. For compounds with multiple target annotations, the maximum correlation is shown. Bimodality coefficients are calculated over cell lines shared by each compound and target shown. Linear regression lines are shown.
In the primary screen, 195 non-oncology drugs had predictable killing with Pearson score > 0.2, and 23 were predictable with a Pearson score > 0.4. This same phenomenon of highly predictable non-oncology drug killing was observed when predictability was plotted against the bimodality score (Fig. 4). The most predictable, bimodal non-oncology drugs (right plot; upper right-hand quadrant, Supplementary Tables 3–4) represent the drugs of greatest interest for future mechanistic follow-up. We describe four of these compounds in the sections that follow.
Fig 4. Predictive biomarker discovery using the PRISM Repurposing dataset.
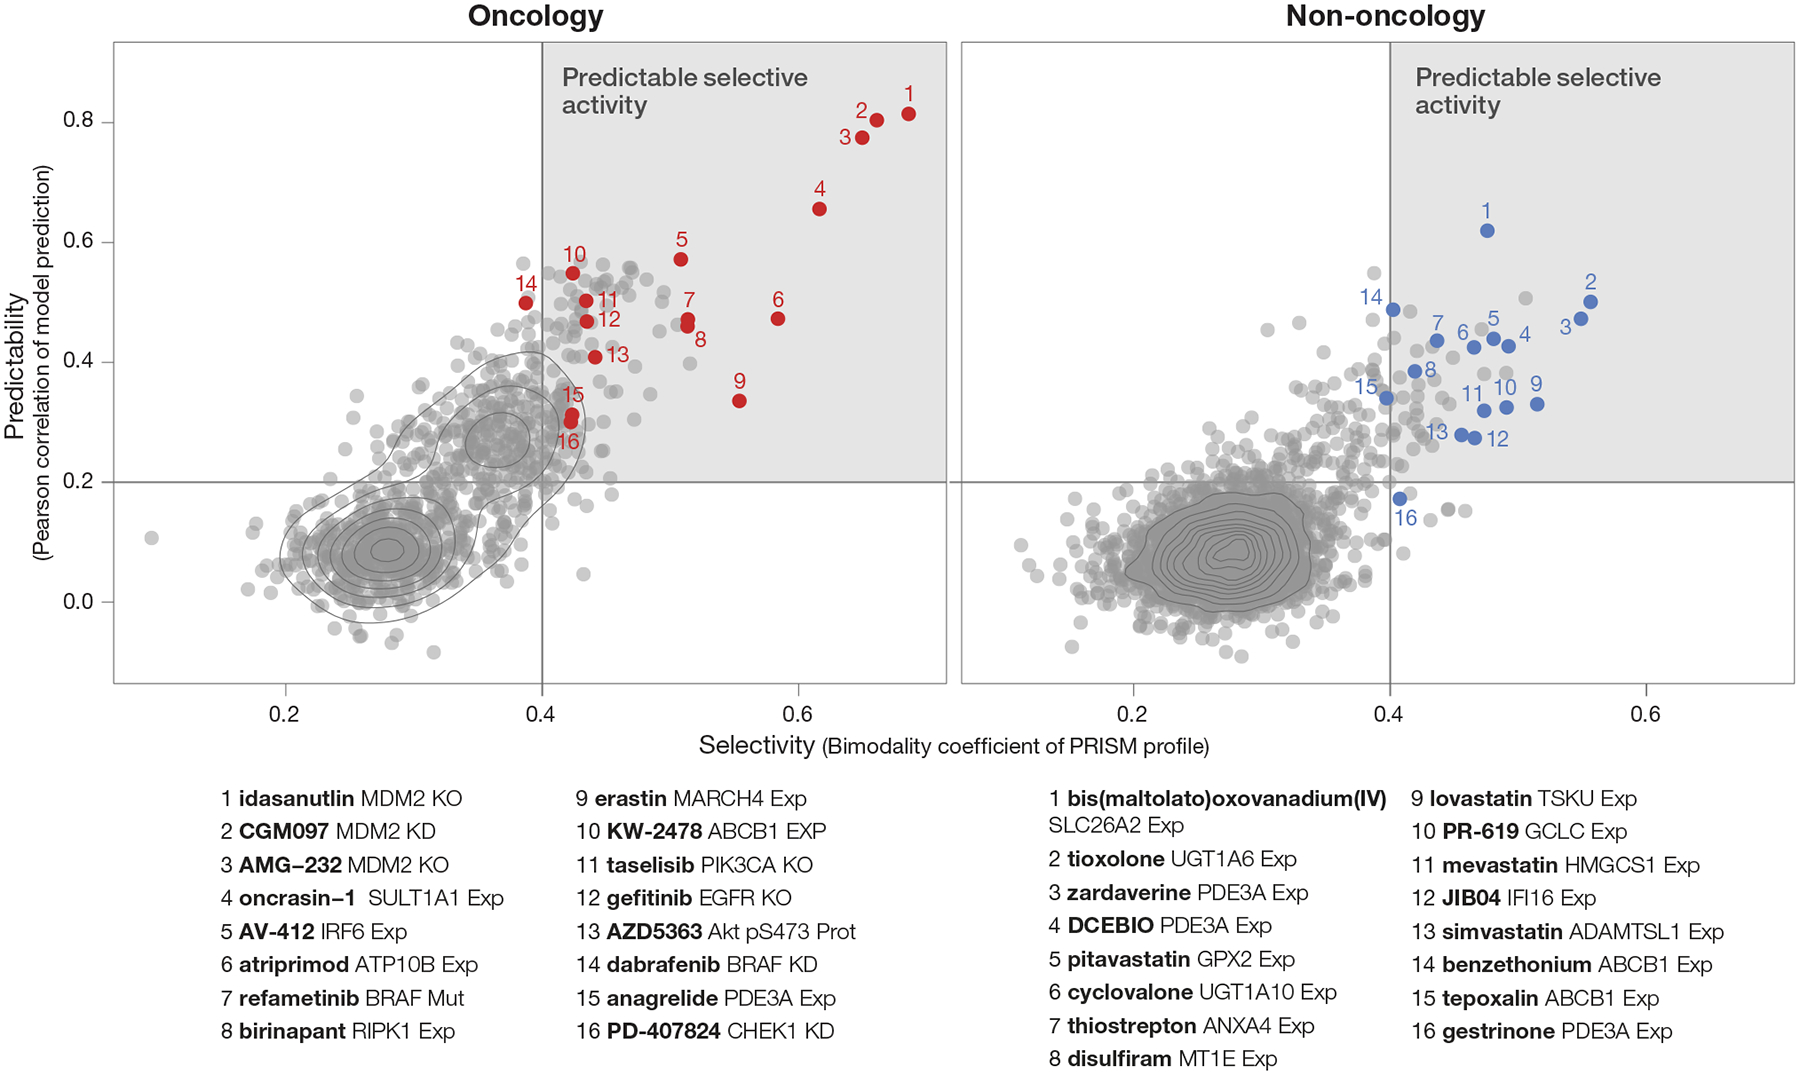
Prioritization of compounds based on strength of predictive models (Pearson score) and cell line selectivity (bimodality coefficient). Both known oncology (n = 997 compounds) and non-oncology (n = 3,443 compounds) sets contain compounds with high selectivity and predictability (strong model performance; upper right quadrant).
Inducers of PDE3A-SLFN12 protein-protein interaction
Among the genomic features most highly correlated with non-oncology drug activity was the expression of the gene PDE3A (phosphodiesterase 3A), whose expression correlated with killing by 11 structurally diverse compounds. These included the known PDE3A inhibitors anagrelide and zardaverine, progesterone receptor agonists (including the nonsteroidal drug tanaproget), the kinase inhibitor AG-1296, and the potassium channel activator DCEBIO (Fig. 5a). This pattern of killing was of particular interest because of the recent report of cancer cytotoxicity occurring as a result of protein-protein interaction between PDE3A and the largely uncharacterized protein SLFN1218. We found that the structurally diverse compounds identified in the PRISM screen bound PDE3A in a thermal shift assay (Fig. 5b, Supplementary Table 7) and inhibited PDE3A enzymatic activity (Supplementary Table 7). Their cytotoxicity was completely rescuable by either PDE3A knockout or by competition with trequinsin, a potent PDE3A small-molecule inhibitor that does not induce PDE3A-SLFN12 interaction18 (Fig. 5c). Importantly, PDE3A pull-down resulted in co-immunoprecipitation of V5-tagged SLFN12 following compound treatment, indicating that these compounds indeed induced PDE3A-SLFN12 protein-protein interaction (Fig. 5d). We consistently observed that, while complex formation predicts compound sensitivity, the strength of the PDE3A-SLFN12 interaction does not directly correlate with HeLa cell line IC50 (Fig. 5d, Supplementary Table 7). Taken together, the PRISM results show that an unexpectedly large number of structurally diverse non-oncology drugs kill PDE3A-expressing cancer cells by stabilizing the PDE3A-SLFN12 interaction. While these compounds have limited potency, they may prove useful as starting points for further medicinal chemistry optimization of this anti-cancer mechanism.
Fig 5. Multiple existing drugs selectively kill cancer cell lines by stimulating PDE3A-SLFN12 interaction.
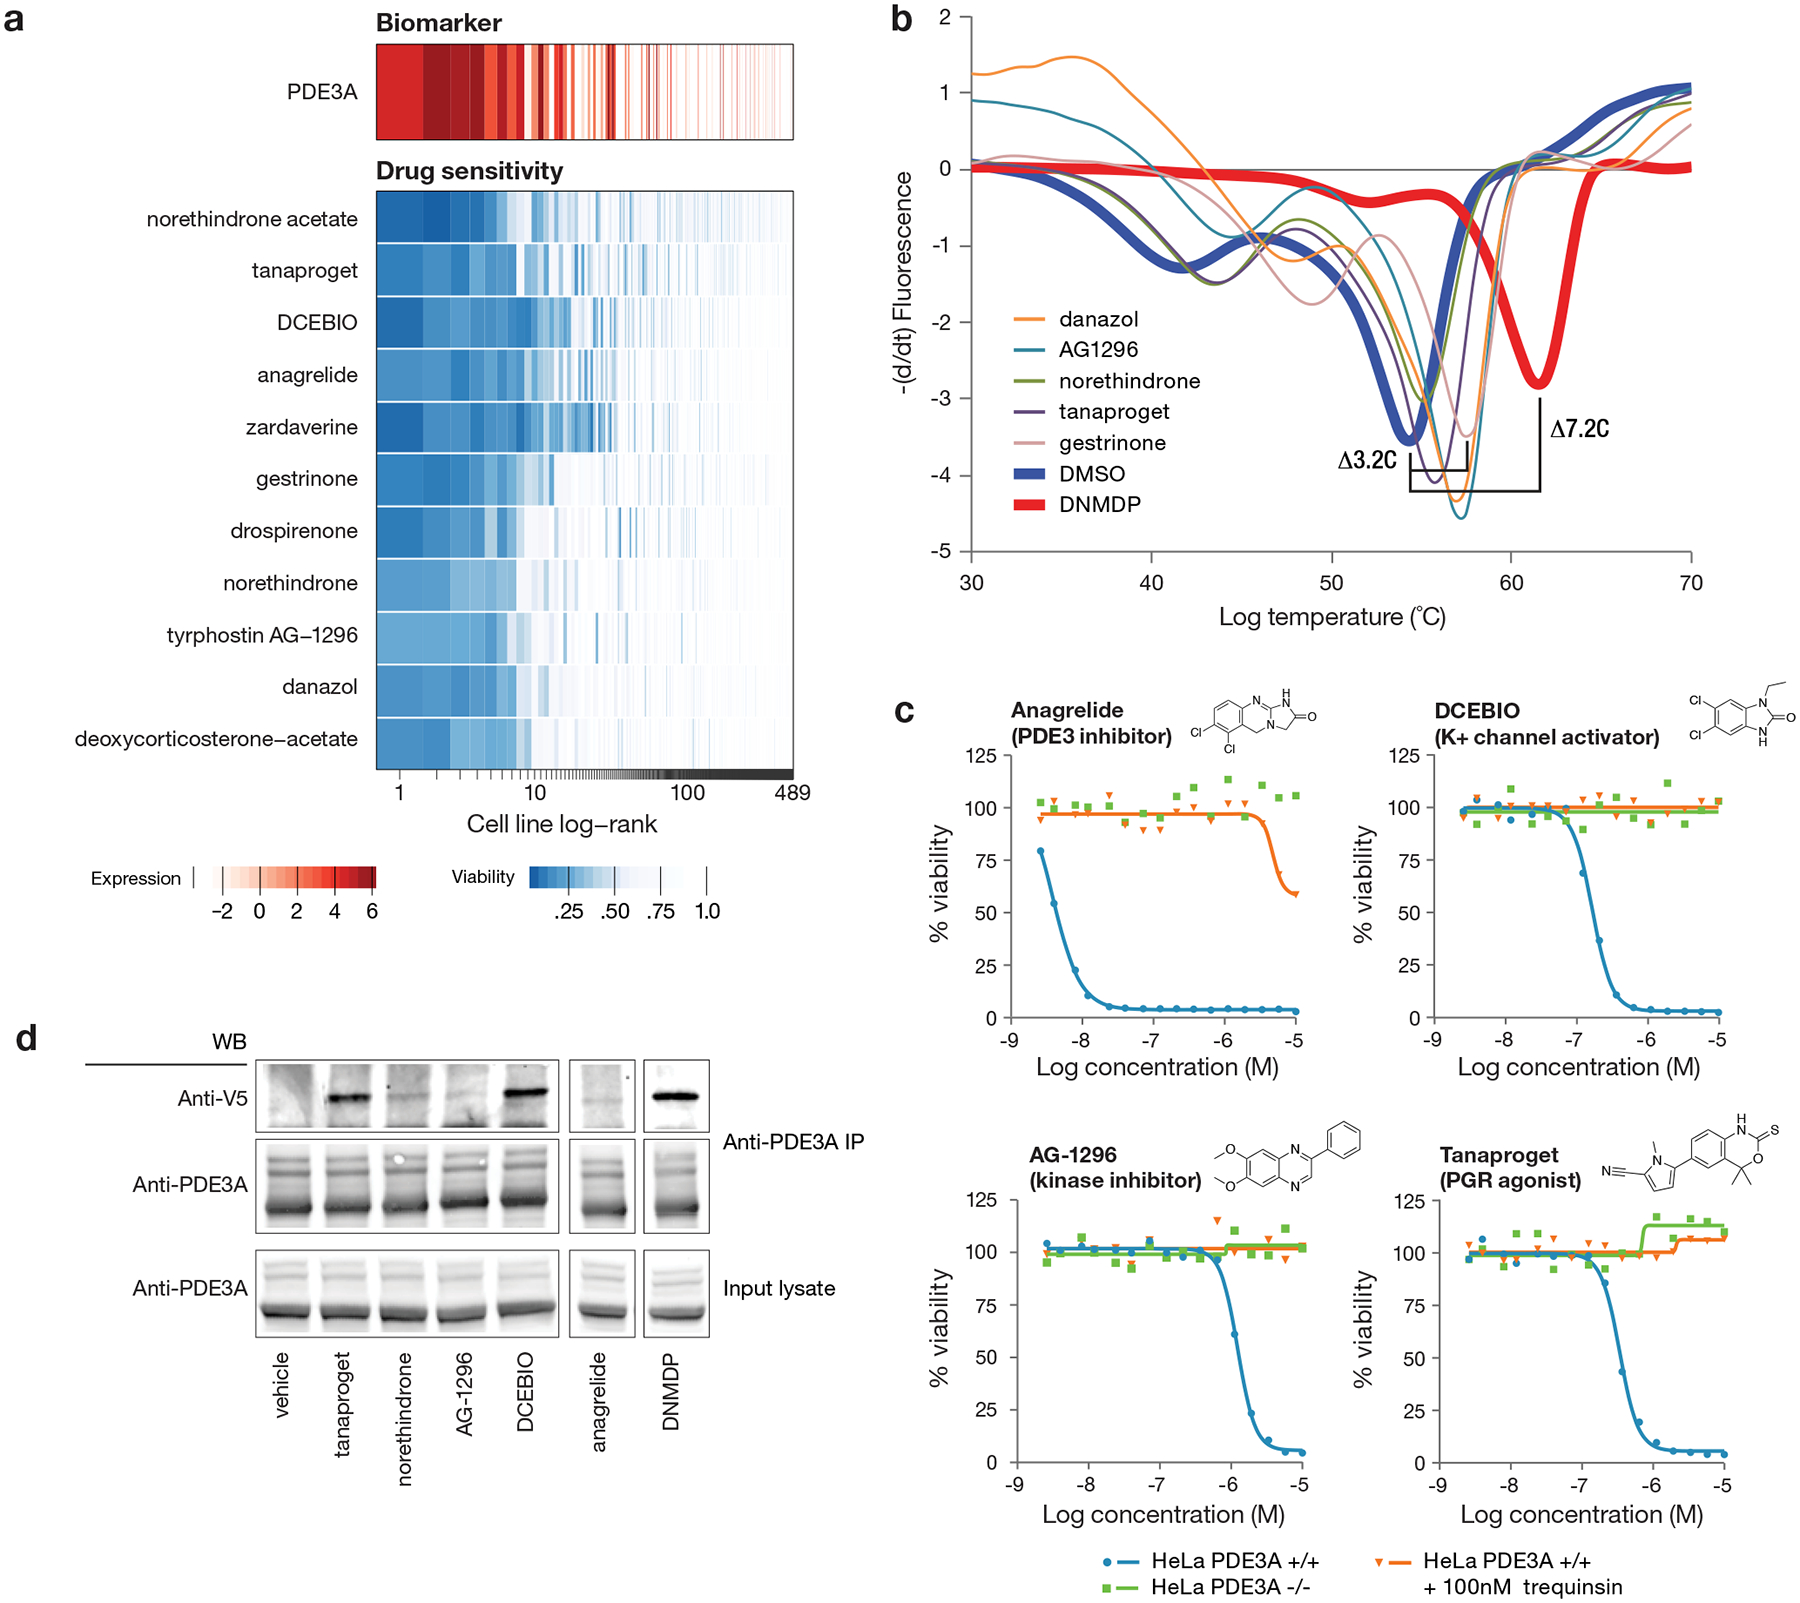
a, Drug sensitivity profiles associated with high PDE3A RNA expression (n = 489 cell lines, n = 11 compounds). PDE3A gene expression from CCLE RNAseq data (log2 RPKM; red) and cell line viability (blue) are indicated by color. Compounds where PDE3A expression was the top predictive biomarker by ATLANTIS from the PRISM 2.5 μM primary screen are shown. Cell lines are ranked by mean viability of indicated compounds with a ceiling at 1 (100%). b, Thermal shift assay performed with recombinant PDE3A. Stabilization of PDE3A protein is seen for a subset of hit compounds. DNMDP is included as established positive control for strong PDE3A binding. Full ΔTm results are shown in Supplementary Table 9. Results are representative of two independent experiments. c, HeLa cell line dose response curves with PDE3A genetic loss or pharmacologic inhibition. Knockout of PDE3A was performed by CRISPR/Cas9. Parental HeLa cell killing was rescued by co-treatment with 100 nM of the non-cytotoxic PDE3A inhibitor trequinsin. Mean viability across two independently treated wells in one experiment is shown. d, Co-immunoprecipitation of V5-tagged SLFN12. PDE3A-modulating compounds induce complex formation between PDE3A and SLFN12. Anti-V5 western blot shown using lysates from HeLa cells treated with the indicated compound at 10 μM for 8 hours. The anagrelide and DNMDP lanes were run on the same gel as all other samples and were cropped for figure purposes. Anagrelide and DNMDP results are consistent across three independent experiments. All other compounds were tested twice, with the exception of norethindrone (tested once with the expected results).
Predictive biomarkers of disulfiram activity
An intriguing observation was the association of killing by disulfiram (Antabuse), an inhibitor of acetaldehyde dehydrogenase used to treat alcohol dependence, and chromosome 16q copy number. Examination of the relevant region of 16q19 revealed that both copy number loss and low expression of the metallothionein-encoding genes MT1E and MT2A were correlated with disulfiram-induced cell killing (Pearson correlations of 0.33 and 0.23, respectively, across 560 lines) (Fig. 6a). Disulfiram has been previously suggested as an anti-cancer agent20, and at least one clinical trial has shown hints of efficacy in lung cancer when used in combination with chemotherapy21. In the absence of a predictive biomarker, the magnitude of clinical benefit did not warrant further clinical investigation.
Fig. 6. Anti-cancer activity of disulfiram and vanadium.
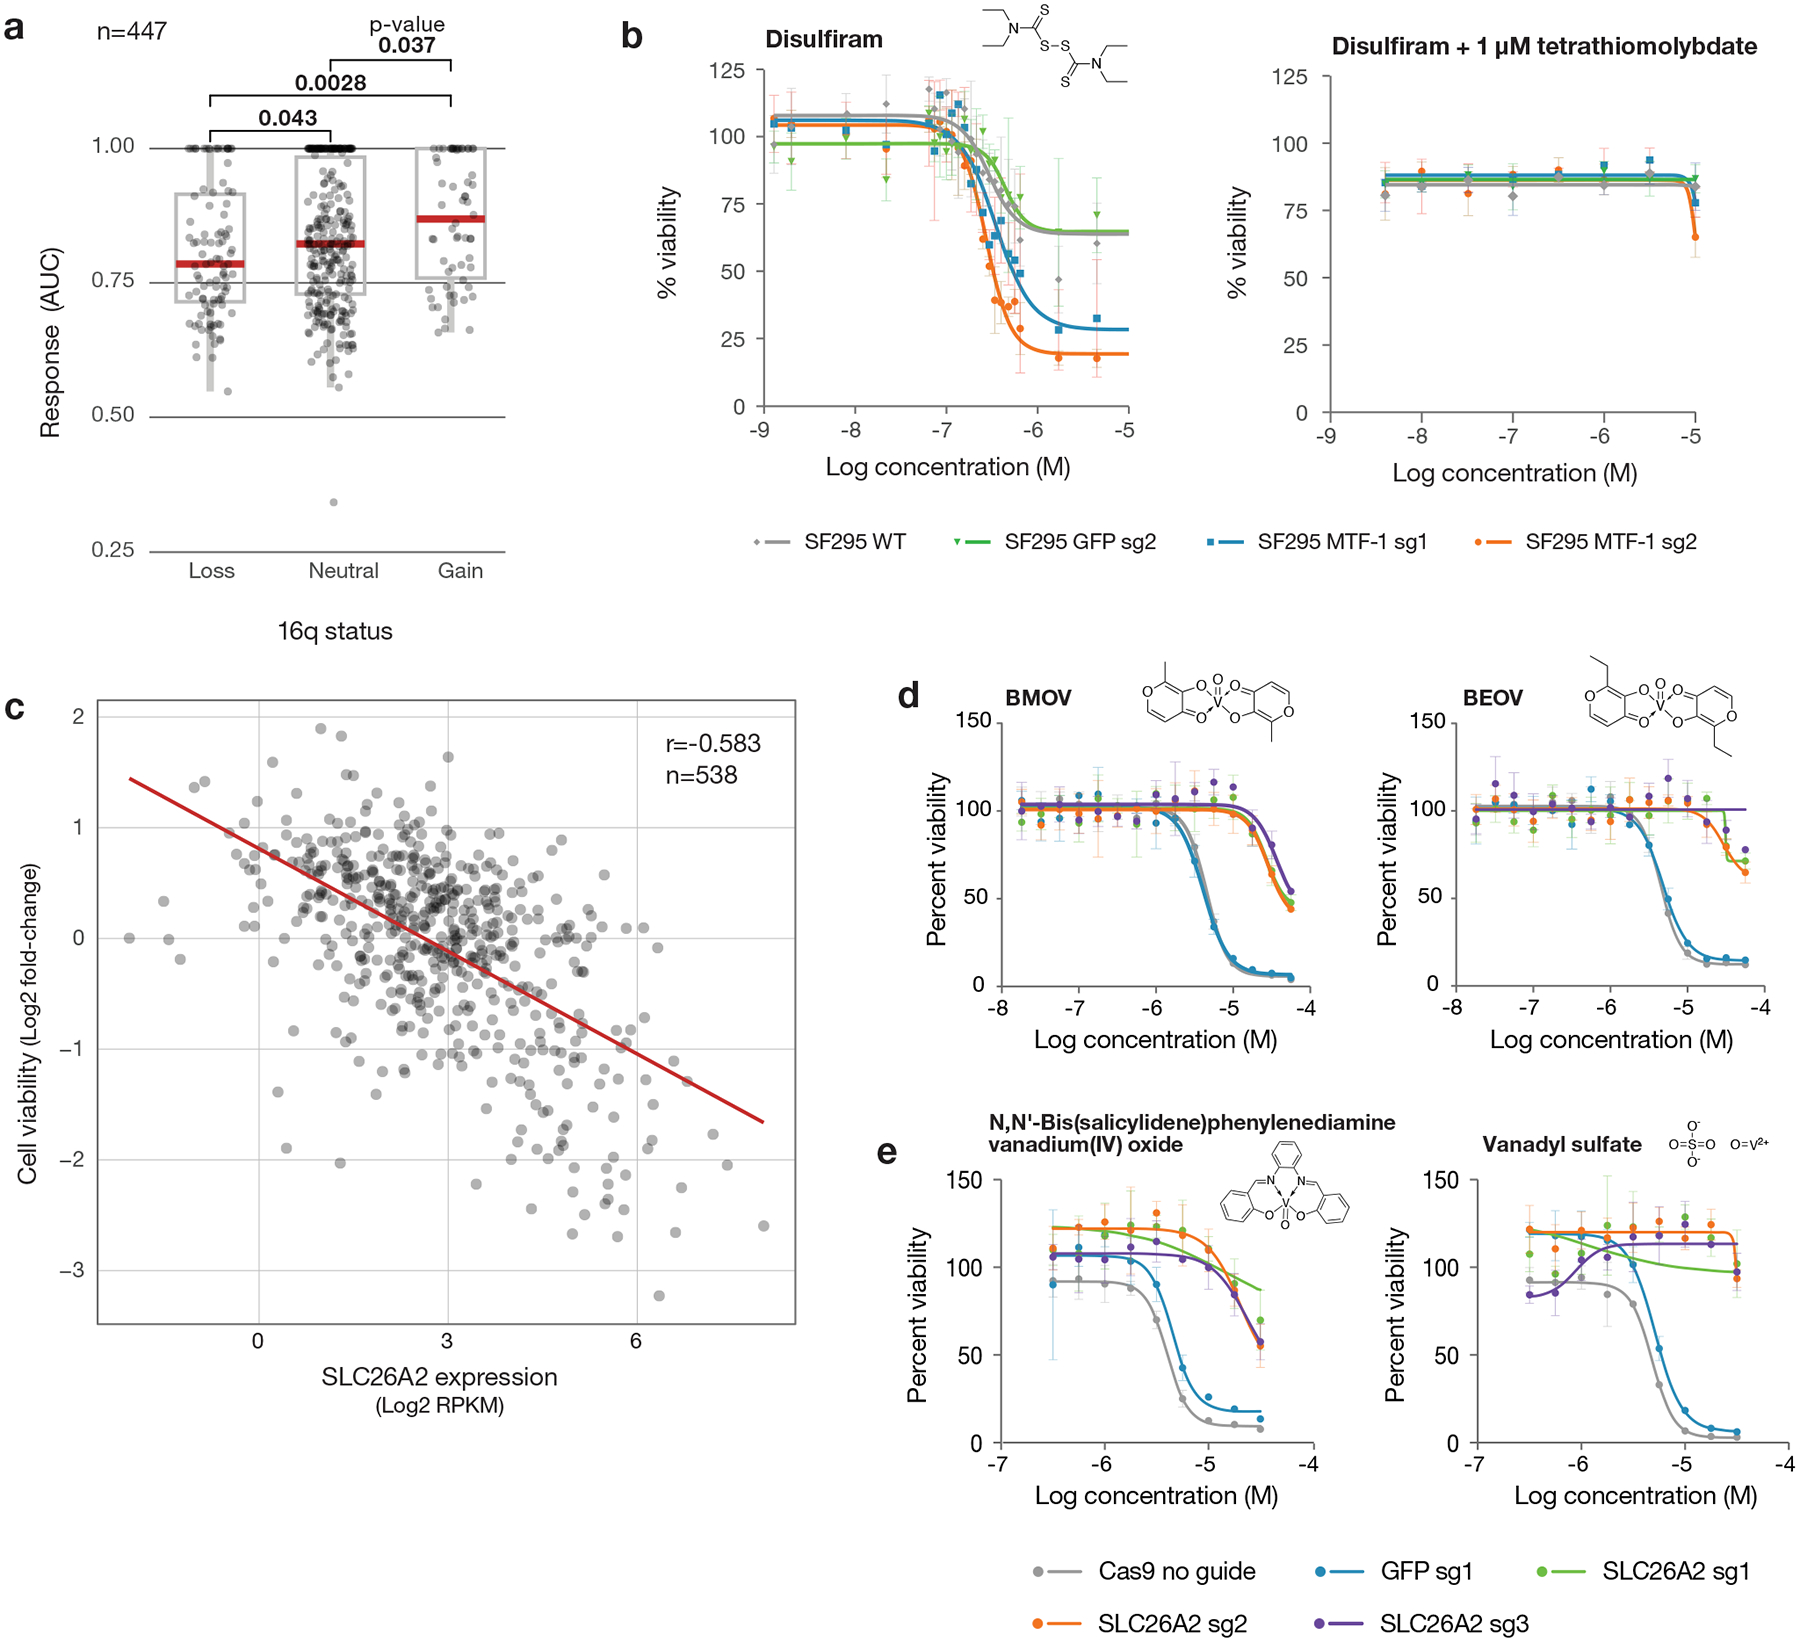
a, Disulfiram sensitivity of PRISM cell lines grouped by 16q copy number status (n= 447 cell lines). PRISM secondary data are shown as AUCs. Arm-level copy number data was obtained using published TCGA methods and manually reviewed to ensure consistency with copy number at the 16q13 locus. Two-sided p-values were calculated using Wilcoxon signed-rank tests between each pair of groups. Upper box limits, center lines, and lower box limits correspond to 75th, 50th, and 25th percentiles, respectively. Whiskers extend from the box limits to the most extreme value up to 1.5 IQR from the median. All cell lines are depicted as points, regardless of outlier status. b, MTF1 loss sensitizes to disulfiram. Drug sensitivity of SF295 cells with and without MTF1 knockout, with sgRNA against GFP included as a non-targeting control. Co-treatment with 1 μM TTM is included. Mean viability across three independently treated wells is shown, with standard deviation indicated by error bars. c, Scatter plot of BMOV sensitivity versus SLC26A2 gene expression (n = 538 cell lines). Correlation between PRISM viability data at 2.5 μM and SLC26A2 gene expression from CCLE RNAseq (log2 RPKM). Pearson’s r is shown. d, SLC26A2 knockout confers resistance. Dose-response curves for BMOV and BEOV in OVISE cells with and without CRISPR/Cas9-mediated knockout of SLC26A2. sgRNA against GFP was included as a non-targeting control. Mean viability across three independently treated wells is shown with standard deviation indicated by error bars. e, Dose-response curves for related vanadium-containing compounds, N,N’-Bis(salicylidene)-o-phenylenediamine vanadium(IV) oxide and vanadyl sulfate, in OVISE cells with and without SLC26A2 knockout. Mean viability across three independently treated wells is shown, with standard deviation indicated by error bars.
Our finding that the metallothionein-encoding genes MT1E and MT2A on 16q are predictive of disulfiram activity is mechanistically plausible: disulfiram’s activity is copper-dependent, and MT1E and MT2A are known metal-chelating proteins22. Consistent with this observation, MT1E and MT2A expression was also correlated with sensitivity to thiram and elesclomol, other copper-binding compounds23,24. In addition, disulfiram has been reported to induce metallothionein gene expression in prostate cancer cells25.
To test the hypothesis that metallothionein expression regulates disulfiram’s anti-cancer activity, we utilized the disulfiram-resistant glioma cell line SF295, which has an amplification of chromosome 16q and high metallothionein expression. In order to inhibit the expression of multiple metallothionein genes simultaneously, we knocked out the transcription factor MTF1, which is a known upstream regulator of metallothionein gene expression (Extended Data Fig. 7a)22. Following MTF1 knockout, metallothionein genes were among the most downregulated as assessed by global mRNA-seq (Extended Data Fig. 7b). As predicted, MTF1 knockout resulted in increased sensitivity of SF295 cells to disulfiram, and this increased sensitivity could be completely reversed by the copper chelator tetrathiomolybdate (TTM) (Fig. 6b). MTF1 knockout did not alter sensitivity to control bortezomib (Extended Data Fig. 7c). These results together suggest that 16q deletion is a potential predictive biomarker of disulfiram and other copper-dependent cytotoxic agents. This finding is particularly clinically relevant because arm-level 16q loss is seen in many tumor types, most notably breast and ovarian cancer, where its prevalence is estimated at 55–65% and 55–76%, respectively26–28.
Vanadium-containing compounds
The PRISM screen revealed a strong correlation between killing by the vanadium-containing drug bis(maltolato)oxovanadium(IV) (BMOV) and expression of the sulfate transporter SLC26A2 (Pearson correlation −0.583, ATLANTIS Pearson score 0.620) (Fig. 6c). Bioavailable vanadium-containing compounds, including BMOV and bis(ethylmaltolato)oxovanadium(IV) (BEOV), have been of interest for their ability to lower fasting blood glucose in animal models and in patients with diabetes29,30. SLC26A2 function has not been extensively studied, but loss-of-function mutations have been associated with connective tissue disorders31,32. In cancer, SLC26A2 is broadly expressed at modest levels, with high expression in melanoma and uterine cancers33.
The mechanistic relationship between BMOV and SLC26A2 expression is not obvious. Arguing against BMOV being an inhibitor of SLC26A2 function, analysis of publicly available genome-wide CRISPR/Cas-9 loss-of-function screens indicates that SLC26A2 is not a cancer dependency (see https://depmap.org). Consistent with this, knockout of SLC26A2 in the BMOV-sensitive cell line OVISE was tolerated (Extended Data Fig. 7d–e). However, SLC26A2 knockout rendered OVISE cells resistant to both BMOV and BEOV, indicating that SLC26A2 is not simply a biomarker of killing, but is required for compound activity (Fig. 6d). The cytotoxicity of other, structurally-distinct vanadium-containing compounds was similarly rescued by SLC26A2 knockout, suggesting that the vanadium oxide ion is responsible for the SLC26A2-dependent cytotoxicity of BMOV (Fig. 6e). It remains to be determined whether these compounds are substrates for the SLC26A2 transporter, interfere with sulfate ion homeostasis, or confer some neo-function to SLC26A2.
Tepoxalin and multi-drug resistance
Expression of metabolic enzymes or drug efflux pumps were among the most common predictive biomarkers of drug response in the PRISM screen. As expected, high mRNA expression of the ABCB1 transporter (encoding ABCB1, also known as MDR1 or p-glycoprotein) was the top predictor of resistance to numerous oncology drugs including taxanes (docetaxel and paclitaxel), vinca alkaloids (vincristine and vinorelbine), and proteasome inhibitors (carfilzomib) (Fig. 7a).
Fig 7. Tepoxalin is active against ABCB1-high cancer cell lines via an ABCB1-mediated mechanism.
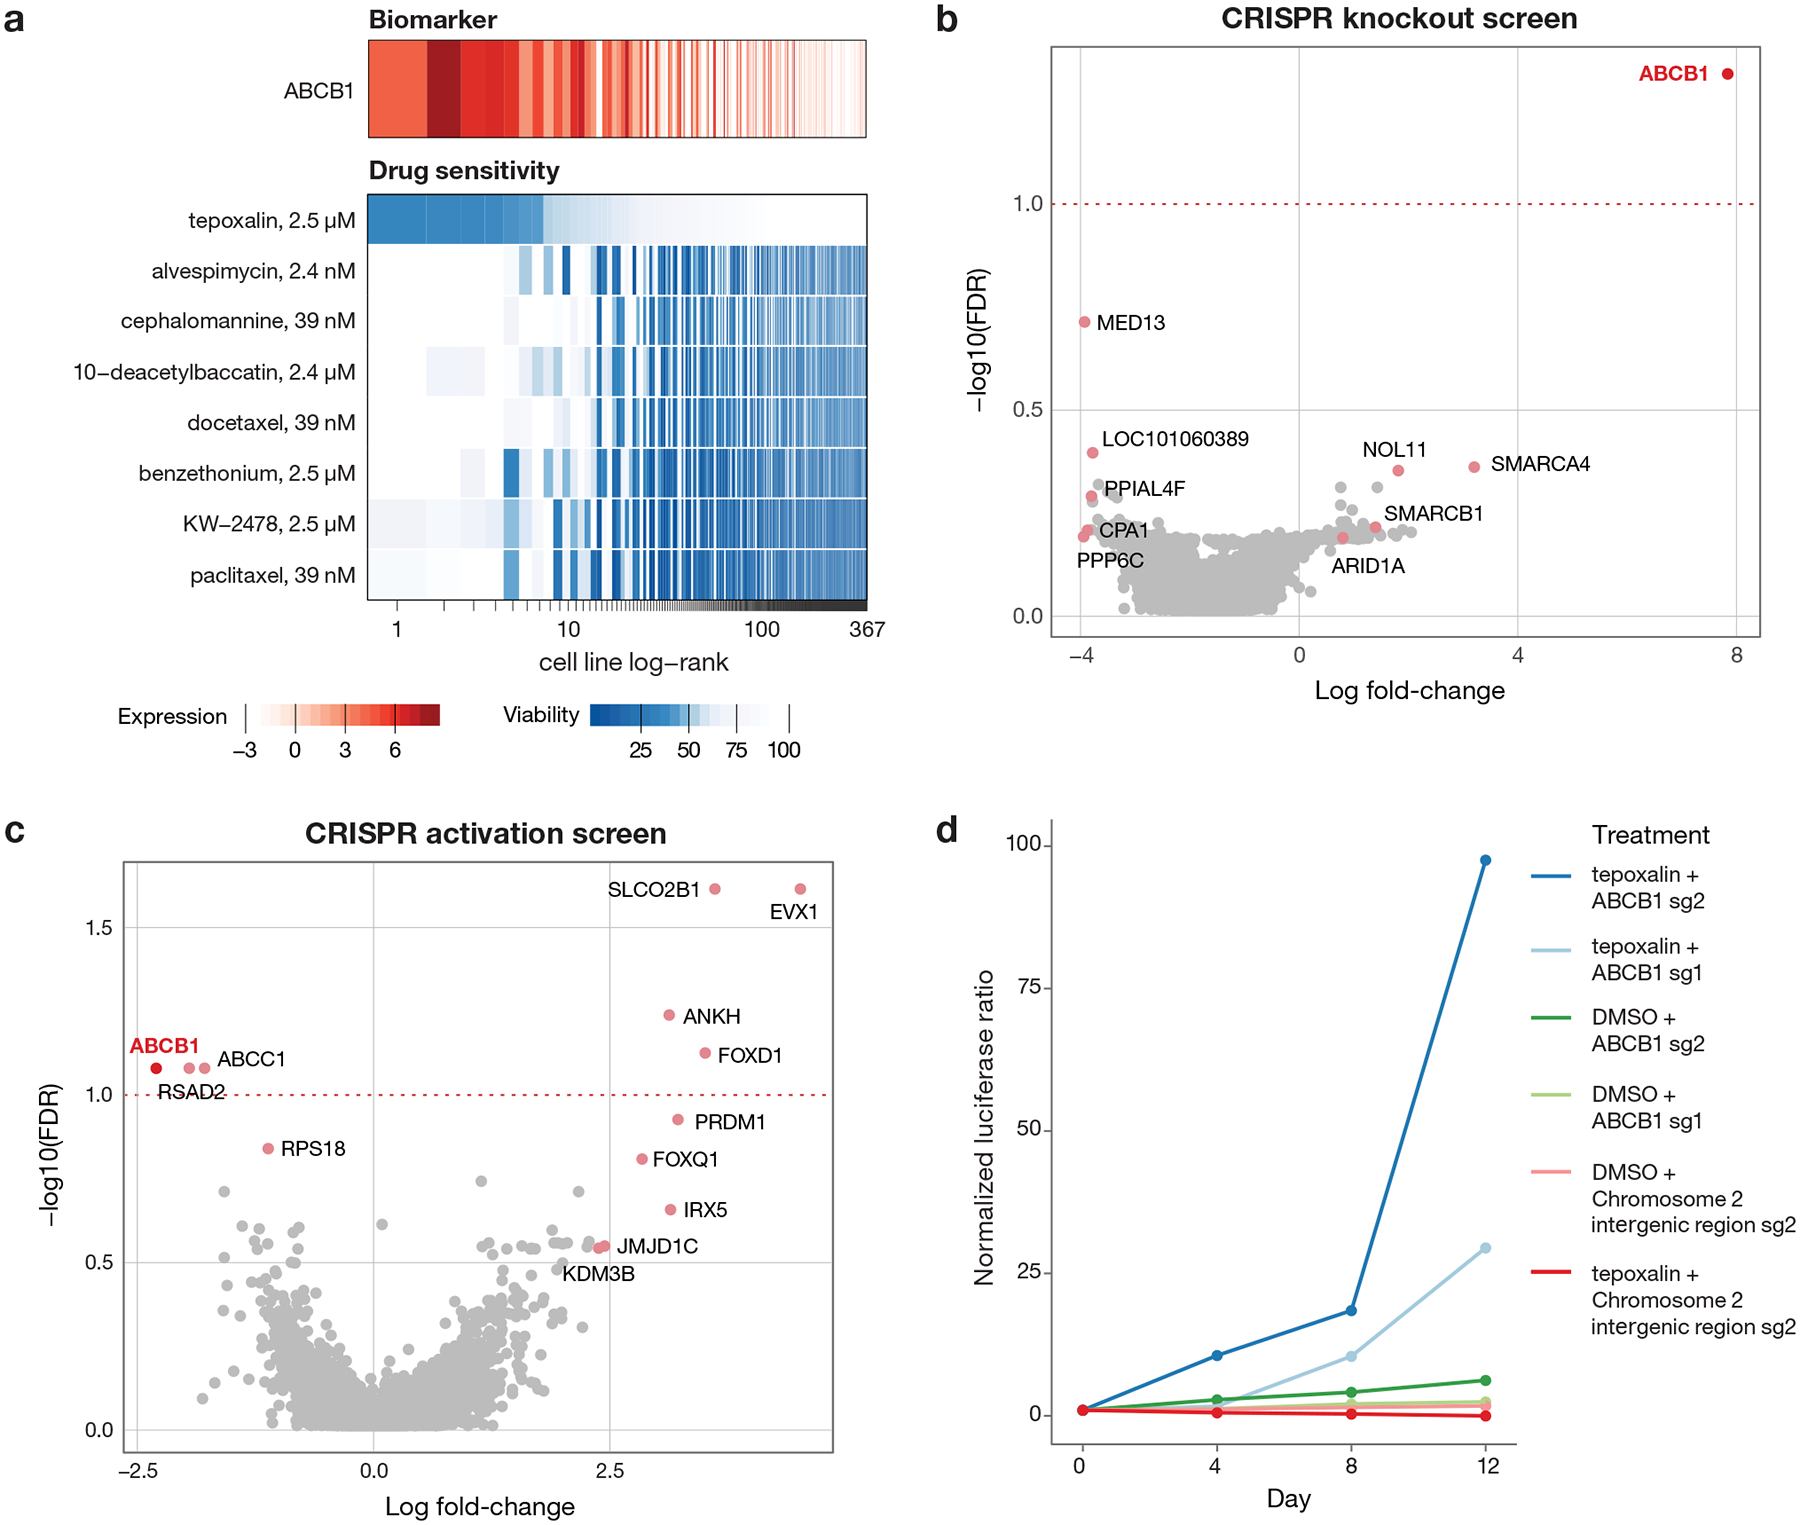
a, Drug sensitivity profiles of tepoxalin and seven additional compounds where ABCB1 RNA expression was the top predictive genomic feature of the PRISM activity profile (n = 489 cell lines). Tepoxalin was the only compound tested where high ABCB1 expression was associated with sensitivity rather than resistance to tepoxalin. Cell line viability is depicted with ABCB1 gene expression from CCLE RNAseq log2 RPKM data. Cell lines are ranked by mean viability with a ceiling at 100%. b, ABCB1 knockout is the top hit that rescues tepoxalin activity in a genome-wide CRISPR/Cas9 gene knockout screen. LS1034-Cas9 cells (pXPR_311) were infected with the Brunello sgRNA library, selected with puromycin, and treated with 16 μM tepoxalin versus vehicle control with two replicates in independent flasks. Cells were passaged every 3–4 days over a 30-day period. Two-sided p-values are computed using MAGeCK-MLE and shown versus gene-level log fold-changes. c, ABCB1 overexpression sensitizes to tepoxalin activity in a genome-wide CRISPR/dCas9 gene activation screen. LS1034-dCas9 cells (pXPR_109) were infected with the Calabrese sgRNA library, selected with puromycin, and treated with 16 μM tepoxalin versus vehicle control with two replicates in independent flasks. Cells were passaged every 3–4 days over a 14-day period. Two-sided p-values are computed using MAGeCK-MLE and shown versus gene-level log fold-changes. d, Tepoxalin cellular competition assay following ABCB1 knockout. LS1034-Cas9 cells (pXPR_311) were stably infected with Firefly luciferase and parental LS1034 cells (without Cas9) were stably infected with Renilla luciferase. Cells were mixed in 1:1 ratio an infected with the indicated sgRNA construct against ABCB1 or an intergenic region on chromosome 2 (negative control). Following puromycin selection, cell mixtures were treated with 16 μM tepoxalin. Firefly to Renilla luminescence ratio is plotted as log fold-change over time. Mean of three technical replicates is shown and results are representative of three independent experiments.
An unexpected finding, however, was that a single drug, tepoxalin, had the opposite relationship to ABCB1: high ABCB1 expression predicted sensitivity to tepoxalin. Tepoxalin is a dual cyclooxygenase and 5-lipoxygenase inhibitor that is FDA-approved for the treatment of osteoarthritis in dogs34,35. Because more than 100 other cyclooxygenase and/or 5-lipoxygenase inhibitors were also tested in our PRISM screen, we asked whether they shared the ABCB1-associated killing effect. Strikingly, none of them did— suggesting that tepoxalin’s killing was most likely explained by an off-target mechanism. Consistent with this hypothesis, tepoxalin’s killing activity was not correlated with genetic knockout profiles of its known targets PTGS1, PTGS2, and ALOX5.
To gain insight into the mechanism by which tepoxalin selectively inhibits cancer cells, we performed a genome-wide CRISPR/Cas9 modifier screen to identify genes required for tepoxalin-mediated activity. LS1034 colorectal cancer cells have high levels of ABCB1 expression and are inhibited by tepoxalin with an IC50 of 3.8 μM. Cas9-expressing LS1034 cells were infected with a pooled library containing 76,441 sgRNAs targeting 19,114 genes and treated with 16 μM tepoxalin (or vehicle control) for 28 days. Remarkably, the gene knockout most enriched in tepoxalin-resistant cells was ABCB1 itself (Fig. 7b). Other resistance hits included multiple components of the SWI/SNF complex (SMARCA4, SMARCB1, and ARID1A), which has been previously implicated in the regulation of ABCB1 gene expression36.
To complement the CRISPR-Cas9 loss-of-function screen, we performed a genome-wide CRISPR activation (CRISPRa) screen to identify genes whose overexpression was selected against in the setting of tepoxalin treatment. The gene showing the most negative selection was also ABCB1, indicating that its overexpression sensitizes cells to tepoxalin (Fig. 7c). Consistent with these findings, cellular competition and dose-response assays revealed strong selection for tepoxalin-treated ABCB1-null cells compared to wild-type cells (Fig. 7d, Extended Data Fig. 7f–h, Supplementary Table 8). Overexpression of ABCB1 in a low-expressing, tepoxalin-insensitive cell line resulted in increased drug sensitivity (Extended Data Fig. 8a–b). Furthermore, potent ABCB1 small molecule inhibitors did not phenocopy tepoxalin in the PRISM assay and in fact antagonized tepoxalin-induced killing, suggesting that ABCB1 inhibition alone does not explain tepoxalin’s anti-cancer activity (Extended Data Fig. 8c–d).
Given that ABCB1 encodes a drug transporter, we next asked whether ABCB1 expression affected intracellular concentrations of tepoxalin. Liquid chromatography-mass spectrometry (LC-MS) experiments indicated, however, that intracellular concentrations of tepoxalin were unaffected by levels of ABCB1 expression or by ABCB1 small-molecule inhibition (Extended Data Fig. 8e). Tepoxalin is also known to be metabolized to a compound known as RWJ20142 by conversion of its hydroxamic acid to a carboxylic acid37. RWJ20142 is generated in the presence of serum but not saline or acetonitrile (Extended Data Fig. 8f). Unlike tepoxalin, RWJ20142 was not cell-permeable and showed no inhibition of ABCB1-expressing cancer cells. Although tepoxalin did inhibit ABCB1 at high concentrations (Extended Data Fig. 8g–h), our results indicate that tepoxalin does not kill cancer cells simply by inhibiting ABCB1 activity. Taken together, these results suggest that tepoxalin, but not its metabolite RWJ20142, inhibits ABCB1 high-expressing cancer cells via an ABCB1-mediated mechanism that remains to be fully elucidated.
Data availability and analytical tools
The PRISM Repurposing dataset, including screening data and all metadata, is available at the Cancer Dependency Map portal at https://depmap.org/repurposing.
DISCUSSION
We developed the PRISM Repurposing dataset as a large-scale resource containing the anti-cancer activity of non-oncology drugs. The PRISM screen recovered 49 non-oncology compounds with selective and predictive biomarker-associated anti-cancer activity (Pearson score > 0.2, bimodality coefficient > 0.4) and 103 with a less stringent bimodality coefficient cutoff of > 0.35. Of note, 6 non-oncology compounds (Fig. 4) showed selective (bimodal) killing patterns, but their activity was found to be unpredictable based on the baseline genomic features of the cell lines. It is possible that an expansion of the number of cell lines in the PRISM panel will help to identify such biomarkers. Alternatively, killing might be explained by molecular features not yet measured in the cell lines.
It is conceivable that some non-oncology drugs could be brought directly to clinical trials for testing in cancer patients. However, before doing so, it will be important to establish that the killing activity of such drugs is observed at concentrations that are achievable and tolerable in humans. Similarly, it will be important to confirm that the predictive biomarkers identified in cell lines represent distinct populations of human tumors in vivo. It is likely that most of the observations described here will not be suitable for immediate testing in humans; either the biomarker hypothesis will require further refinement, or the compounds themselves will require further optimization.
In contrast to immediate repositioning of existing drugs for new indications, the PRISM results reported here also represent starting points for new drug development. In particular, when the anti-cancer activity of a drug occurs via an off-target mechanism, it is likely that further optimization for this new target will result in more potent and selective drug candidates. We note that the use of cell-based screens such as PRISM allows for the discovery of novel mechanisms of action that would be difficult to discover using conventional biochemical screening assays.
We initiated follow-up studies on 4 of the initial findings from the PRISM screen. In the case of disulfiram, we discovered a previously unrecognized biomarker (16q deletion) that predicts sensitivity. Future work will require extending such studies to the in vivo setting, and determining whether sufficiently high disulfiram concentrations can be achieved to obtain anti-cancer effects. The accessibility of copper in different organs and cell types will likely also modulate disulfiram’s anti-cancer activity. Compounds with remarkable chemical diversity kill PDE3A high-expressing cancer cell lines. They all induced PDE3A-SLFN12 complex formation, as has been described for the compound DNMDP18. A structural understanding of the interaction of these diverse compounds with PDE3A is likely to inform future optimization of PDE3A-SLFN12-directed cancer therapeutics. Our finding that vanadium-containing compounds selectively kill cancer cells expressing high levels of the sulfate transporter SLC26A2 was also surprising, given that a mechanistic link between the two had not been previously suspected. A recent study showed that SLC26A2 expression is a mechanism of resistance to TRAIL-induced cell death38; it remains to be determined whether that mechanism is relevant to vanadium-induced killing, and whether these compounds dysregulate sulfate homeostasis. Perhaps most interesting was our observation that the drug tepoxalin has the unique ability to inhibit cells that express high levels of the multi-drug resistance gene ABCB1. While tepoxalin was originally developed as a cyclooxygenase/5-lipoxygenase inhibitor, our structure-activity relationship studies clearly showed that tepoxalin’s anti-cancer activity is likely cyclooxygenase and 5-lipoxygenase independent. While we showed that ABCB1 is both necessary and sufficient to confer tepoxalin cytotoxicity, the precise mechanism by which such cell death occurs remains to be established. Further optimization of tepoxalin against this new target, and engineering out the drug’s cyclooxygenase/5-lipoxygenase inhibitory activity would likely result in improved tolerability as an anti-cancer agent.
Historically, a challenge with cell-based phenotypic screens is the difficulty in gaining molecular insight into hit compounds’ mechanism of action. Our results in the present study, however, demonstrate the power of genome-scale CRISPR/Cas-9 loss-of-function and gain-of-function screens to provide mechanistic clues to small-molecule action. For example, both CRISPR knockout and CRISPR activation screens pointed to ABCB1 as the most relevant target of tepoxalin. The availability of such functional genomic screening methods will likely reinvigorate cell-based screening more broadly. We also note that, whereas small molecules are typically thought of as inhibitors of their protein targets, our PRISM results indicate that this is often not the case. For example, we discovered compounds that stabilize protein-protein interaction (e.g., PDE3A-SLFN12) and that engage ABCB1 but do not kill cells by ABCB1 inhibition. It is likely that a plethora of non-inhibitory small molecule activities remains to be discovered from this PRISM dataset. We note, however, that when anti-cancer drug targets are not themselves cancer dependencies, it is possible that strong selective pressure will result in down-regulation of the target protein, resulting in drug resistance. Such drug resistance could presumably be overcome through combination drug treatment, as is the norm for most types of cancer.
The PRISM barcoding and pooling approach described here substantially increases screening efficiency, but it is conceivable that the pooling of cell lines results in paracrine-mediated mechanisms that modulate drug sensitivity. In practice, however, we have yet to observe such cell-cell interactions or any consistent discordance between PRISM and one-by-one viability profiling. Nevertheless, we and others have reported the existence of microenvironment-mediated drug resistance mechanisms39; the potential for such interactions should be considered when interpreting PRISM results.
The PRISM Repurposing dataset described here represents nearly half of all drugs ever tested in humans. Given the large number of unexpected findings that emerged from this initial screen, we believe that expansion of the PRISM resource in both the dimension of drugs and cancer models is warranted. Such data will provide an important pharmacological component of the Cancer Dependency Map (https://depmap.org), which in turn will form a pre-clinical foundation for cancer precision medicine.
METHODS
Cell lines
Parental cell lines were obtained from the Broad-Novartis Cancer Cell Line Encyclopedia (CCLE) project10 prior to PRISM barcoding (see https://portals.broadinstitute.org/ccle for original sources). For follow-up studies, LS1034, HeLa, and HEK293T cells were purchased from the American Type Culture Collection. REC1, SF295, OVISE, COLO320, BEN, HT29 and SNU449 were provided by CCLE. Wildtype and ABCB1 overexpressing (pLX_317 vector) Kuramochi cell lines were gifts from Elizabeth Stover40. HeLa PDE3A CRISPR KO cells (PDE3A−/− cells) were previously described18. LS1034, SF295, A2058, COLO320, SNU449, and OVISE cell lines derived with Cas9 were provided by the Broad Cancer Dependency Map. STR fingerprinting was performed by Genetica using the PowerPlex® 16 HS system (Promega). STR profiles were compared with STR profiles reported by vendors and in literature. Misidentified cell lines or other STR conflicts are listed in Supplementary Table 9. These cell lines are flagged in the data files and are not shown by default in the website interface. Cell lines were confirmed to be negative for mycoplasma using the MycoScope™ PCR Mycoplasma Detection Kit (Genlantis). LS1034, REC1, OVISE, SF295, COLO320, SNU449, and Kuramochi cell lines were cultured in RPMI (Thermo). A2058 and Hela cell lines were cultured using DMEM (Thermo). All media was supplemented with 10% heat-inactivated serum FBS (Sigma) and 1% penicillin-streptomycin G (Thermo) with the exception of HEK293, which was maintained without antibiotics.
PRISM screening
We made several improvements to the previously described PRISM barcoding method4. The assay employs a 24-nucleotide barcode stably introduced into cancer cell lines via lentiviral transduction. The barcode is located at the end of the blasticidin resistance gene and is expressed as an mRNA under the highly active PGK promoter. We adapted the mRNA capture and Luminex detection method developed for the L1000 gene expression assay41 to detect PRISM barcodes in order to improve throughput. In addition to using an mRNA-based readout, assay improvements include pooling cell lines according to doubling time similarity, collapsing lysate plates together prior to detection, and the addition of a spike-in barcode control for amplification and detection.
The detailed PRISM assay protocol is available online at https://depmap.org/repurposing. Briefly, barcoded cell lines were pooled (25 cell lines per pool) based on doubling time and frozen into assay-ready vials. Vials were thawed, and one pool was immediately plated per 384 well assay plate at 1,250 cells/well in triplicate. Cells were either treated the following morning with compounds by pin transfer (Repurposing primary and secondary HTS screens) or plated directly onto assay-ready plates containing compounds (used for follow-up in the lower scale MTS004 and MTS006 screens). After a five-day incubation, cells were lysed. Lysate plates containing one pool of 25 cell lines each were then further pooled together to yield one (in the secondary screen) or two (in the primary screen) final detection pools for amplification and barcode measurement. For the secondary screen, a set of ten unique barcodes were spiked-in to each well prior to PCR to control for variation in PCR amplification and Luminex detection following lysate pooling.
Data processing
Luminex median fluorescence intensity (MFI) values were calculated as the median fluorescence values of all beads corresponding to a single PRISM barcode in a single technical replicate. MFI values were log2-transformed (logMFI) and subjected to two quality control steps. First, an “outlier-pool filter” was applied to remove probable screening artifacts (Extended Data Fig. 2). In each assay plate, logMFI values were median centered per cell line, and each well was summarized by the median of these centered MFI values. Wells more than 5 median absolute deviations (MAD) from the median across all wells from the same compound plate and plate location were removed. Second, a “control separation filter” was applied. For each plate, cell lines with Strictly Standardized Mean Difference (SSMD)42 values less than 2 were excluded from the rest of the analysis (Extended Data Fig. 3). SSMD values were calculated as:
Where μ−/+ and σ−/+ stand for the medians and the MADs of logMFI values computed over the negative/positive control wells for each cell line on each plate. The number of PRISM profile cell line replicates passing QC is shown in Extended Data Fig. 4.
1,448 compounds were selected for secondary 8-point dose-response testing based on reproducibility, predictability, selectivity, and compound availability (Supplementary Table 2). For the secondary screen only, ten unique barcodes were spiked into each well of each plate after cell lysis. Normalized MFI (nMFI) values were computed by taking the ratio of each logMFI value to the median logMFI of the inert barcodes in each well. For data produced before the spike-in protocol was introduced, nMFI values were set equal to MFI values.
Fold-change values were calculated as the ratio of nMFI to the median of the nMFI from the DMSO-treated negative controls for each cell line on each plate. Batch effects produced from variable detection and assay conditions were then removed using ComBat43. ComBat was run over each treatment condition separately by considering the log2-transformed fold-change values as probes and pool-replicate combinations as batches. Corrected-log fold change values were then median-collapsed for each cell line, screen, source plate, and well combination. We label cell lines as sensitive to a treatment if the median-collapsed fold-change is less than 0.3.
Dose-response analysis
Dose-response relationships were obtained by fitting 4-parameter logistic curves to viability values for each compound and cell line using the R package “drc”. Following the practice of Smirnov and Safikhani44, the upper asymptote of the logistic curves is fixed at 1, and the viability values are fit as a function of drug concentration according to:
where all concentrations are in the natural logarithm scale. IC50 values were defined as the concentration c at which V(c) = 0.5. Additionally, the area under the dose-response curve (AUC) was calculated using the normalized integral:
The formulation above puts AUC values on a scale between 0 and 1 for curves with lower asymptotes less than 1, where lower AUC values indicate increased sensitivity to the treatment.
Biomarker discovery
To generate predictive biomarkers, we adopted ATLANTIS predictive models9 and trained multiple models for each PRISM profile. ATLANTIS is a tailored non-linear regression model for gene dependency prediction based on the baseline characteristics of cancer cell lines. More specifically, ATLANTIS is an efficient implementation of a conditional inference forest45 with additional weighting and iterative feature selection steps. Implementation details have been previously published9 and the code is available on a public repository (https://github.com/cancerdatasci/atlantis).
For each dose-wise log fold-change profile, 14 ATLANTIS models are trained (one model per feature set). Feature sets include baseline cell line omics, genetic dependencies, and experimental confounders. All feature sets are listed in Supplementary Table 10.
Next, the predictive performance of each model is assessed based on the Pearson correlation between out-of-bag model predictions and the response variable. Models with Pearson correlations greater than 0.2 are considered to be strong models. The relative importance of each feature (“mean decrease in accuracy”) is computed by ATLANTIS for each model. The most important feature of each strong predictive model is presented as a potential predictive biomarker or strongly associated phenotype. The comprehensive list of biomarkers is available at https://depmap.org/repurposing.
Compound killing selectivity
To assess for selective killing activity, the bimodality coefficient8 for each median-collapsed log-fold change PRISM profile was computed for each compound as follows:
where n is the number of samples (cell lines), g is the sample skewness and k is the sample excess kurtosis. Note that larger bimodality coefficient implies a highly skewed (large magnitude of g) but light-tailed (small kurtosis) distribution.
Computation of AUC values for cross-dataset comparison
Secondary PRISM Repurposing data was compared to CTD2 (Version 2.0, December 15, 2015) and GDSC available through the PharmacoGX package17,44. For the PRISM Repurposing and GDSC datasets, dose-response curves were fitted as described above. CTD2 provides dose-response curve parameters and curves were not refitted. The scope of the comparison was limited to compounds screened in all three datasets with a minimum overlapping four-fold dose range across the datasets. Dose-response curves were computed for each compound-cell line-dataset combination using all available doses. AUC values were calculated over the shared dose range (curves were not refitted). The complete table of the published/recomputed dose-response parameters and AUC values are given in Supplementary Table 11.
Assessment of noise in the PRISM repurposing dataset
The standard error of the inferred log fold-change viability values was calculated to estimate the amount of noise in the PRISM screen. We assumed that (spike-in) normalized logMFI values have a cell line specific additive noise with a constant variance σ2 across treatments. A standard error propagation analysis (see section 9.3 of46), gives
Where nrep is the number of replicates (3 for PRISM Repurposing), ncontrol is the number of negative control wells in a given plate (32 in the standard PRISM assay format), and σlog fold−change is the standard-error estimate. σ was estimated separately for each cell line and plate using normalized negative-control log2 MFI values. σ estimates for the same cell line were median-collapsed and used to calculate σlog fold−change. This procedure was applied separately to each PRISM Repurposing screen. In MTS006, DMSO-only plates were used.
Projection of viability profiles to two dimensions
Log-viability profiles from the primary screen were embedded into a two-dimensional manifold using the Uniform Manifold Approximation and Projection (UMAP)7 algorithm and visualized in Figure 2A. Cell lines that were missing more than 10% of their viability values (failed in QC steps) were removed, and the remaining missing values were imputed using the FastImputation R package47. UMAP was applied on the resulting data, using the cosine distance metric and the following configuration parameters: 7 nearest neighbors, 0.5 minimum distance, 2 components, and 200 training epochs. The remainder of the parameters were set to the defaults provided by the UMAP R package. For the visualization, we filtered out compounds with an average Pearson replicate correlation between below 0.25. In addition, MOAs that include fewer than 20 compounds are shown in translucent grey.
Comparison to genetic loss-of-function screens
Linear models were fit to test the association between primary collapsed log fold-change profiles of each drug and DepMap Avana CRISPR knockout gene effect scores using the lmFit function from the limma R package with default parameters48. P-values were corrected within each dose-profile for multiple hypotheses using the Benjamini-Hochberg method. For primary data, a single profile was selected to test for each drug. The procedure was repeated for secondary collapsed log fold-change profiles. A single dose series was selected for each drug.
Compounds for confirmatory studies
Paclitaxel (S1150), tyrphostin AG 1296 (S8024), anagrelide (S3172), levonorgestrel (S1727), Deoxycorticosterone acetate (S4243), drospirenone (S1377), and norethindrone (S4040) were purchased from Selleck Chemicals. Dofequidar (SML0938–5MG), N,N′-Bis(salicylidene)-o-phenylenediamine vanadium(IV) oxide complex (68541), and vanadium(IV) oxide sulfate hydrate (233706) were purchased from Sigma-Aldrich. Tepoxalin (T103205) was purchased from Toronto Research Chemicals and WuXi AppTec (custom synthesis). DCEBIO (1422) and Zardaverine (1046) were purchased from Tocris. Disulfiram (HY-B0240), Bortezomib (HY-10227), and Tanaproget (HY-15606) were purchased from MedChemExpress. BMOV (FB18735) was purchased from Carbosynth. Tetrathiomolybdate (AC389530010) was purchased from Thermo Fisher Scientific. Danazol (1500220) was purchased from Microsource. Gestrinone (Prestw-1267) was purchased from Prestwick.
Synthesis of RWJ20142
Reactions were monitored by thin layer chromatography (TLC) with 0.25 mm E. Merck pre-coated silica gel plates (60 F254) and Waters Alliance HT LCMS system (Waters 2998 UV/Visible Detector, Waters Acquity SQD Mass, Waters e2795 Sample Manager) using Waters Cortecs C18 column (3 × 30 mm, 2.7 μm particle size). Additional parameters: solvent gradient = 97% A at 0min, 5% A at 1.75min, 97% A at 2.28 min, total 2.60 min; solvent A = water (MilliQ) + 0.01% formic acid (Sigma); solvent B = acetonitrile (EMD) + 0.01% formic acid (Sigma); flow rate: 1.75 mL/min. Purification of reaction products was carried out by flash chromatography using CombiFlash®Rf with Teledyne Isco RediSep®Rf High Performance Gold or Silicycle SiliaSep™ High Performance columns (4 g, 12 g, 24 g, 40 g, 80 g or 120 g. 1H NMR and 13C NMR spectra were obtained using a Bruker 400 Ascend. Chemical shifts are reported relative to chloroform (δ = 7.24) for 1H NMR.
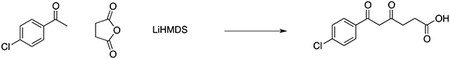
In a 100 ml oven-dried flask, a solution of LiHMDS (10 ml, 10 mmol, 1.0M in THF) was added dropwise to a solution of 1-(4-chlorophenyl)ethanone (1.10 g, 7.14 mmol) in dry THF (20 ml) at −78°C under argon atmosphere. After 1 hour, a solution of dihydrofuran-2,5-dione (0.86 g, 8.52 mmol) in dry THF (10 ml) was added at −78°C, stirred for 30 minutes, then warmed up to room temperature. After 2 hours, the reacting mixture was quenched with water, acidified with 1N HCl (pH2), then extracted with DCM (3×10 ml). The combined organic layers were dried over Na2SO4, filtered, and concentrated. The residue was purified by column chromatography on silica gel (10 to 50% AcOEt in hexanes) to afford 6-(4-chlorophenyl)-4,6-dioxohexanoic acid (550 mg, 31% yield). LCMS: MS(ESINeg) m/z = 253 [M-H]−.
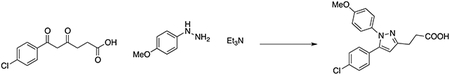
In a 50 ml flask, a solution of (4-methoxyphenyl)hydrazine hydrochloride (0.37 g, 2.12 mmol), 6-(4-chlorophenyl)-4,6-dioxohexanoic acid (0.49 g, 1.93 mmol) and triethylamine (0.31 ml, 2.31 mmol) in MeOH (30 ml) was stirred overnight at room temperature. The reaction was quenched with 5% HCl aqueous solution (pH2), then extracted with DCM (3×10 ml). The combined organic layers were dried over Na2SO4, filtered, and concentrated. The residue was purified by column chromatography on silica gel (20 to 60% AcOEt in hexanes) to afford 3-(5-(4-chlorophenyl)-1-(4-methoxyphenyl)-1H-pyrazol-3-yl)propanoic acid (285 mg, 42% yield). LCMS: MS(ESINeg) m/z = 355 [M-H]−. 1H NMR (400 MHz, Chloroform-d) δ 10.25 (brs, 1H), 7.27 (d, J = 8.5 Hz, 2H), 7.20–7.12 (m, 4H), 6.87 (d, J = 8.9 Hz, 2H), 6.35 (s, 1H), 3.82 (s, 3H), 3.07 (t, J = 7.5 Hz, 2H), 2.83 (t, J = 7.5 Hz, 2H). Compound purity of >97% was quantified by LC-MS.
Synthesis of bis(ethylmaltolato)oxovanadium(IV) (BEOV)
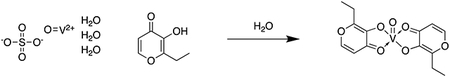
Vanadyl sulfate trihydrate (25 g, 115 mmol), dissolved in 25 mL water, was added to ethylmaltol (43.4 g, 310mmol) dissolved in 125 mL hot water under argon, and the resulting solution was heated gently with stirring for 30 min. The pH was adjusted very slowly to 8.5 by addition of NaOH (12.7 g, 319 mmol) in 10 mL water. The resulting mixture was then refluxed for 2 hours, and then allowed to cool to room temperature. The dark blue-grey solid was collected by vacuum filtration, washed with cold water, and dried in vacuo to produce BEOV with yield of 88%. The compound was 93% pure by LC-MS.
Cloning
pXPR_003 and pXPR_023 vectors were acquired from the Broad Genetic Perturbation Platform (GPP). Oligos for sgRNAs designs were generated using Broad GPP sgRNA guide generator resource
(https://portals.broadinstitute.org/gpp/public/analysis-tools/sgrna-design), and the respective oligos were synthesized by Integrated DNA Technologies. To clone the sgRNAs into either the pXPR_003 guide-only or pXPR_023 all-in-one CRISPR lentiviral expression systems, we followed the protocol available on the Broad GPP website (https://portals.broadinstitute.org/gpp/public/resources/protocols). CRISPR sgRNA sequences are shown in Supplementary Table 12.
Antibodies and western immunoblotting
The following antibodies were used: polyclonal rabbit anti-PDE3A from Bethyl Laboratory (A302–740A, 1:1000 dilution), monoclonal mouse anti-V5 from Life Technologies (R960–25, 1:5000 dilution), monoclonal rabbit anti-ABCB1 (D3H1Q) from Cell Signaling Technology (12683, 1:1000 dilution), monoclonal mouse anti-β-Actin (8H10D10) from Cell Signaling Technology (3700, 1:1000 dilution), and monoclonal rabbit anti-SLC26A2 Antibody (3F6) from Novus Biologicals (H00001836-M04, 1:1000 dilution). Cells were lysed with RIPA buffer (CHAPS buffer substituted for Extended Data Fig. 8a) supplemented by protease and phosphatase inhibitors (Sigma). For ABCB1 blots, proteins were transferred onto a nitrocellulose membrane utilizing a Mini Trans-Blot Electrophoretic Transfer Cell (Bio-Rad) in Tris-Glycine Buffer (Bio-Rad) with 10% methanol for 4 hours at 60V and 4°C. Membranes was blocked in Odyssey Blocking Buffer (LI-COR) for 1 hour, and probed overnight with primary antibodies. The following day, membranes were washed and probed with LI-COR IRDye secondary antibodies (926–68020 and 926–32211, each at 1:5000). For PDE3A and V5 blots, different LI-COR secondary antibodies were used (926–32210 and 926–68020, each at 1:10,000). Blot images were collected using the LI-COR Odyssey CLx imager.
Genomic DNA PCR and NGS to quantify CRISPR editing frequency
To confirm efficient CRISPR cutting at target loci, PCR primers were designed flanking the sgRNA cut site by 75–100 base pairs on either side. Human genomic DNA PCR primer sequences corresponding to the regions targeted by MDR1, SLC26A2, and MTF1 sgRNAs are shown in Supplementary Table 13. Genomic DNA was isolated from knockout cell lines using the Gentra Puregene Kit (QIAGEN) and amplified with the primers to yield an amplicon roughly 150–250 base pairs in length using Herculase II Fusion Polymerase (Agilent). The PCR protocol involved a 2-minute denaturation at 95C, followed by 24 cycles of 95°C for 2 minutes, 55°C for 2 min, and 72°C for 1 min. PCR samples were purified and submitted for the NGS CRISPR sequencing assay at the Massachusetts General Hospital DNA Core. Knockout efficiency was assessed by the percentage of reads containing a frameshift caused by an indel compared to the total read count. Results for each guide were averaged across primer sets with successful amplification.
Cellular viability assays
Cells were seeded at a density of 2000 cells per well (1,000 cells per well for HeLa) in a 96-well black, clear bottom plate (Corning). The following day, compounds were dispensed using the D300e Digital Dispenser (Tecan). Following incubation, viability was assessed by CellTiter-Glo® (Promega). Luminescence was measured using an Envision plate reader (PerkinElmer). Independent replicate wells were averaged and normalized to vehicle control. Dose curves were generated using GraphPad Prism.
PDE3A co-immunoprecipitation assay
PDE3A immunoprecipitation and western blotting of coprecipitated SLFN12-V5 protein experiments were performed as previously described18. Briefly, HeLa cells were plated onto 15 cm plates at 3×10⁶ cells per plate, and transfected the next day with 15 μg of pLX307-SLFN12 plasmid (clone ID: TRCN0000476272) using FuGene 6 at a 4:1 ratio. Roughly 72 hours post-transfection, cells were treated with 10 μM of the repurposing hit compounds or 1 μM of DNMDP or 1 μM anagrelide for 6 hours. Cells were collected and lysed with a modified RIPA buffer (150 mM NaCl, 10% glycerol, 50 mM Tris-Cl pH 8.0, 50 mM MgCl2 1% NP-40), supplemented protease and phosphatase inhibitors. Immunoprecipitation was performed using 2 mg of total protein lysates and 1 μg of anti-PDE3A antibody (Bethyl Laboratory A302–740A) at 4°C overnight, followed by incubation with 7.5 μL each of Protein A- and Protein G-Dynabeads (Life Technologies, 10001D and 10003D) at 4°C for 1 hour. Beads were washed with lysis buffer and proteins were eluted with 30 μl of LDS PAGE gel loading buffer.
PDE3A and PDE3B enzyme activity assays
A commercial fluorescence polarization assay was performed using recombinant PDE3A and PDE3B by BPS Bioscience. Compounds were tested in duplicate at 9 concentrations in a half-logarithmic dilution series (top concentration of 10 μM) with final DMSO concentration of 1%. The enzymatic reactions were conducted at room temperature for 60 minutes in a 50 μl mixture containing PDE assay buffer, 100 nM FAM-cAMP, a PDE enzyme and the test compound. After the enzymatic reaction, 100 μl of a binding solution (1:100 dilution of the binding agent with the binding agent diluent) was added to each mix, and the reaction was performed at room temperature for 15 minutes. Fluorescence intensity was measured at an excitation of 485 nm and an emission of 528 nm using a Tecan Infinite M1000 microplate reader. Fluorescence intensity was converted to fluorescence polarization using the Tecan Magellan 6 software.
Differential scanning fluorimetry (DSF/thermal shift) analysis of compound binding to PDE3A
The gene for PDE3A (residues 677–1141) was codon optimized for E. coli expression (GeneArt, Invitrogen) and cloned into an expression vector that attached an N-terminal polyhistidine sequence followed by a TEV protease cleavage site. The protein was expressed in E. coli, and purified by affinity and size exclusion chromatography. The polyhistidine sequence was removed by TEV protease. PDE3A (5 μM) was incubated for 20 minutes at room temperature with 100 μM of each compound. The reaction buffer was 20 mM HEPES pH 7.4, 150 mM NaCl, 500 μM TCEP, 5 mM MgCl2, and 1% DMSO. After incubation, SYPRO orange (Thermo Fisher) was added to give a final concentration of 10x relative to stock concentrate. Protein was tested using the Lightcycler 480 (Roche Life Science). The temperature was increased from 25°C to 95°C using a gradient of 0.06 ˚C/second.
LS1034 CRISPR-Cas9 genome-wide knockout screen
The Brunello genome-scale sgRNA library was obtained from the Broad Genetic Perturbation Platform (GPP)49. Virus was titrated to a goal infection efficiency of 0.3–0.6. LS1034-Cas9 cells were infected with Brunello virus in 12-well plates via centrifugation at 2000 rpm and 30°C. The following day, cells were split into two replicate flasks, and selected with 6 μg/mL puromycin for 7 days. After selection, replicates were seeded into 16 μM tepoxalin (Wuxi) or DMSO control. Cells were maintained at 37°C and 5% CO2 in CellSTACK 1272 cm2 2-STACK flasks (Corning) in RPMI with 10% FBS. Cells were reseeded every 7 days at a minimum of 40 million cells per passage (to maintain ~500x library representation). Media and drug were refreshed every 3–4 days for a total of 3 weeks. Genomic DNA was isolated from cell pellets using the NucleoSpin® Blood XL Columns (Macherey Nagel). Genomic DNA PCR and sequencing was performed by the Broad GPP.
LS1034 CRISPR-dCas9 genome-wide activation screen
LS1034 cells were stably transduced with pXPR_109 to express dCas9-VP6450. Selective induction of CD45 and CD4 expression using control guides was confirmed by flow cytometry. The Calabrese B genome-scale virus library was obtained from the Broad GPP. LS1034-dCas9-VP64 cells were infected via centrifugation as described above. The following day, cells were split into 2 replicates and re-seeded. The next day, 6 μg/mL of puromycin was added. After selection for 6 days, replicates were split into DMSO or 16 μM tepoxalin (Wuxi) drug arms in duplicate, and cultured for 2 weeks as described above. Genomic DNA was isolated and sequenced as described above.
CRISPR screen analysis
Guides targeting multiple genes or with <50 reads in the pDNA pool were filtered. Counts were normalized against total library size. Guide-level base 2 log fold-change was computed using the ratio between treatment versus vehicle control counts. Results from all guides targeting each gene were averaged. Statistical significance each gene level result was using the MAGeCK-MLE method, using the suggested number of permutation rounds (10)51. Two-sided p-values were corrected for multiple hypothesis testing using the Benjamini-Hochberg method.
Tepoxalin competition assay
LS1034-Cas9-Firefly luciferase cells were co-cultured in a 1:1 ratio with LS1034-Renilla luciferase cells, both infected with ABCB1 sgRNA or a cutting control sgRNA. Cells were treated with 16 μM tepoxalin (Wuxi) or vehicle. The co-culture was passaged every 4 days and re-seeded with drug. Luciferase activity was quantified using the Dual-Glo® Luciferase Assay (Promega) and measured using an Envision plate reader. Data points were collected at day 0 and every 4 days until 12 days of treatment. The Firefly to Renilla luminescence ratio was normalized to the initial Day 0 measurement.
Tepoxalin cell permeability and stability assays
Compounds were incubated in medium alone or with 1 million cells/mL at 37°C with gentle shaking for 3 hours. Following incubation, cell samples were centrifuged at 500 × g for 5 minutes and washed twice with cold PBS. Cells were resuspended in 130 μL water. Samples were sonicated and centrifuged at 3000 × g for 15 min at 20°C. 5 μL of supernatant was combined with 45 μL cell media, 50 μL water, and 50 μL acetonitrile containing internal standard. Samples were centrifuged again, and a final 100 μL aliquot was transferred to a 96-well plate for analysis. Samples were analyzed on a UPLC-MS/MS system consisting of a Waters Acquity I-Class FTN and AB Sciex 4500 Triple Quad mass spectrometer with compounds detected by positive mode MRM detection. Mobile phase A consisted of water with 0.1% formic acid (Honeywell, catalog 33015–1L), while mobile phase B consisted of acetonitrile with 0.1% formic acid. The gradient ran from 10–95% B over 0.8 minutes at a flow rate of 0.9 mL/minute. An Acquity BEH C18, 1.7 m, 2.1 × 50 mm column (Waters) was used with column temperature maintained at 65°C. Sample concentrations were determined using a standard curve and dilution quality-control samples prepared in a surrogate matrix. Analyst 1.6.2 software was used for integration and calculation determination. For stability study, 1 μM of tepoxalin was added to PBS, RPMI with 10% FBS, or acetonitrile in duplicate and measured by mass spectrometry with time points prepared at 0, 24, 48, and 72 hours. The mass spectrometer was run in positive mode using MRM detection for tepoxalin and the internal standard (75 nM midazolam).
Tepoxalin drug synergy/antagonism assays
Tepoxalin or paclitaxel were added in a dose response matrix to LS1034 or REC1 cells, and viability was assessed by CellTiter-Glo (Promega). For drug combination viability data, we first normalized CellTiter-Glo measurements by the median over DMSO wells on each plate. We then used the R package synergyfinder52 to estimate Bliss synergy scores across all dose combinations, applying synergyfinder’s default baseline correction method. Synergy values for each drug combination and cell line were summarized by the synergy score with highest magnitude across dose combinations (max synergy). We verified that qualitatively similar results were obtained using other synergy models (e.g., Loewe, HSA, and ZIP) and methods for aggregating synergy scores across dose combinations (e.g., averaging).
ABCB1 activity assays
ABCB1 antagonism assay was performed by Eurofins using published methods53. Briefly, MDR1-MDCK cells were incubated with test compounds and calcein AM. Change in calcein AM concentration was assessed by fluorescence measurement. A second assay, MDR1-MDCK cell permeability, was performed by Cyprotex. Briefly, loperamide, a known MDR1 substrate, was added to the apical side of a cell monolayer and transport to the basal side was quantified over 60 minutes. Inhibition of MDR1-mediated transport of loperamide was assessed by adding tepoxalin or positive control (verapamil).
Transcriptional profiling by RNA-seq
LS1034 cells were seeded in 12-well plates. The following day, cells were treated in triplicate with 12 μM tepoxalin or DMSO vehicle control for 6 hours. Wild-type SF295 cells and SF295 containing Cas9 and sgRNAs targeting GFP or MTF1 were plated in triplicate on a 6-well plate and incubated overnight. RNA was isolated using the RNeasy Mini Kit (QIAGEN) with DNase treatment. RNA quality was confirmed by Bioanalyzer (Agilent). Library preparation was performed by the Dana-Farber Molecular Biology Core Facility using the KAPA mRNA HyperPrep Kit (Roche). Nucleic acid was sequenced using an Illumina NextSeq 500 instrument (PE75). Gene level expression values were obtained from RNA sequencing using the TOPMed RNA-seq pipeline54. RSEM was used to generate transcripts per million (TPM) gene-level expression quantifications. These tools were run using the FireCloud and Terra platform55. Differential gene expression was calculated using the DESeq2 package56.
Statistics and reproducibility
No statistical method was used to determine sample sizes. Compounds were plated for screening without regard to compound identity, but experiments were not randomized. No data were excluded from the analysis, except individual data points flagged as assay failures by the process described above. Statistical tests are described in the text and figure legends with associated sample sizes. PRISM data was generated without the investigators’ knowledge of compound and cell line identities during screening. Investigators were not blind to compound and cell line identities during analysis. Further information on research design is available in the Nature Research Reporting Summary linked to this article.
Data availability
Raw and processed PRISM viability data are available from the Cancer Dependency Map portal (https://depmap.org/repurposing) and archived via Figshare (doi:10.6084/m9.figshare.9393293). An interactive version of Figure 2a and Figure 4 (with accompanying raw data) is also available on the Cancer Dependency Map portal; scatter plot source data is also deposited in Figshare (doi:10.6084/m9.figshare.9393293). The cell line features used for biomarker analysis are listed in Supplementary Table 10 and also archived via Figshare (doi:10.6084/m9.figshare.10277810). RNA sequencing data were deposited in the Gene Expression Omnibus (GEO, accession number GSE133299). All other data supporting the findings of this study are available from the corresponding author on reasonable request.
Code availability
Data analysis was performed in R version 3.5.1 using custom or publicly-available R packages. Individual packages are explicitly cited in the manuscript. The custom code is available upon request and from GitHub (https://github.com/broadinstitute/repurposing).
Extended Data
Extended Data Fig. 1. PRISM Repurposing assay and data processing overview.
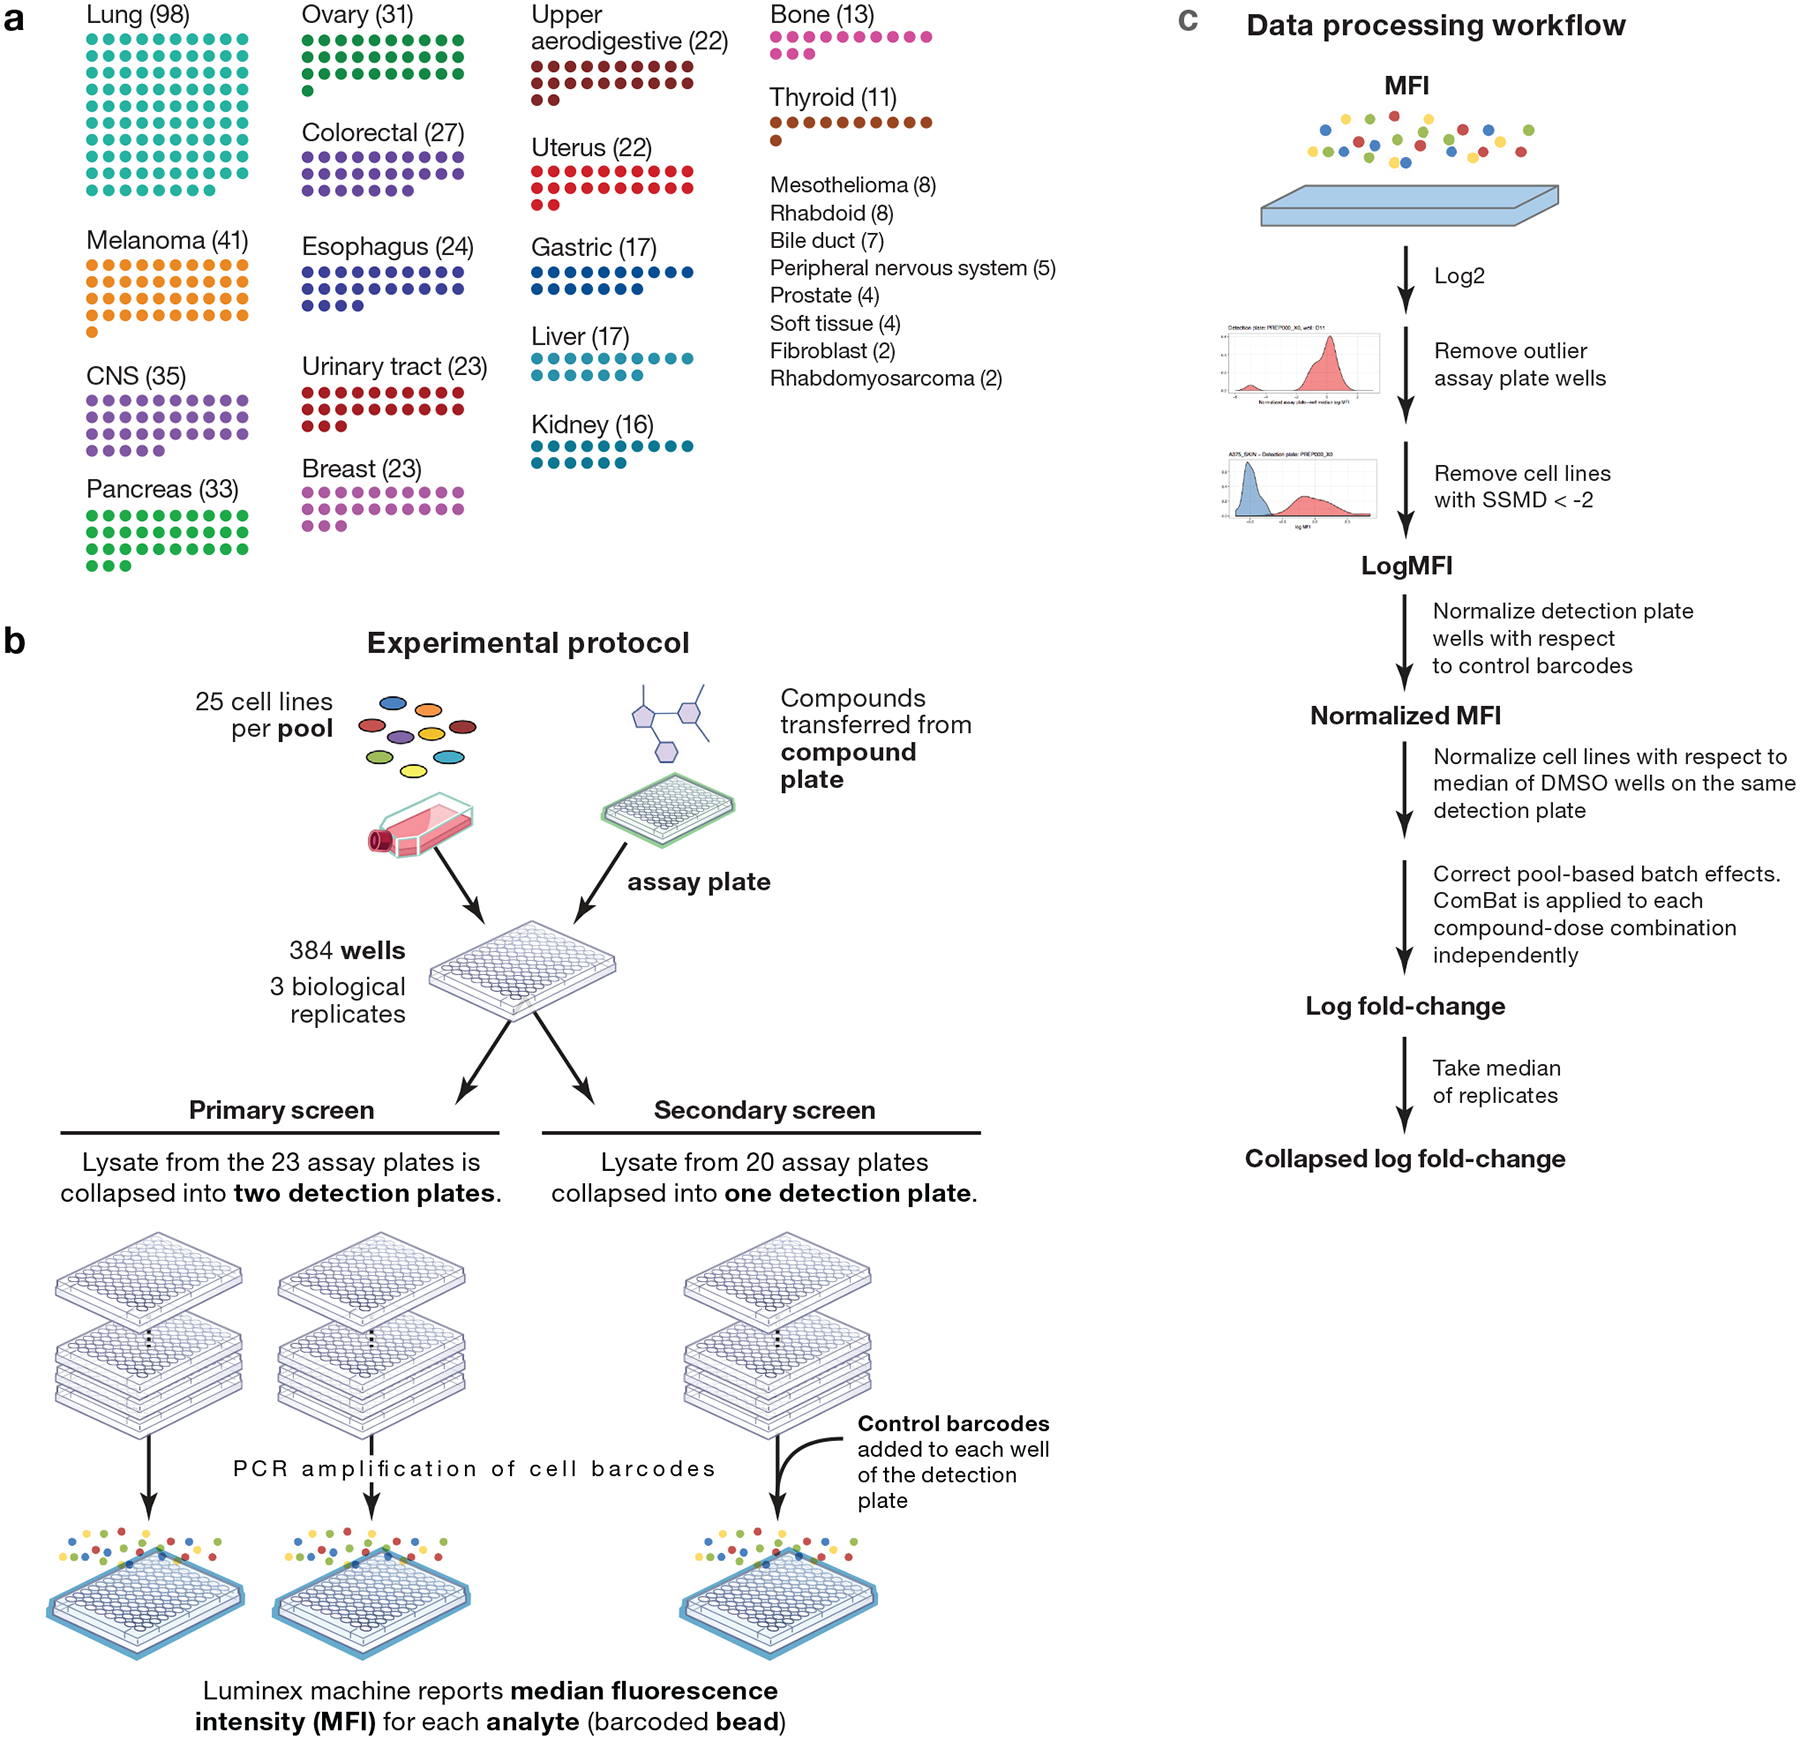
a, Lineage diversity of PRISM cell lines. The 489+ cancer cell lines tested span more than 23 tumor types. Lineages with fewer than 10 cell lines are listed on the right. b, Experimental protocol. Cell lines are grouped by doubling time into pools of approximately 25 cell lines. One pool is plated onto each assay plate. Compounds are transferred by pin transfer from a source compound plate (HTS and HTS002 screens), or cells are plated directly onto assay-ready plates generated by acoustic dispensing of compounds (MTS004, MTS005, and MTS006 screens). In either case, compound plates are shared by all replicates of each treatment condition. After incubation and lysis, all assay plates generated by a given compound plate are grouped and collapsed into 3 (HTS002, MTS005, and MTS006 screens) or 6 (HTS, MTS004 screens) detection plates so that each detection plate receives 1 or zero copies of each pool. Ten control barcodes are then spiked into each detection plate well (HTS002, MTS005, and MTS006 screens). Detection plates are amplified by PCR and detected using Luminex FLEXMAP 3D instruments. c, Data processing workflow. Median Fluorescence Intensity (MFI) values are calculated from fluorescence values for each replicate-condition-cell line combination and are log2-transformed. Assay plates wells are normalized, median-collapsed, and compared to the normalized medians of other assay plate wells in the same well position that have been dosed by the same compound plate. A robust z-score is calculated, and assay plate wells with a |z-score| > 5 are filtered. Strictly standardized mean differences (SSMD) are calculated between positive and negative control conditions for each cell line on each assay plate. Cell line-assay plate combinations with SSMD < 2 are filtered by a control-separation filter to generate the log MFI data matrix. In datasets with control barcodes added, data are normalized with respect to the median of control barcodes to generate the MFI normalized data matrix. Data are DMSO-normalized and pooling artifacts are corrected using ComBat to generate the log fold-change data matrix. Up to 3 independently treated plates (range 1–3 based QC filtering) in one screen are median-collapsed to generate the collapsed log fold-change data matrix.
Extended Data Fig. 2. Outlier pool QC filter to detect pool-level failures.
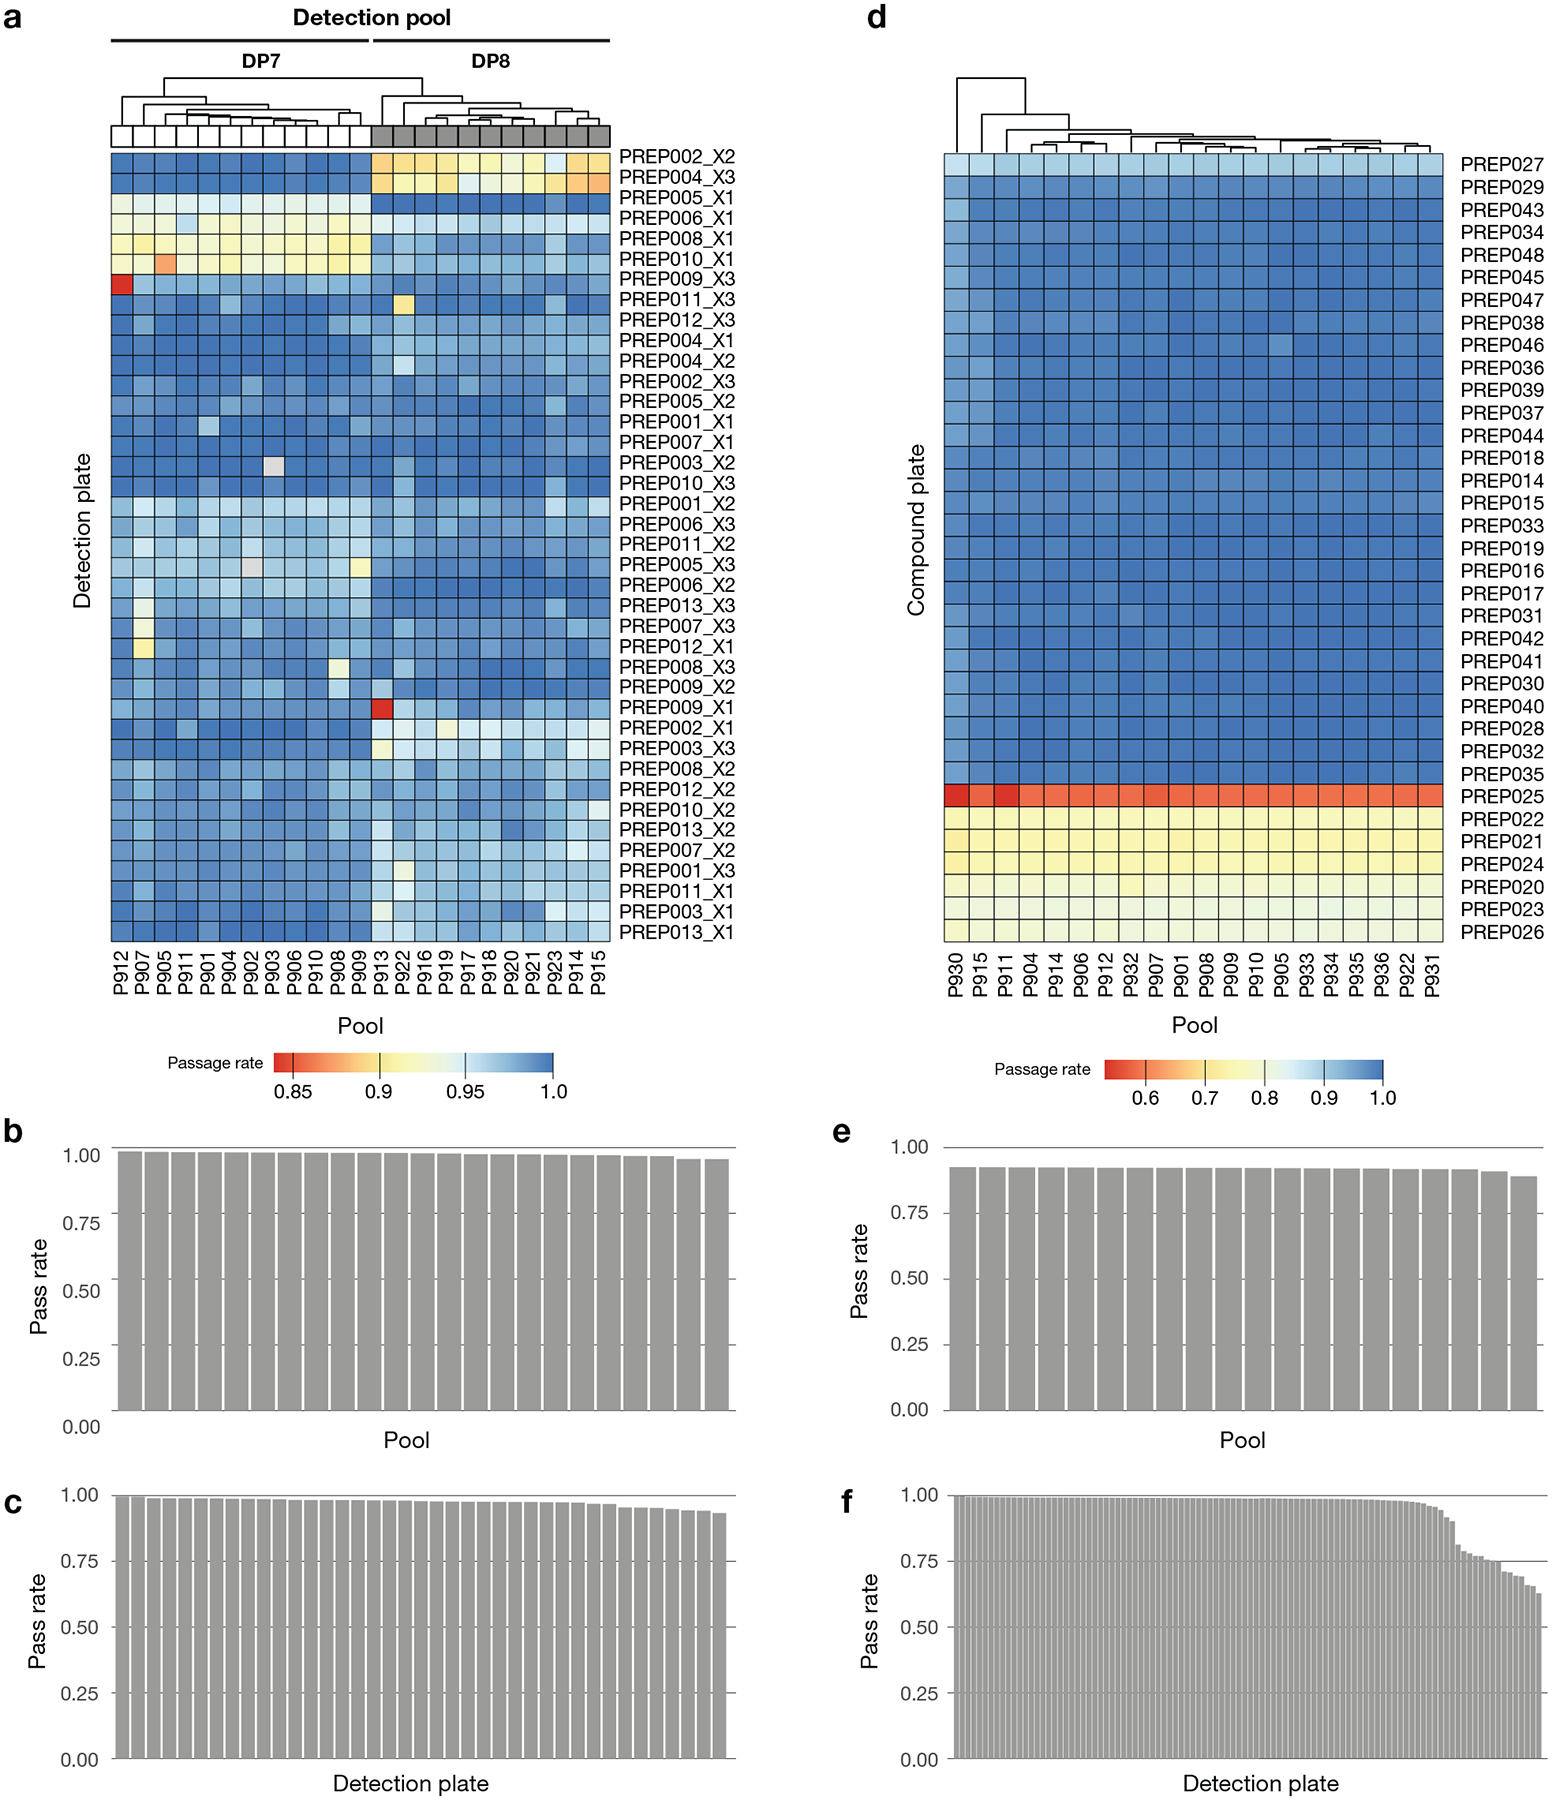
a, Primary screen QC pass rate by pool. The fraction of treated assay plate-wells that pass the outlier filter is indicated. Cell line log MFI data are median-centered, and the medians of assay plate-wells are compared within each well-detection plate combination. Extreme outliers with |robust z-score| > 5 are filtered. b, Primary screen QC pass rate by detection plate. c, Primary screen QC pass rate of assay plates. Overall pass rate was high (median 98.6%, minimum 83.8%). d, Secondary screen QC pass rate by pool. e, Secondary screen QC pass rate by detection plate. The pass rate is above 95% for 81% of detection plates. f, Secondary screen QC pass rate by plate-pool combinations. 3 replicate plates are combined for visualization. Overall pass rate was high (median 99.1%, mean 94.3%), where failures are almost exclusively coming from 7 detection plates, implying failure at final detection step. Across the screen, 5.7% of the pools are filtered out as outliers.
Extended Data Fig. 3. Control-separation QC filter to detect cell line failures.
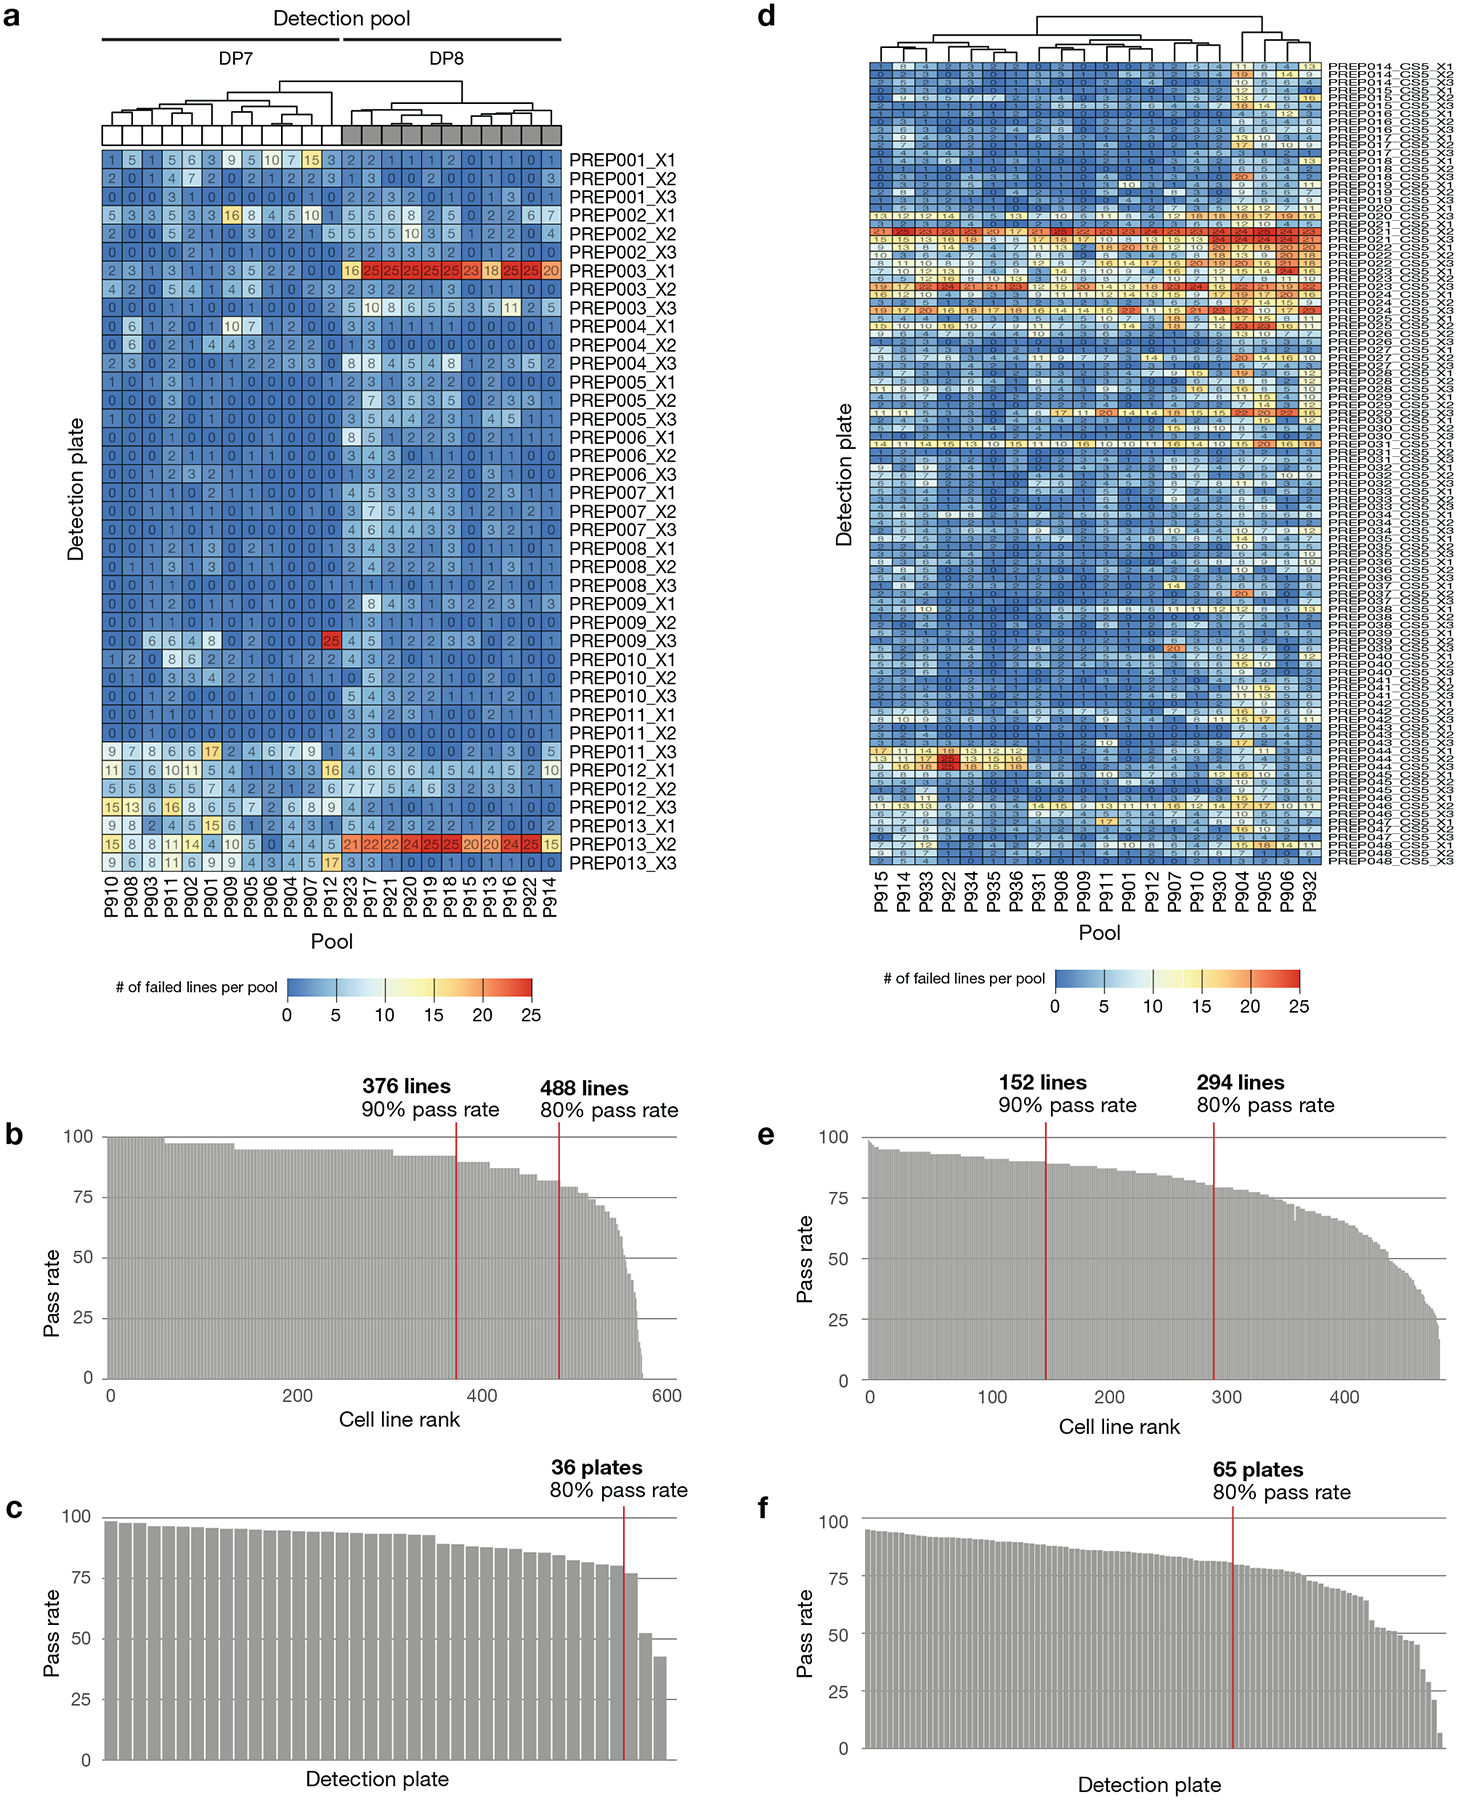
aa, Primary screen QC pass rate by cell line. SSMD of log MFI values is calculated between positive control and negative control treatments for each cell line on each plate. Data from cell line-plates with SSMD < 2 are filtered. b, Primary screen QC pass rate by detection plate. c, Primary screen QC pass rate of assay plates. Overall pass rate was high (median 99.2%, mean 94.3%). Some detection plates show higher failure rates for specific detection pools, implying failure at final detection step. The bulk of the filtered data was from two detection plate-detection pools (PREP013_X2 and PREP003_X1 in detection pool 8). d, Secondary screen QC pass rate by cell line. SSMD of log MFI values is calculated between positive control and negative control treatments for each cell line on each assay plate. Data from cell line-plates with SSMD < 2 are filtered. e, Secondary screen QC pass rate by detection plate. f, Secondary screen QC pass rate of assay plates. Overall pass rate was lower than primary (median 99.88%, mean 79.1%). Similar to the primary screen, the main mode of failure is platewise failures.
Extended Data Fig. 4. Number of well replicates passing QC in the PRISM screens.
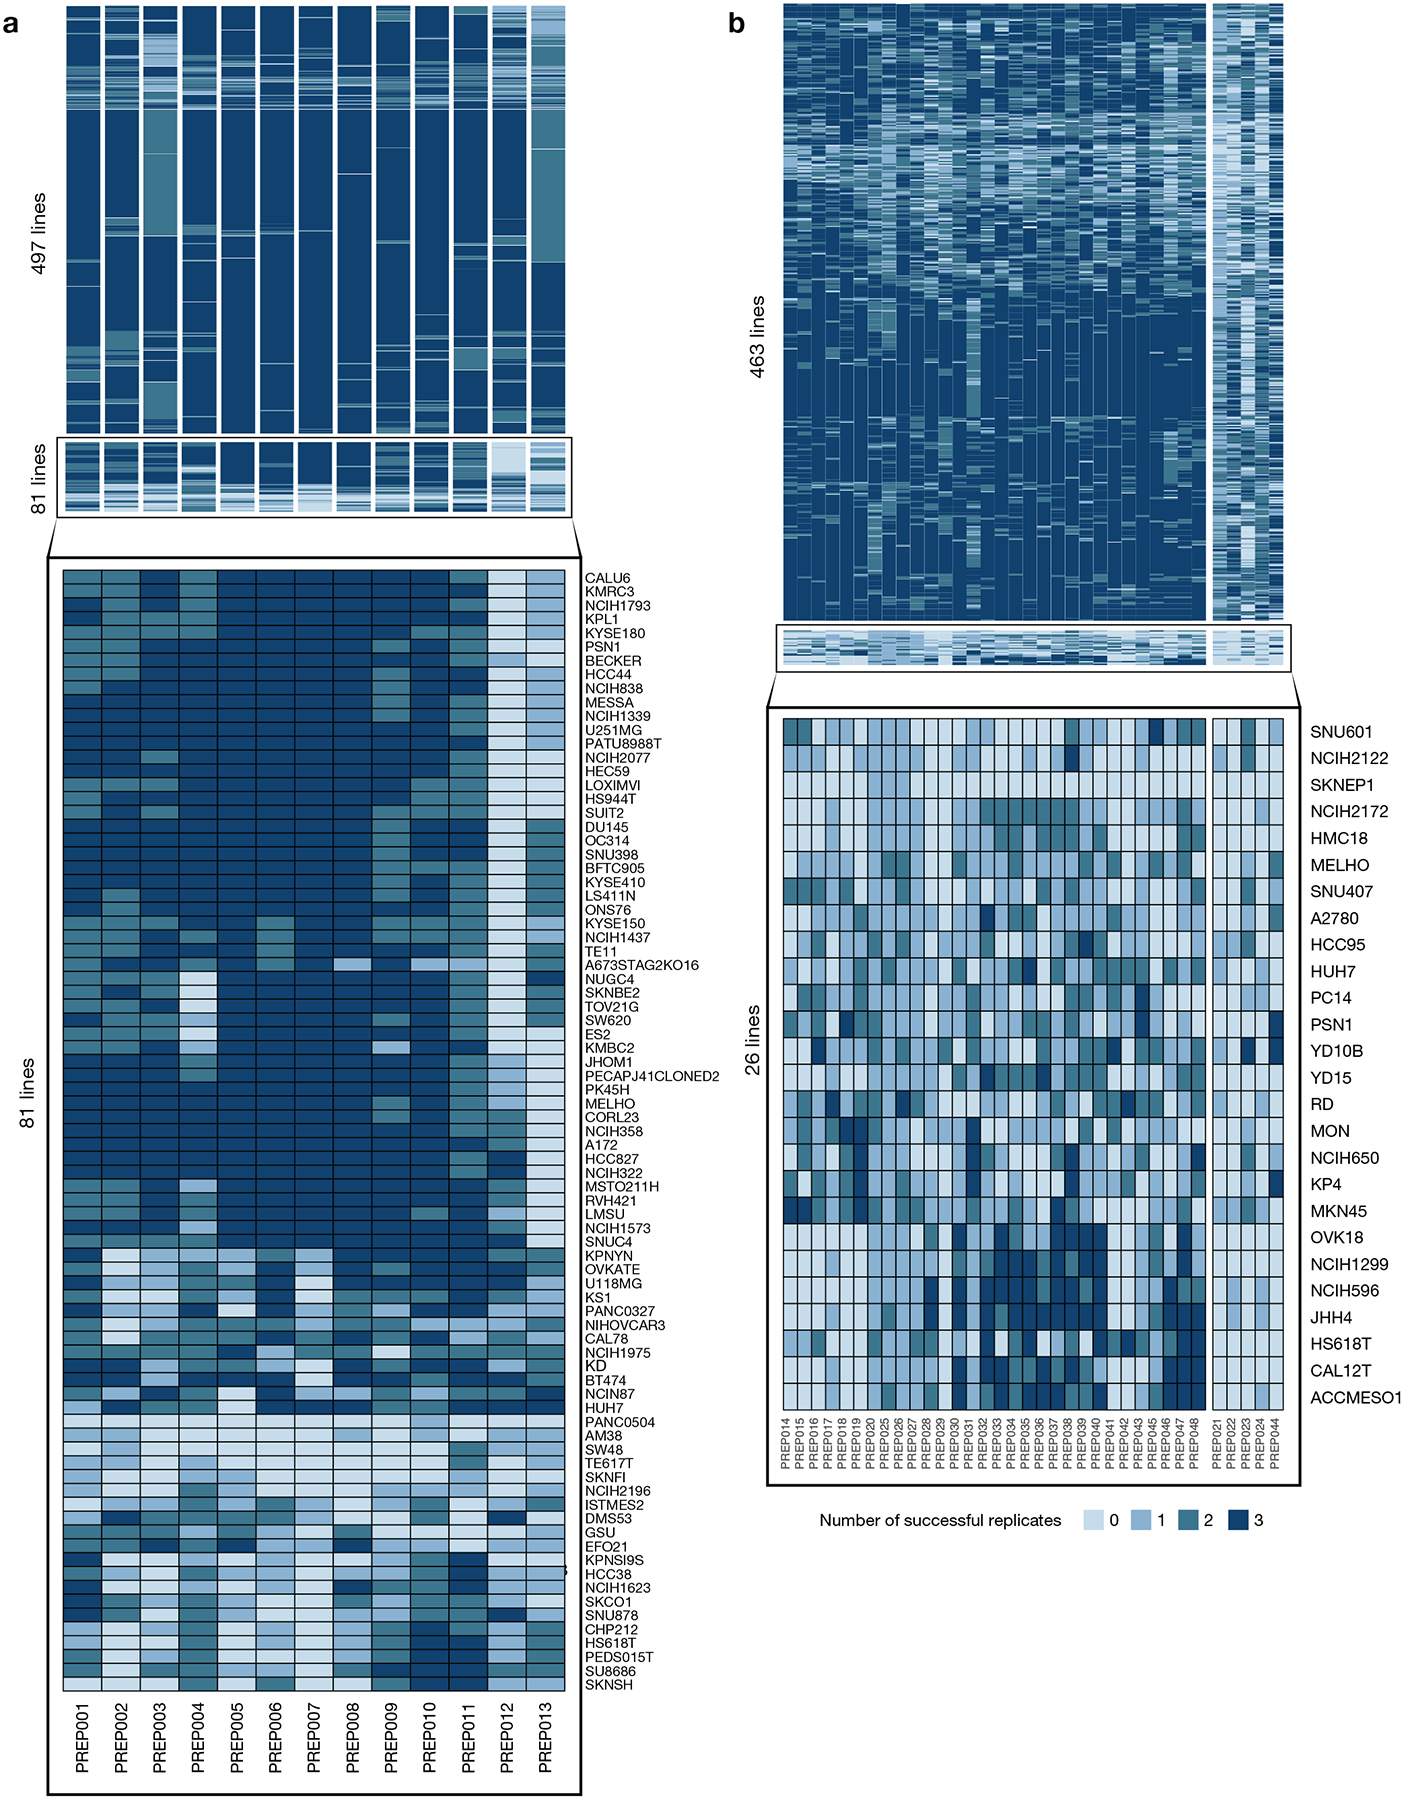
a, Number of individual cell assay well replicates (max n = 3) that pass QC filters in the primary screen, grouped by compound plate and cell line quality. 86% (497 out of 578) of the cell lines have at least one passing replicate for all compound plates. Identity of cell lines with lower quality data are listed at the bottom. b, Number of individual cell assay well replicates (max n = 3) that pass QC filters in the secondary screen. 95% (463 out of 489) of cell lines have at least 1 passing replicate on at least 85% (30 out of 35) of the compound plates.
Extended Data Fig. 5. Comparison of PRISM viability data to reference datasets.
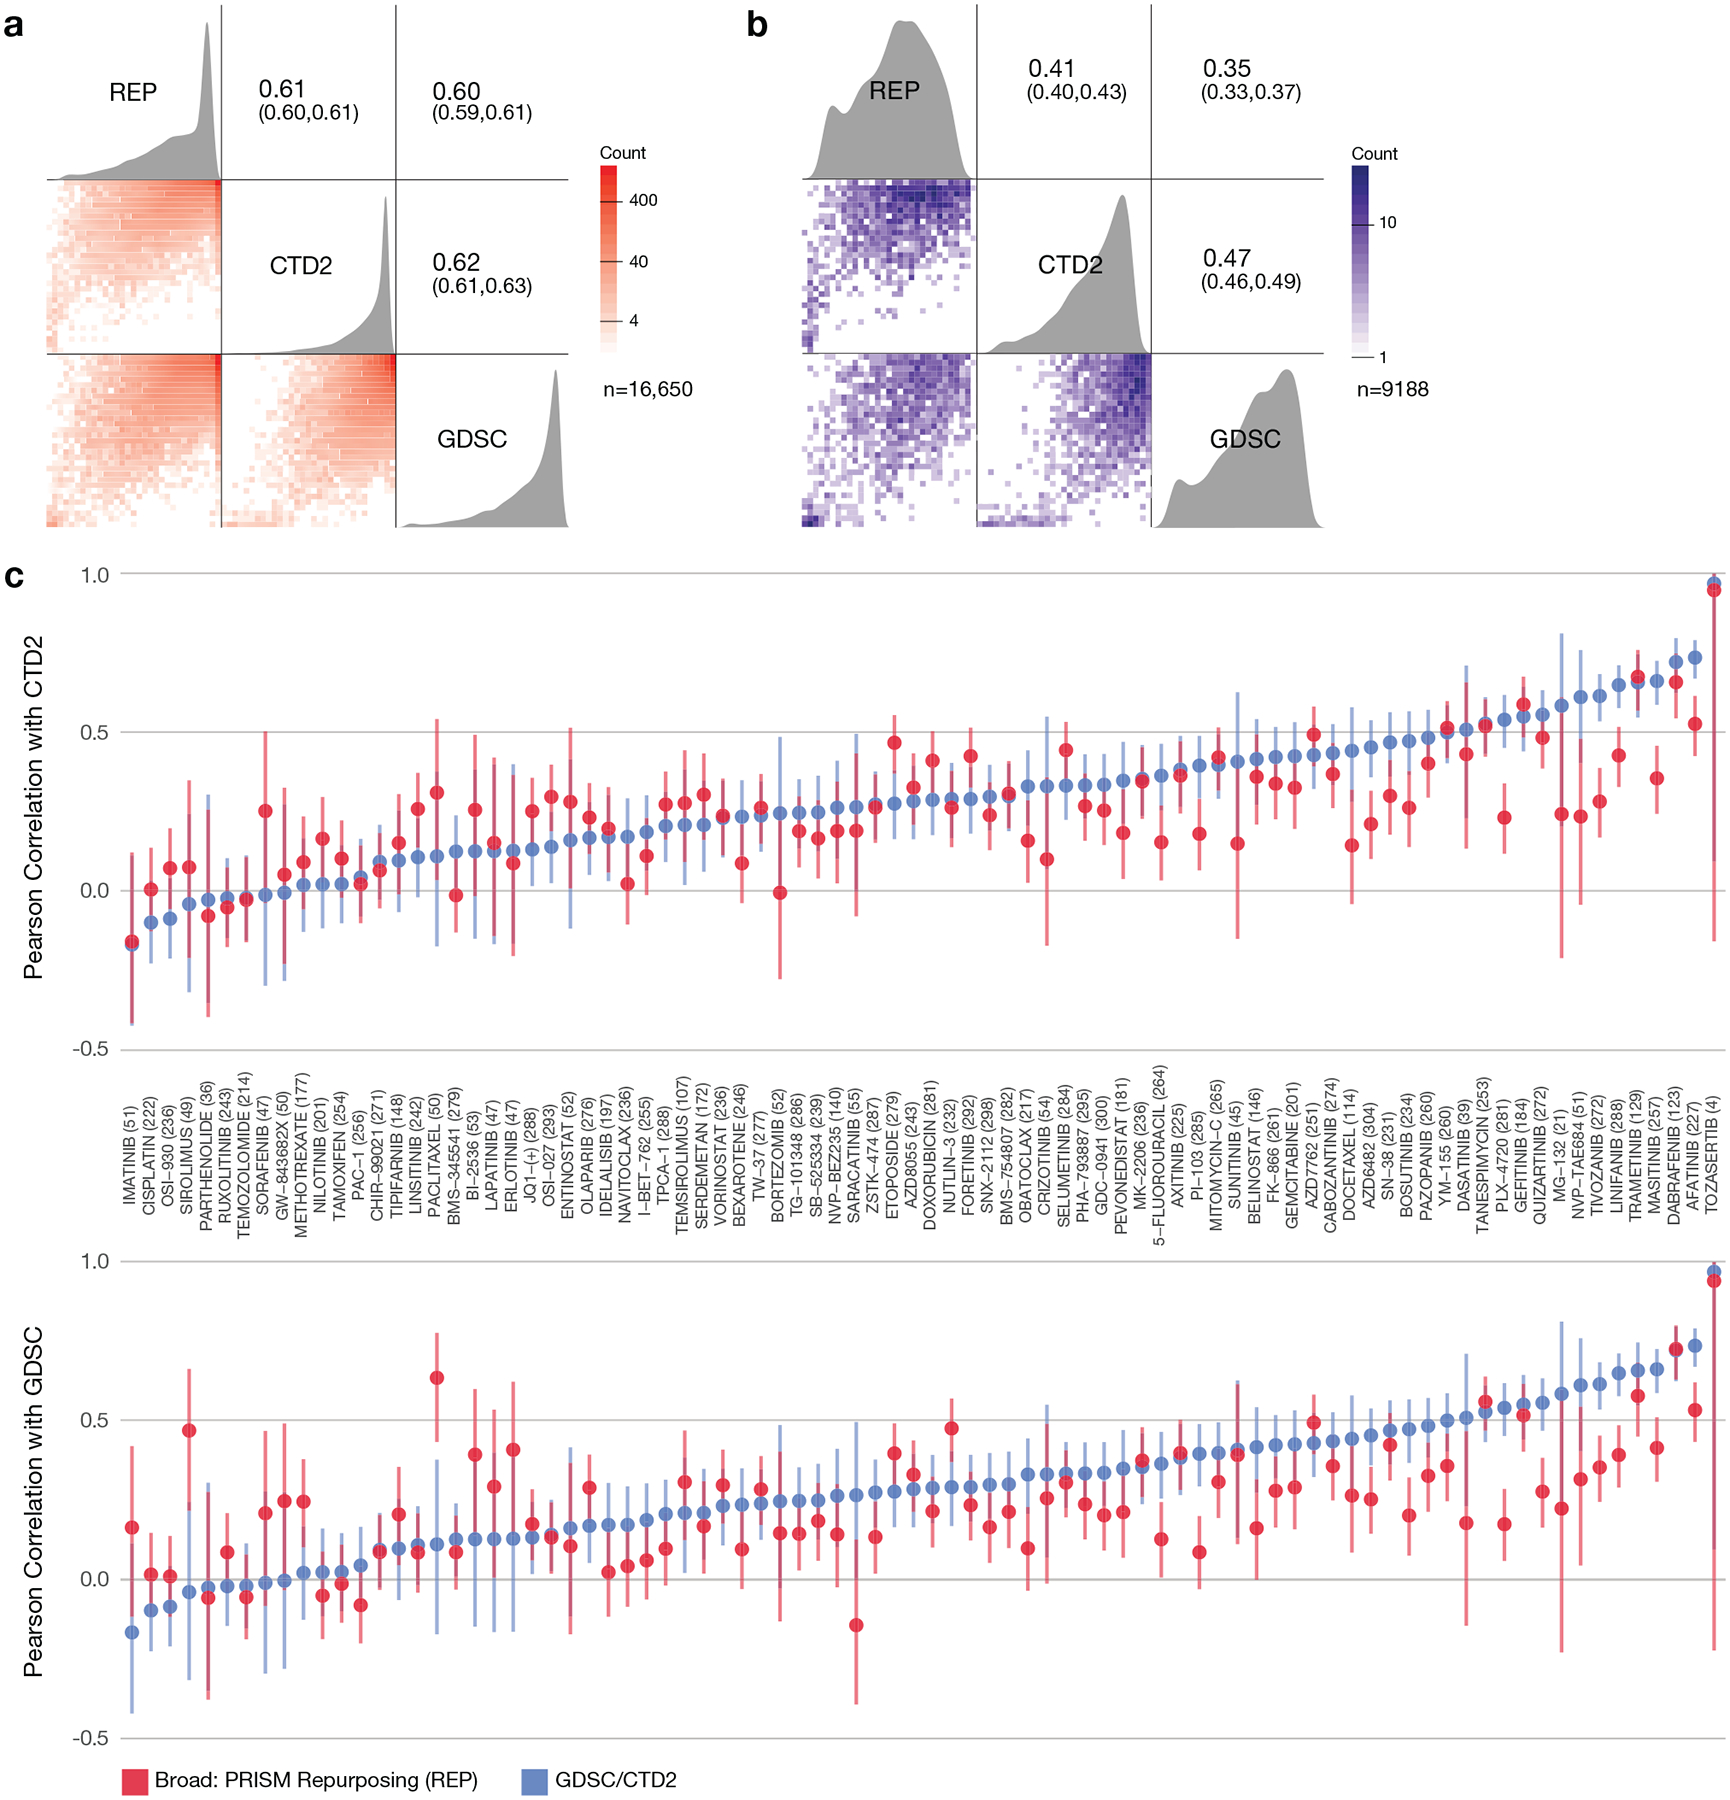
a, Pairwise Pearson correlations between drug response AUCs of publicly available datasets. AUC values were recomputed for 84 compounds and 318 cell lines (median 236 cell lines per compound) over the same dose-range for each compound-cell line pair in all 3 datasets (GDSC, CTD2, REP), and capped at 1. The Pearson correlation across shared compound-cell line pairs of the datasets is above 0.6. 44.8% of cell line-compound pairs show inactivity (AUC > 0.8) in all three datasets (n = 16650 compound-cell line pairs). b, Pairwise Pearson correlations between drug response AUCs after removing inactive cell line-compound pairs. Pearson correlations were re-calculated after filtering out the inactive data points (AUC > 0.8 in at all three datasets) (n = 9188 compound-cell line pairs). c, Compound-wise correlation between publicly available datasets. Correlation between PRISM data and other datasets is similar to correlation between other datasets. Points represent Pearson correlations and error bars represent 95% confidence intervals computed using Fisher’s z-transform. GDSC vs. CTD2 is in blue and REP vs. GDSC/CTD2 is in red. The number of cell lines shared by all three datasets is shown after each drug name. Paired t-tests on compound-wise correlations show statistically significant (two-sided p-value: 0.012 and 0.014 for top and bottom, respectively) but small mean of differences (0.049 and 0.039 for top and bottom, respectively). The number of data points used to compute each correlation is given in the figure for each compound.
Extended Data Fig. 6. PRISM Repurposing noise quantification.
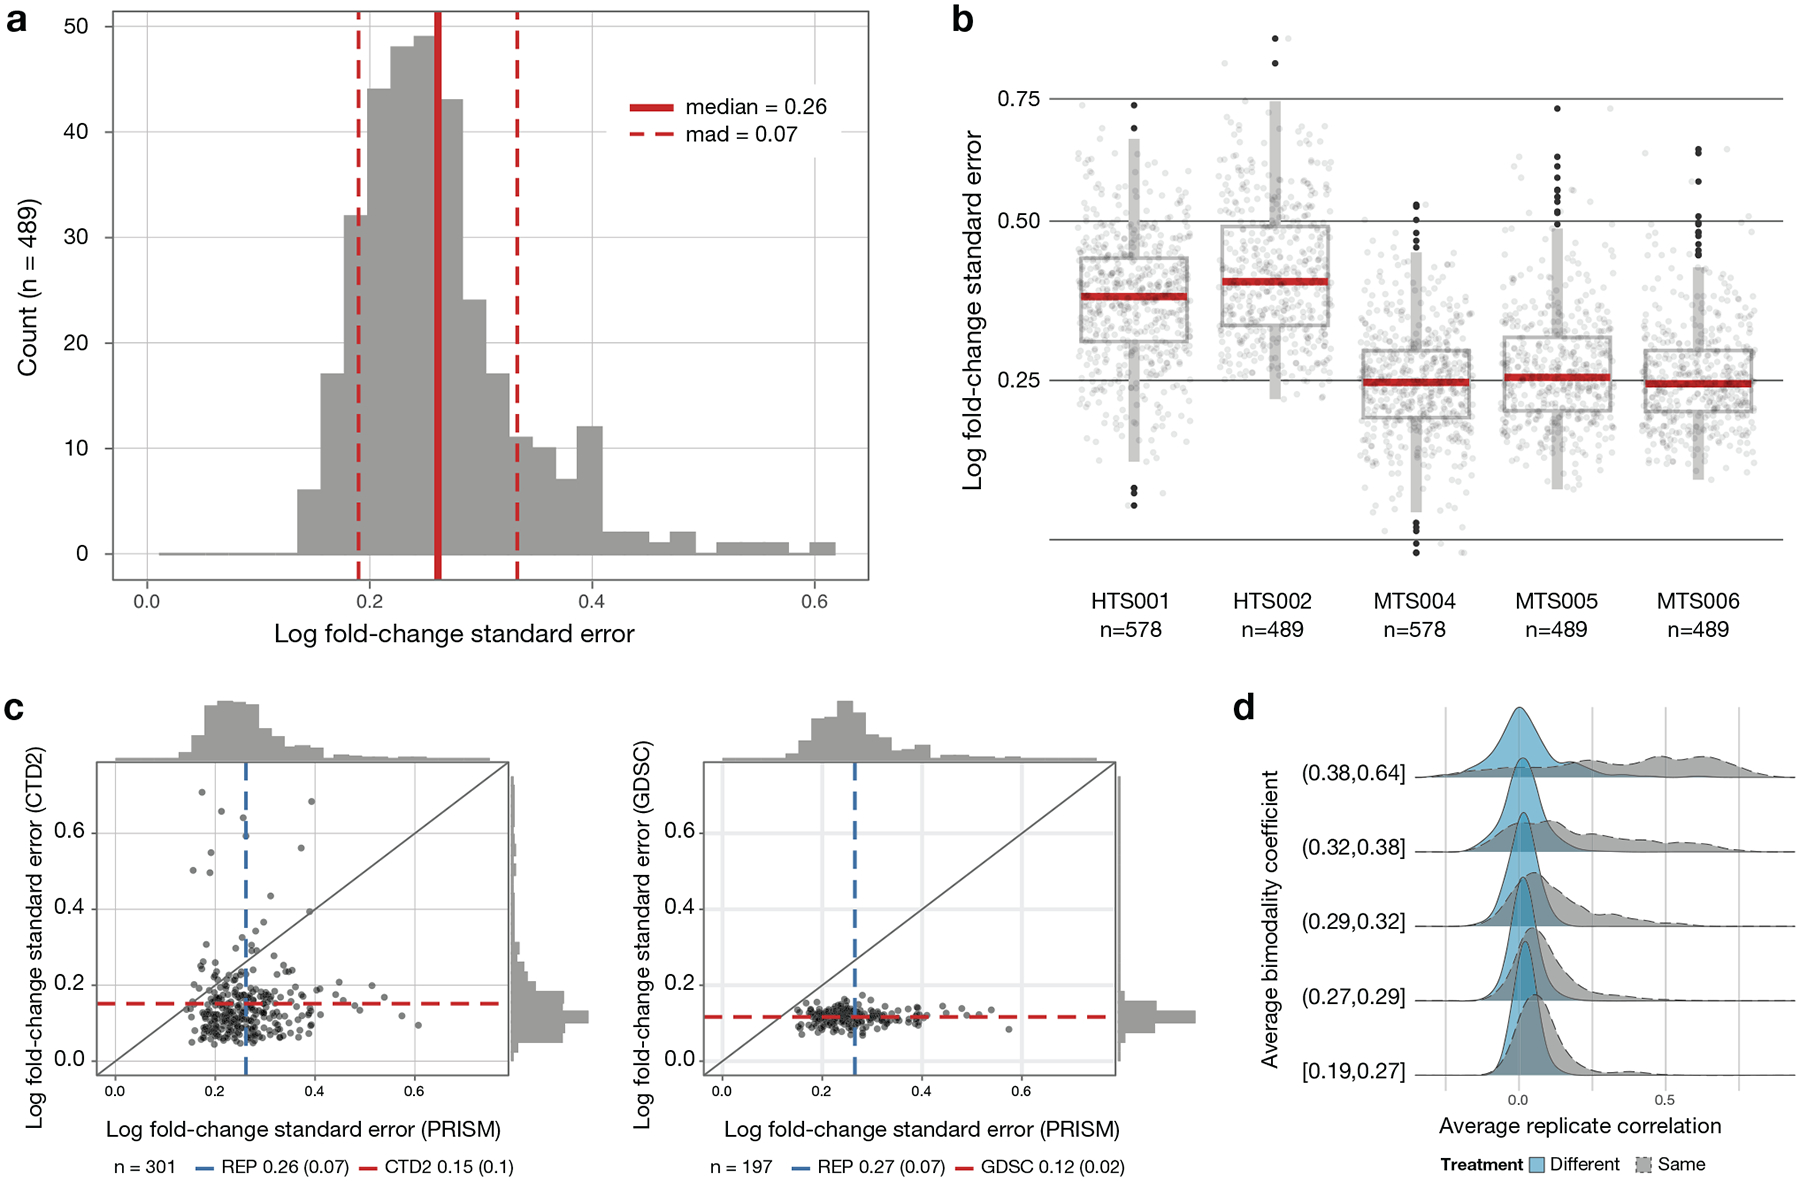
a, Cell line standard error estimates across vehicle-treated wells on PRISM plates treated with DMSO (n = 489 cell lines). Log fold-change standard errors are estimated for each cell line using DMSO-only plates included in the MTS006 screen (n = 384 × 3 replicate wells for each cell line). b, Comparison of standard error estimates across screens. The error estimate calculation is repeated for each screen using DMSO wells on standard compound plates (n = 32 replicate wells per plate), except for MTS006, which uses DMSO-only plates (n = 384 replicate wells per plate). Higher noise levels are observed in the initial high-throughput screens HTS001 (n = 578 cell lines) and HTS002 (n = 489 cell lines) compared with the medium-throughput screens MTS004 (n = 578 cell lines), MTS005 (n = 489 cell lines), and MTS006 (n = 489 cell lines). Upper box limits, center lines, and lower box limits correspond to 75th, 50th, and 25th percentiles, respectively. Whiskers extend from the box limits to the most extreme value up to 1.5 IQR from the median. All cell lines are depicted as points, regardless of outlier status. c, Comparison of estimated standard error of vehicle control wells between high-throughput pharmacogenomic datasets. The average standard error across cell lines (n = 301 cell lines for PRISM versus CTD2 and n = 197 for PRISM versus GDSC) is indicated by dashed lines with standard deviation in parentheses. d, Relationship between drug selectivity and replicate reproducibility in PRISM. Average Pearson correlation between replicates for each compound, dose, and screen combination is stratified by mean bimodality coefficient. For comparison, the null distribution for randomly paired compounds is shown in blue.
Extended Data Fig. 7. Generation of knockout cell lines by CRISPR/Cas9 editing.
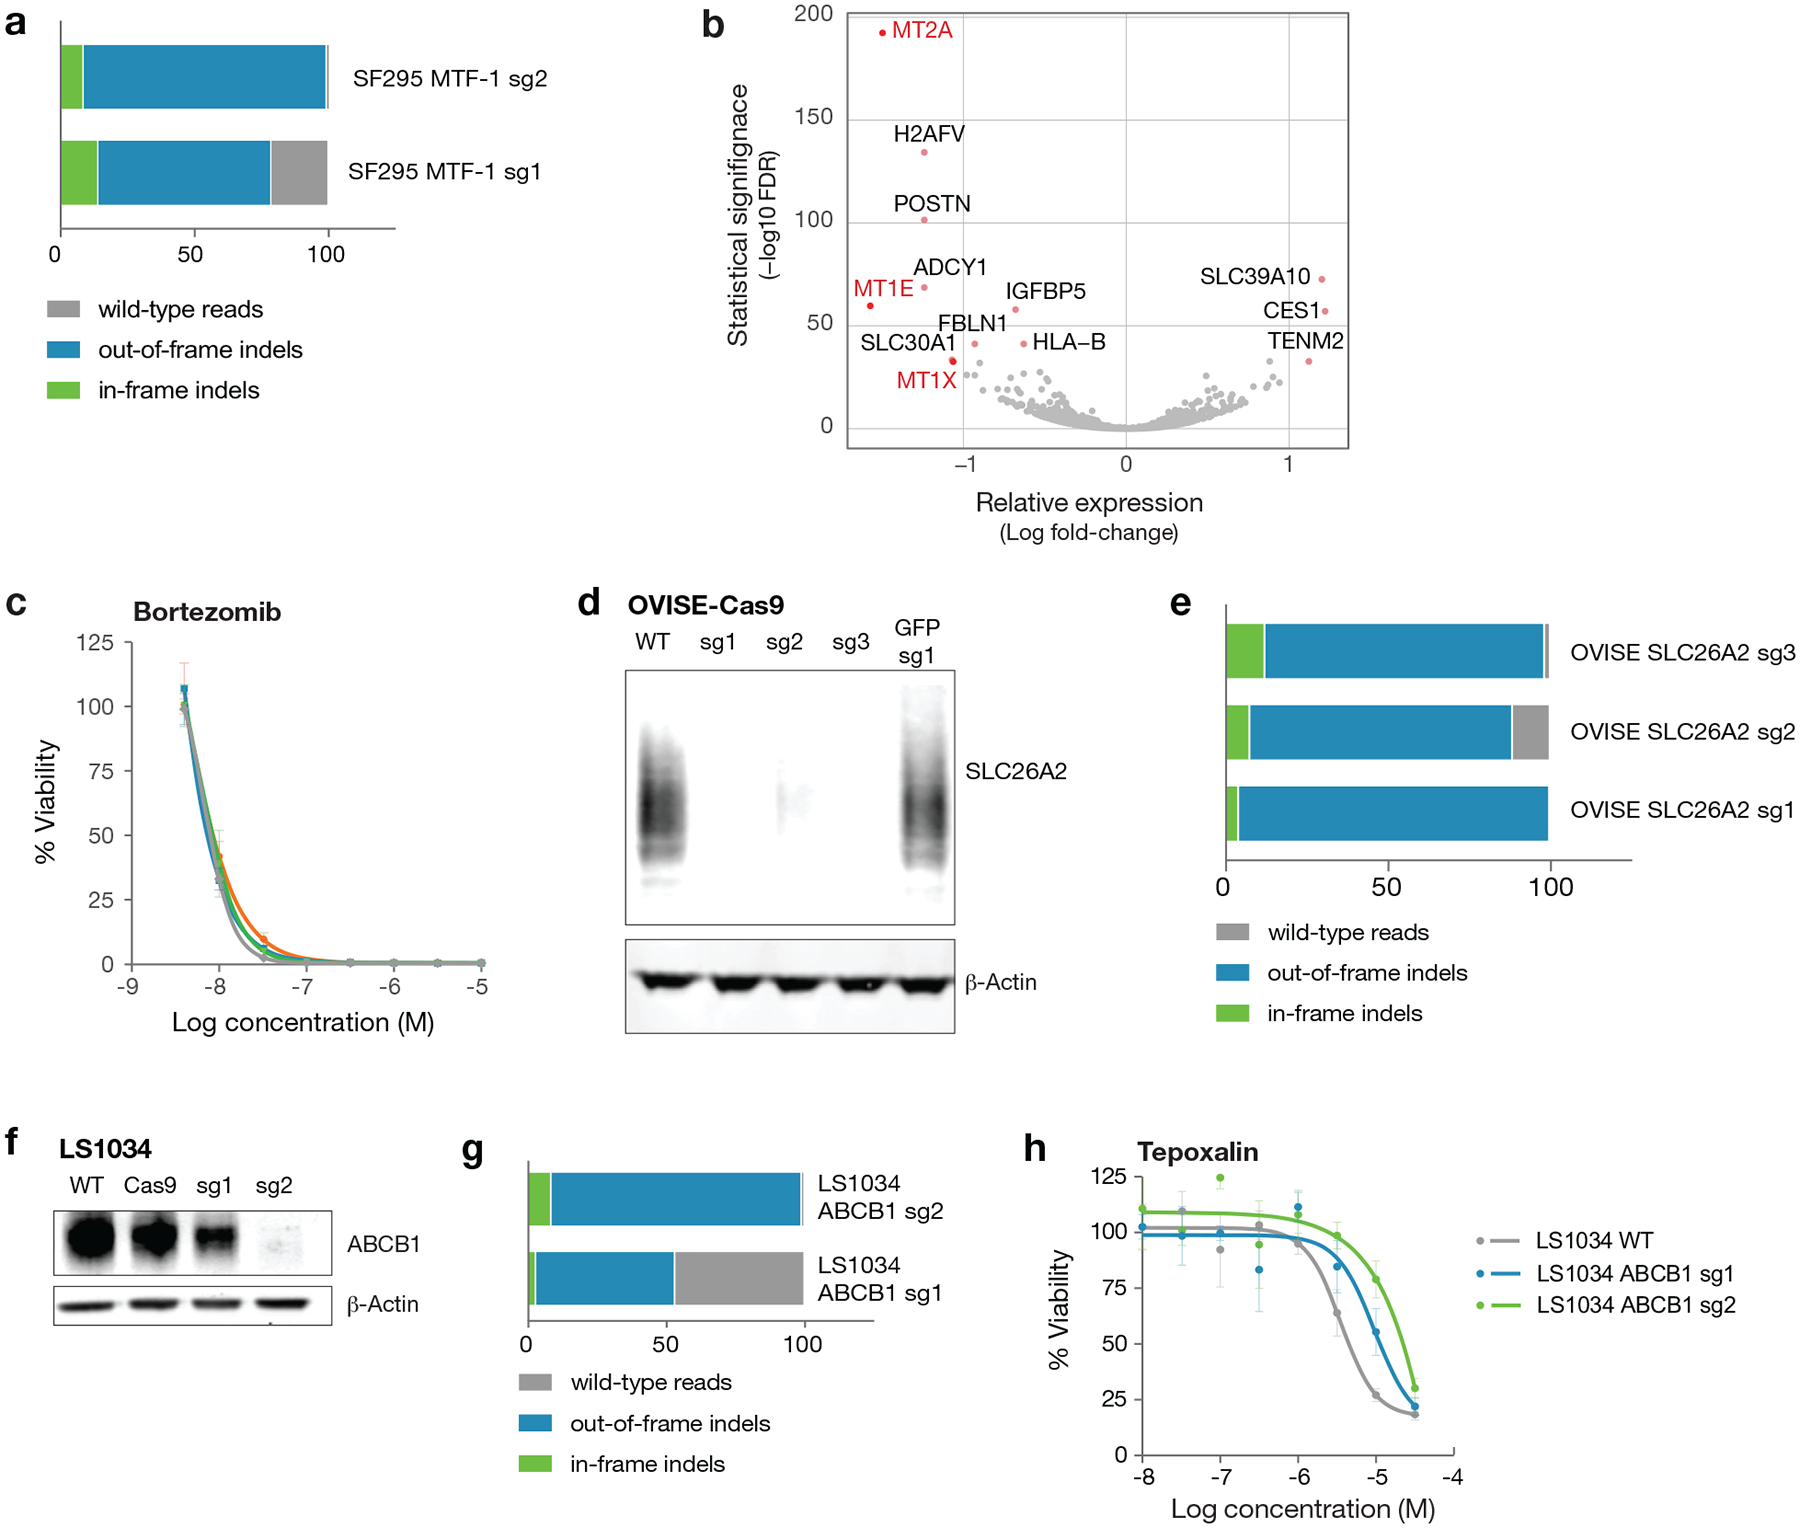
a, SF295 cells were transduced with multiple guides targeting the MTF-1 gene. Following selection, genomic DNA was isolated, and the targeted region was amplified by PCR. Results from the NGS CRISPR assay are shown as percent indel formation. b, Differentially expressed genes in SF295 glioma cells following MTF-1 knockout by CRISPR/Cas9. Loss of MT1E, MT1X, and MT2A expression was observed upon MTF-1 knockout. Gene expression across three independent cell wells per cell line were measured by mRNA sequencing. Two-sided p-values for differential gene expression following MTF-1 knockout vs. parental cell line were calculated with DESeq2 and corrected for multiple hypothesis testing using the Benjamini-Hochberg method. c, Drug sensitivity of SF295 cells with and without MTF-1 knockout. MTF-1 does not alter sensitivity to control chemotherapeutic bortezomib. Mean viability across 3 independently treated wells is shown, with standard deviation indicated by error bars. d, Western immunoblot validation of SLC26A2 knockout in OVISE ovarian and A2058 melanoma cancer cell lines. The SLC26A2 protein is known to migrate across a range of molecular weights due to glycosylation. Results are representative of two independent experiments. e, OVISE cells were transduced with multiple guides targeting the SLC26A2 gene. Indel frequency at the SLC26A2 CRISPR Cas9 cut sites was assessed by NGS CRISPR assay. f, ABCB1 western blot with and without CRISPR knockout of ABCB1 in the LS1034 colon cancer cell line. Western blot was performed once. g, Percent indel formation at genomic cut site in LS1034 ABCB1 CRISPR knockout lines assessed by NGS CRISPR assay. h, Cellular viability of LS1034 CRISPR knockout lines after treatment with tepoxalin for 5 days. Mean viability across 3 independently treated wells is shown, with standard deviation indicated by error bars.
Extended Data Fig. 8. Tepoxalin mechanistic studies.
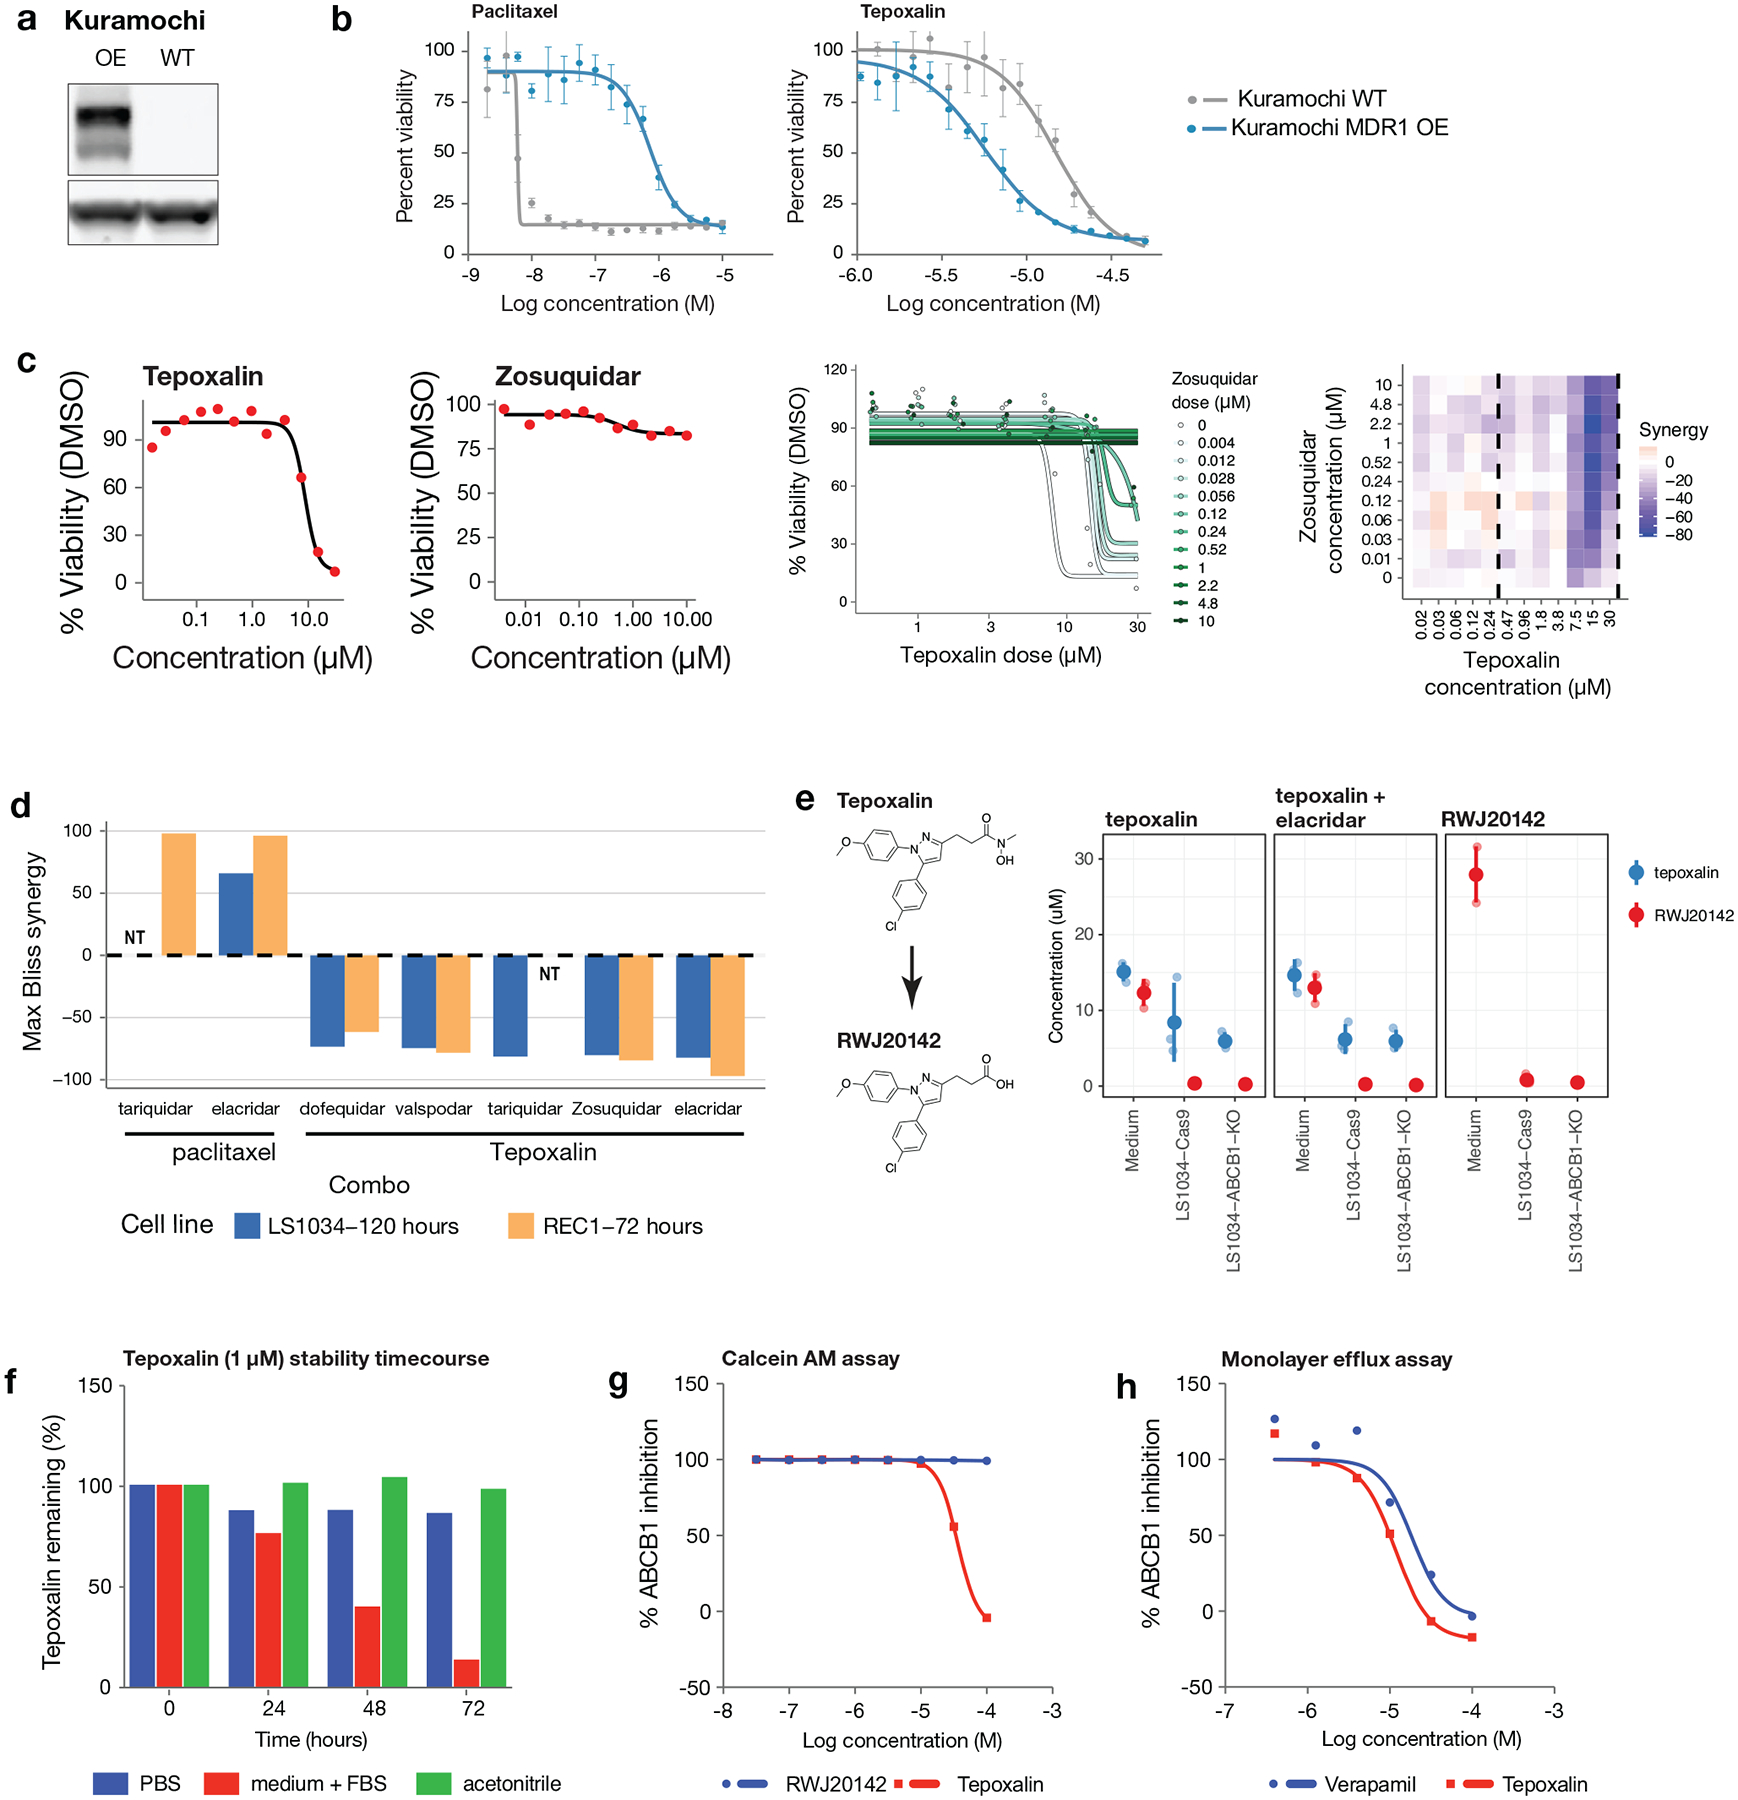
a, ABCB1 western blot with and without overexpression of ABCB1 in the Kuramochi ovarian cancer cell line. Western blot was performed once with three independent samples. b, Cellular viability of Kuramochi wild type and ABCB1-overexpressing cells after treatment with tepoxalin for 8 days. Mean viability across 3 independently treated wells is shown, with standard deviation indicated by error bars. c, (Left) Single-agent dose-response curves for LS1034 cells treated with tepoxalin and zosuquidar for 5 days. Two replicates were averaged. (Middle) Dose response curves for tepoxalin in combination with varying doses of zosuquidar (indicated by different colors) for 5 days. Data are shown for tepoxalin doses above 470 nM (the range indicated by the vertical dashed lines above). (Right) Bliss synergy scores estimated for each dose combination, showing strong antagonism by zosuquidar at tepoxalin doses above ~5 μM. Two combinations were not tested (NT). d, Maximum synergy score is shown across several drug combinations measured in both LS1034 and REC1 cell lines. Both tariquidar and elacridar were strongly synergistic in combination with paclitaxel, while all MDR1 inhibitors tested were antagonistic in combination with tepoxalin. e, Cellular permeability study of tepoxalin and RWJ20142 in LS1034 colon cancer cell lines with and without ABCB1 knockout. Each indicated cell line or media-only control was treated with 20 μM tepoxalin or RWJ20142 for 3 hours. Tepoxalin and RWJ20142 concentrations in cell lysate or medium were determined by liquid chromatography-mass spectrometry. Mean viability across 3 independently treated wells is shown, with standard deviation indicated by error bars. Shaded dots indicate underlying data. f, Stability study of tepoxalin in three different vehicles over 72 hours. Percent of tepoxalin remaining is indicated at each timepoint. g, ABCB1 antagonism assay using calcein AM fluorescence. MDCKII cells were treated with indicated concentration of tepoxalin or RWJ20142. Mean percent ABCB1 inhibition across 3 replicates is shown. h, ABCB1 transport-based activity assay. Basolateral transport of the ABCB1 substrate loperamide was assessed using a monolayer of MDCK-ABCB1 cells in the presence of tepoxalin or verapamil. Mean percent ABCB1 inhibition across 2 replicates is shown.
Supplementary Material
ACKNOWLEDGMENTS
We thank C. Yu, W. Hahn, B. Wolpin, A. Bass, N. Gray, K. Stegmaier, E. Stover, T. Lewis, M. Mesleh, A. Burgin, S. Alper, G. Botta, M. Macaluso, P. Tsvetkov, X. Jin, K. Blakeslee, G. Ciolek, and E. Lander for helpful scientific discussions. M. Passino, C. Zhu, K. Gore, M. Laird, C. Trapechio, and E. Parikh generated barcoded PRISM cell lines and performed assays. K. Stumbraite assisted with STR fingerprinting. S. Johnson and J. Davis performed lysate processing and detection. S.E. Johnson and R. Singh provided analytical chemistry support. A. Vrcic, C. Sandland, and S. Figueroa-Lazu assisted with compound management. G. Kugener and A. Gonzalez provided technical assistance. Supported in part by the Carlos Slim Foundation (Slim Initiative in Genomic Medicine for the Americas (SIGMA)), Next Generation Fund at the Broad Institute of MIT and Harvard (S.M.C.), the Conquer Cancer Foundation of ASCO Young Investigator Award (S.M.C.), and NIH grants U01 HG008699 (T.R.G and A.S.), U54 HL127366 (T.R.G and A.S.), KL2 TR002542 (S.M.C.), and K08 CA230220 (S.M.C.).
Footnotes
COMPETING INTERESTS
S.M.C, X.W., H.G, M.M., A.S., and T.R.G receive research funding unrelated to this project from Bayer HealthCare. M.M receives research funding from Ono and serves as a scientific advisory board and consultant for OrigiMed. M.M. has patents licensed to LabCorp and Bayer. M.M. and T.R.G. were formerly consultants and equity holders in Foundation Medicine, acquired by Roche. J.A.B. is an employee and shareholder of Vertex Pharmaceuticals. J.G.D. and A.T. consult for Tango Therapeutics. T.R.G. is a consultant to GlaxoSmithKline and is a founder of Sherlock Biosciences. Patent applications for the drug uses detailed in this manuscript have been filed. Other authors declare no competing interests.
REFERENCES
- 1.Alley MC et al. Feasibility of drug screening with panels of human tumor cell lines using a microculture tetrazolium assay. Cancer Res. 48, 589–601 (1988). [PubMed] [Google Scholar]
- 2.Garnett MJ et al. Systematic identification of genomic markers of drug sensitivity in cancer cells. Nature 483, 570–575 (2012). [DOI] [PMC free article] [PubMed] [Google Scholar]
- 3.Basu A et al. An Interactive Resource to Identify Cancer Genetic and Lineage Dependencies Targeted by Small Molecules. Cell 154, 1151–1161 (2013). [DOI] [PMC free article] [PubMed] [Google Scholar]
- 4.Yu C et al. High-throughput identification of genotype-specific cancer vulnerabilities in mixtures of barcoded tumor cell lines. Nat. Biotechnol 34, 419–423 (2016). [DOI] [PMC free article] [PubMed] [Google Scholar]
- 5.Corsello SM et al. The Drug Repurposing Hub: a next-generation drug library and information resource. Nat. Med 23, 405–408 (2017). [DOI] [PMC free article] [PubMed] [Google Scholar]
- 6.Ben-David U et al. Genetic and transcriptional evolution alters cancer cell line drug response. Nature 560, 325–330 (2018). [DOI] [PMC free article] [PubMed] [Google Scholar]
- 7.McInnes L, Healy J, Saul N & Großberger L UMAP: Uniform Manifold Approximation and Projection. JOSS 3, 861 (2018). [Google Scholar]
- 8.Ellison AM Effect of Seed Dimorphism on the Density-Dependent Dynamics of Experimental Populations of Atriplex triangularis (Chenopodiaceae). Am. J. Bot 74, 1280–1288 (1987). [Google Scholar]
- 9.Tsherniak A et al. Defining a Cancer Dependency Map. Cell 170, 564–576.e16 (2017). [DOI] [PMC free article] [PubMed] [Google Scholar]
- 10.Barretina J et al. The Cancer Cell Line Encyclopedia enables predictive modelling of anticancer drug sensitivity. Nature 483, 603–607 (2012). [DOI] [PMC free article] [PubMed] [Google Scholar]
- 11.Ghandi M et al. Next-generation characterization of the Cancer Cell Line Encyclopedia. Nature 569, 503–508 (2019). [DOI] [PMC free article] [PubMed] [Google Scholar]
- 12.Li H et al. The landscape of cancer cell line metabolism. Nat. Med 25, 850–860 (2019). [DOI] [PMC free article] [PubMed] [Google Scholar]
- 13.Meyers RM et al. Computational correction of copy number effect improves specificity of CRISPR-Cas9 essentiality screens in cancer cells. Nat. Genet 49, 1779–1784 (2017). [DOI] [PMC free article] [PubMed] [Google Scholar]
- 14.McFarland JM et al. Improved estimation of cancer dependencies from large-scale RNAi screens using model-based normalization and data integration. Nat. Commun 9, 4610 (2018). [DOI] [PMC free article] [PubMed] [Google Scholar]
- 15.Aben N, Vis DJ, Michaut M & Wessels LFA TANDEM: a two-stage approach to maximize interpretability of drug response models based on multiple molecular data types. Bioinformatics 32, i413–i420 (2016). [DOI] [PubMed] [Google Scholar]
- 16.Rydenfelt M, Wongchenko M, Klinger B, Yan Y & Blüthgen N The cancer cell proteome and transcriptome predicts sensitivity to targeted and cytotoxic drugs. Life Sci Alliance 2, (2019). [DOI] [PMC free article] [PubMed] [Google Scholar]
- 17.Iorio F et al. A Landscape of Pharmacogenomic Interactions in Cancer. Cell 166, 740–754 (2016). [DOI] [PMC free article] [PubMed] [Google Scholar]
- 18.de Waal L et al. Identification of cancer-cytotoxic modulators of PDE3A by predictive chemogenomics. Nat. Chem. Biol 12, 102–108 (2016). [DOI] [PMC free article] [PubMed] [Google Scholar]
- 19.Karin M et al. Human metallothionein genes are clustered on chromosome 16. Proc. Natl. Acad. Sci. U. S. A 81, 5494–5498 (1984). [DOI] [PMC free article] [PubMed] [Google Scholar]
- 20.Skrott Z et al. Alcohol-abuse drug disulfiram targets cancer via p97 segregase adaptor NPL4. Nature 552, 194–199 (2017). [DOI] [PMC free article] [PubMed] [Google Scholar]
- 21.Nechushtan H et al. A phase IIb trial assessing the addition of disulfiram to chemotherapy for the treatment of metastatic non-small cell lung cancer. Oncologist 20, 366–367 (2015). [DOI] [PMC free article] [PubMed] [Google Scholar]
- 22.Eckschlager T, Adam V, Hrabeta J, Figova K & Kizek R Metallothioneins and cancer. Curr. Protein Pept. Sci 10, 360–375 (2009). [DOI] [PubMed] [Google Scholar]
- 23.Irth H, de Jong GJ, Brinkman UA & Frei RW Metallic copper-containing post-column reactor for the detection of thiram and disulfiram in liquid chromatography. J. Chromatogr 370, 439–447 (1986). [DOI] [PubMed] [Google Scholar]
- 24.Tsvetkov P et al. Mitochondrial metabolism promotes adaptation to proteotoxic stress. Nat. Chem. Biol 15, 681–689 (2019). [DOI] [PMC free article] [PubMed] [Google Scholar]
- 25.Iljin K et al. High-throughput cell-based screening of 4910 known drugs and drug-like small molecules identifies disulfiram as an inhibitor of prostate cancer cell growth. Clin. Cancer Res 15, 6070–6078 (2009). [DOI] [PubMed] [Google Scholar]
- 26.Taylor AM et al. Genomic and Functional Approaches to Understanding Cancer Aneuploidy. Cancer Cell 33, 676–689.e3 (2018). [DOI] [PMC free article] [PubMed] [Google Scholar]
- 27.Cancer Genome Atlas Network. Comprehensive molecular portraits of human breast tumours. Nature 490, 61–70 (2012). [DOI] [PMC free article] [PubMed] [Google Scholar]
- 28.Cancer Genome Atlas Research Network. Integrated genomic analyses of ovarian carcinoma. Nature 474, 609–615 (2011). [DOI] [PMC free article] [PubMed] [Google Scholar]
- 29.Wang J, Yuen VG & McNeill JH Effect of vanadium on insulin sensitivity and appetite. Metabolism 50, 667–673 (2001). [DOI] [PubMed] [Google Scholar]
- 30.Thompson KH et al. Vanadium treatment of type 2 diabetes: a view to the future. J. Inorg. Biochem 103, 554–558 (2009). [DOI] [PubMed] [Google Scholar]
- 31.Hästbacka J et al. The diastrophic dysplasia gene encodes a novel sulfate transporter: positional cloning by fine-structure linkage disequilibrium mapping. Cell 78, 1073–1087 (1994). [DOI] [PubMed] [Google Scholar]
- 32.Hästbacka J et al. Identification of the Finnish founder mutation for diastrophic dysplasia (DTD). Eur. J. Hum. Genet 7, 664–670 (1999). [DOI] [PubMed] [Google Scholar]
- 33.Broad Institute TCGA Genome Data Analysis Center. Analysis-ready standardized TCGA data from Broad GDAC Firehose 2016_01_28 run. (2016). doi: 10.7908/C11G0KM9 [DOI] [Google Scholar]
- 34.Argentieri DC et al. Tepoxalin: a dual cyclooxygenase/5-lipoxygenase inhibitor of arachidonic acid metabolism with potent anti-inflammatory activity and a favorable gastrointestinal profile. J. Pharmacol. Exp. Ther 271, 1399–1408 (1994). [PubMed] [Google Scholar]
- 35.Food and Drug Administration. Tepoxalin - Animal Drugs at FDA. Tepoxalin - Animal Drugs at FDA Available at: https://animaldrugsatfda.fda.gov/adafda/views/#/home/previewsearch/141-193. (Accessed: 28th May 2019) [Google Scholar]
- 36.Dubey R et al. Chromatin-Remodeling Complex SWI/SNF Controls Multidrug Resistance by Transcriptionally Regulating the Drug Efflux Pump ABCB1. Cancer Res. 76, 5810–5821 (2016). [DOI] [PMC free article] [PubMed] [Google Scholar]
- 37.Waldman SA et al. Pharmacokinetics and pharmacodynamics of tepoxalin after single oral dose administration to healthy volunteers. J. Clin. Pharmacol 36, 462–468 (1996). [DOI] [PubMed] [Google Scholar]
- 38.Dimberg LY et al. A Genome-Wide Loss-of-Function Screen Identifies SLC26A2 as a Novel Mediator of TRAIL Resistance. Mol. Cancer Res 15, 382–394 (2017). [DOI] [PMC free article] [PubMed] [Google Scholar]
- 39.Straussman R et al. Tumour micro-environment elicits innate resistance to RAF inhibitors through HGF secretion. Nature 487, 500–504 (2012). [DOI] [PMC free article] [PubMed] [Google Scholar]
- 40.Stover EH et al. Pooled Genomic Screens Identify Anti-apoptotic Genes as Targetable Mediators of Chemotherapy Resistance in Ovarian Cancer. Mol. Cancer Res (2019). doi: 10.1158/1541-7786.MCR-18-1243 [DOI] [PMC free article] [PubMed] [Google Scholar]
- 41.Subramanian A et al. A Next Generation Connectivity Map: L1000 Platform and the First 1,000,000 Profiles. Cell 171, 1437–1452.e17 (2017). [DOI] [PMC free article] [PubMed] [Google Scholar]
- 42.Zhang XD A pair of new statistical parameters for quality control in RNA interference high-throughput screening assays. Genomics 89, 552–561 (2007). [DOI] [PubMed] [Google Scholar]
- 43.Johnson WE, Li C & Rabinovic A Adjusting batch effects in microarray expression data using empirical Bayes methods. Biostatistics 8, 118–127 (2007). [DOI] [PubMed] [Google Scholar]
- 44.Smirnov P et al. PharmacoGx: an R package for analysis of large pharmacogenomic datasets. Bioinformatics 32, 1244–1246 (2016). [DOI] [PubMed] [Google Scholar]
- 45.Strobl C, Boulesteix A-L, Kneib T, Augustin T & Zeileis A Conditional variable importance for random forests. BMC Bioinformatics 9, 307 (2008). [DOI] [PMC free article] [PubMed] [Google Scholar]
- 46.Chatfield C Statistics for Technology : A Course in Applied Statistics, Third Edition (Routledge, 2018). [Google Scholar]
- 47.Honaker J, King G & Blackwell M Amelia II: A Program for Missing Data. Journal of Statistical Software, Articles 45, 1–47 (2011). [Google Scholar]
- 48.Ritchie ME et al. limma powers differential expression analyses for RNA-sequencing and microarray studies. Nucleic Acids Res. 43, e47 (2015). [DOI] [PMC free article] [PubMed] [Google Scholar]
- 49.Doench JG et al. Optimized sgRNA design to maximize activity and minimize off-target effects of CRISPR-Cas9. Nat. Biotechnol 34, 184–191 (2016). [DOI] [PMC free article] [PubMed] [Google Scholar]
- 50.Sanson KR et al. Optimized libraries for CRISPR-Cas9 genetic screens with multiple modalities. Nat. Commun 9, 5416 (2018). [DOI] [PMC free article] [PubMed] [Google Scholar]
- 51.Li W et al. Quality control, modeling, and visualization of CRISPR screens with MAGeCK-VISPR. Genome Biol. 16, 281 (2015). [DOI] [PMC free article] [PubMed] [Google Scholar]
- 52.He L et al. Methods for High-throughput Drug Combination Screening and Synergy Scoring in Cancer Systems Biology: Methods and Protocols (ed. von Stechow L) 351–398 (Springer; New York, 2018). [DOI] [PMC free article] [PubMed] [Google Scholar]
- 53.Polli JW et al. Rational use of in vitro P-glycoprotein assays in drug discovery. J. Pharmacol. Exp. Ther 299, 620–628 (2001). [PubMed] [Google Scholar]
- 54.GTEx Consortium et al. Genetic effects on gene expression across human tissues. Nature 550, 204–213 (2017). [DOI] [PMC free article] [PubMed] [Google Scholar]
- 55.Birger C et al. FireCloud, a scalable cloud-based platform for collaborative genome analysis: Strategies for reducing and controlling costs. bioRxiv 209494 (2017). doi: 10.1101/209494 [DOI] [Google Scholar]
- 56.Love MI, Huber W & Anders S Moderated estimation of fold change and dispersion for RNA-seq data with DESeq2. Genome Biol. 15, 550 (2014). [DOI] [PMC free article] [PubMed] [Google Scholar]
Associated Data
This section collects any data citations, data availability statements, or supplementary materials included in this article.
Supplementary Materials
Data Availability Statement
The PRISM Repurposing dataset, including screening data and all metadata, is available at the Cancer Dependency Map portal at https://depmap.org/repurposing.
Raw and processed PRISM viability data are available from the Cancer Dependency Map portal (https://depmap.org/repurposing) and archived via Figshare (doi:10.6084/m9.figshare.9393293). An interactive version of Figure 2a and Figure 4 (with accompanying raw data) is also available on the Cancer Dependency Map portal; scatter plot source data is also deposited in Figshare (doi:10.6084/m9.figshare.9393293). The cell line features used for biomarker analysis are listed in Supplementary Table 10 and also archived via Figshare (doi:10.6084/m9.figshare.10277810). RNA sequencing data were deposited in the Gene Expression Omnibus (GEO, accession number GSE133299). All other data supporting the findings of this study are available from the corresponding author on reasonable request.