Abstract
To compare clinical and imaging features between patients with an initial negative reverse-transcription-polymerase chain-reaction (RT-PCR) test and patients with an initial positive RT-PCR test. CT follow-up analysis in the negative RT-PCR group is also described.
Thirty-three patients with SARS-CoV-2 infection confirmed by RT-PCR, with 216 lesions upon CT, were included. Demographic information and chest CT imaging features were collected.
The average age in the whole study group was 46.9 ± 11.1 years, with 18 males and 15 females. Patients in the positive RT-PCR test group were more likely to have a fever than patients in the negative RT-PCR test group (85.7% vs 50%, P < .05). Lesions in the positive group were more likely to be located in the peripheral area than lesions in the negative group (83.6% vs 68.2%, P < .05). Regarding the appearance of 216 lesions, ground-glass opacities (GGOs) with consolidation (43.2%) was the most common appearance in the negative group, followed by pure GGOs (31.8%), while in the positive group, pure GGOs (32%) and GGOs with interlobular septal thickening (32.8%) were both most frequent, and the difference between them was evident (P < .05). For the follow-up analysis, the largest short-axis of a lesion was smaller upon follow-up (median size 13.6 mm vs 14 mm), albeit by a smaller margin. Pure GGOs decreased in frequency, from 31.3% to 21.3%, while consolidation increased in frequency, from 7.5% to 12.5%.
The manifestations of COVID-19 in patients with a first negative RT-PCR test and patients with a positive first RT-PCR test are different to some extent. The consolidation component may increase after follow-up.
Keywords: COVID-19, severe acute respiratory syndrome coronavirus 2, tomography, x-ray computed
1. Introduction
In 31, December 2019, a cluster of patients diagnosed with COVID-19 infected by severe acute respiratory syndrome coronavirus 2 (SARS-CoV-2) was initially reported in Wuhan, Hubei Province, China.[1] With the rapid spread of the disease, there have been nearly 2 million laboratory-confirmed cases and more than 120,000 deaths worldwide, affecting 213 countries, areas or territories by 16 April 2020.[2] SARS-CoV-2 is one of the coronaviruses, which are enveloped RNA viruses that are found broadly, not only in humans but also in other mammals and birds, and can infect human airway epithelial cells.[1] Similar to two other highly pathogenic and transmissible viruses, SARS-CoV and Middle East respiratory syndrome coronavirus (MERS-CoV), SARS-CoV-2 is a member of the Coronaviridae family and can result in severe and even fatal respiratory diseases, such as acute respiratory distress syndrome, especially in older patients with comorbidities.[3,4]
Patients with COVID-19 present with typical manifestations, such as single or multiple patchy ground-glass opacities, with or without interstitial, interlobular septal thickening, which can be accompanied by consolidation, located in the peripheral area, without subpleural sparing.[5] The patient with typical chest CT results usually manifests positive results of real-time reverse-transcription-polymerase chain-reaction (RT-PCR) for the virus. However, in clinical practice, we found that patients could present negative results in their first or even subsequent RT-PCR tests, even in patients with typical chest CT results, and the proportion of patients with negative RT-PCR test results is high.[6] Therefore, to include these patients and prevent potential public risks caused by missed patients, China has added clinical criteria only in Hubei Province, based on chest CT results and clinical discovery, which resulted in exaggeratively increasing the number of cases to more than 14,840 overnight, including 13332 clinically confirmed cases on the first day of its release (February 13).[7] Few studies exist in the literature related to CT results in patients with negative RT-PCR test results.[6] Thus, the purpose of our study was to compare the CT imaging features of 12 patients with initial negative RT-PCR results with those of 21 patients with initial positive RT-PCR results. Furthermore, we also performed follow-up research among patients with negative RT-PCR results, including the largest sample to date.
2. Materials and methods
This retrospective study was approved by our institutional review board, while the requirement for informed consent from each patient was waived.
2.1. Patients
Patients diagnosed with COVID-19 confirmed by RT-PCR from January 24, 2020 to February 6, 2020 were retrospectively evaluated.
The inclusion criteria were as follows: (A) patients with a positive RT-PCR test and (B) patients demonstrating pneumonia in thin-section CT images. Three patients with normal chest CT imaging results were excluded. Finally, 33 patients were included, including 12 patients with a negative first RT-PCR test and 21 patients with a positive first RT-PCR test.
2.2. Image acquisition
All patients underwent thin-section high-resolution CT scans. All CT examinations were performed with GE Revolution Evo CT scan (GE Healthcare, Milwaukee, WI) without the use of an intravenous agent. All scans were performed with patients in the supine position during end-inspiration. The CT parameters were as follows: 120 kV; automatic tube current, 10 to 240 mA; section thickness, 5 mm; interlayer spacing, 5 mm; and scanning time, less than 5 seconds. Reconstruction was performed with a thickness of 1.25 mm.
2.3. Imaging analysis
The CT findings were evaluated by 3 radiologists (YJ, XJ, YF) who had ample experience in cardiothoracic radiology. Any disagreements between them were settled by consensus after discussion.
For each patient, demographic information, including age, sex, symptoms, comorbidities, contact history (travel to Wuhan, exposure to infected patients and unknown reasons) and laboratory examinations (C-reactive protein, white blood cell count and lymphocyte count), was collected. The following CT imaging features were included: the number of lungs and lobes involved; the appearance of each lesion, including pure ground-glass opacity (GGO; defined as hazy increased lung attenuation with no obscuration of the underlying bronchial or vessels), GGO with interstitial or interlobular septal thickening or reticulation, GGO with consolidation (defined as opacification obscuring the underlying vessels), and consolidation; the predominant distribution of lesions, including peripheral (defined as outer one-third of the peripheral zone of both lungs), central (adjacent to the peripheral area) or both; bronchiectasis; air bronchogram; pleural effusion and lymphadenopathy (lymph node size larger than 10 mm in short-axis dimension). The largest short-axis lesion was measured in the vertical pleural direction.
Every lesion was identified by the readers. For example, a lobe containing a lesion was counted as one lesion, a lobe containing 3 lesions separately was counted as three lesions, while a diffuse lesion involving 2 lobes or 3 lobes was counted as 2 lesions or 3 lesions, respectively.
For patients with negative first RT-PCR results, CT was performed after they tested positive after one or more RT-PCR tests. The data were collected as follows: the appearance of each lesion as mentioned above; the largest short-axis of the lesions; and the change in the consolidation component and the GGO component.
2.4. Statistical analysis
All data were analyzed using IBM SPSS statistics software (version 24; IBM company, NY). Continuous variables are expressed as the mean ± the standard deviation or median (25%–75%), according to their distribution, and counting variables are presented as frequencies (percentages). The clinical and CT imaging findings were compared between patients with a negative first RT-PCR test and those with a positive first RT-PCR test by using Student's t test or the Mann-Whitney U test for quantitative variables and Fisher exact test or the χ2 test for qualitative data. A paired t-test was used between follow-up patients. A P value of < .05 was considered statistically significant.
3. Results
A total of 33 patients with 216 lesions were included, including 21 patients with a positive first RT-PCR test with 128 lesions and 12 patients with a negative first RT-PCR test with 88 lesions. Moreover, 11 patients with a negative RT-PCR test had follow-up chest CT data, including 80 lesions. The median time from the first negative result to the first positive result was 2 days, and the average number of days was 2.7 days, ranging from 1 to 6 days. The median number of RT-PCR tests was 2 times, and the average number was 2.6 times, ranging from 2 to 6 times. The average time interval from the onset of symptoms to the performance of lung CT was 3.12 days in all patients, 3.19 days in the positive first RT-PCR test group and 3 days in the negative first RT-PCR test group.
3.1. Comparison of clinical information between patients with a negative first RT-PCR test and those with a positive first RT-PCR test
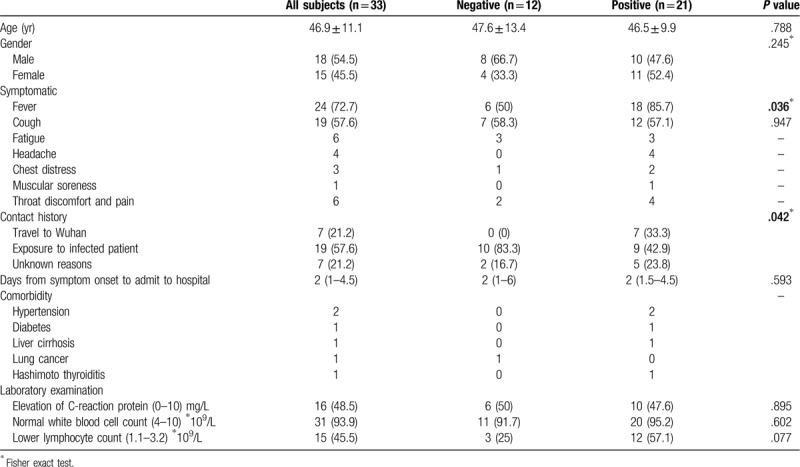
The demographic and clinical information are summarized in Table 1. The average age of the whole study group was 46.9 ± 11.1 years old, the median age was 46 years old, and males were slightly more predominant than females. No significant difference was found in sex or age between the two groups (P > .05). Regarding symptoms, patients in the positive RT-PCR test group were more likely to have a fever than patients in the negative RT-PCR test group (85.7% vs 50%); the difference was significant (P < .05). Other symptoms included cough (n = 19), fatigue (n = 6), headache (n = 4), chest distress (n = 3), muscle soreness (n = 1), and throat discomfort and pain (n = 6). Regarding contact history, 33.3% of patients in the positive group had been to Wuhan recently, while none of the patients in the negative group had traveled to Wuhan, and most of the patients (83.3%) in the negative group were exposed to infected patients; the difference between them was significant (P < .05). In terms of comorbidity, only 5 patients had comorbidities, such as hypertension, diabetes, and liver cirrhosis. In laboratory examinations, nearly half (48.5%) of patients had elevated C-reactive protein levels, and 93.9% of all patients had normal white blood cell counts. There was no significant difference between the two groups.
Table 1.
Baseline demographic and clinical characteristics of 33 patients with COVID-19.
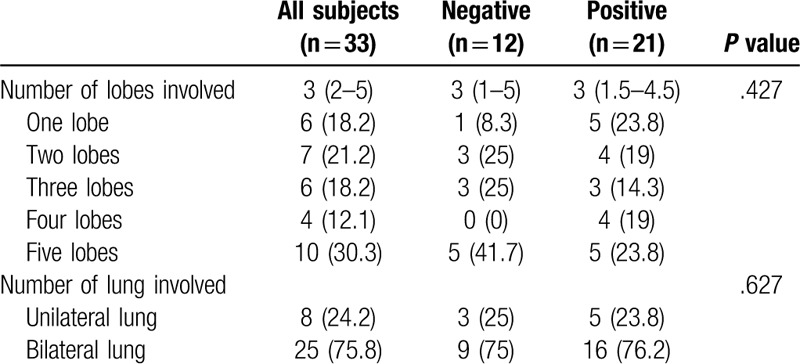
For the number of lobes involved in 33 patients, the median number of lobes involved was 3 (P > .05). In the negative group, 41.7% of patients had 5 lobes involved, and only 8.3% of patients had one lobe involved, while in the positive group, a similar proportion was seen in each lobe. Nearly 75% of patients had bilateral lung involvement. (Table 2)
Table 2.
Baseline CT imaging characteristics of 33 patients with COVID-19.
3.2. Comparison of CT imaging features for each lesion between patients with a negative first RT-PCR test and those with a positive first RT-PCR test
The imaging characteristics are summarized in Table 3. There was no significant difference between the two groups in the largest short axis of the lesion (P > .05). In the negative group, the right superior lobe (26.1%) and right inferior lobe (27.3%) were the most commonly involved lobes, while the right inferior lobe (32%) and left inferior lobe were the most frequently involved lobes in the positive group (P < .05). Lesions in the positive group were more likely to be located in the peripheral area than lesions in the negative group (83.6% vs 68.2%), and the difference between them was significant (P< .05). Regarding the appearance of each lesion, GGO with consolidation (43.2%) was the most common appearance in the negative group, followed by pure GGO (31.8%), while in the positive group, pure GGO (32%) and GGO with interlobular septal thickening (32.8%) were most frequent, and the difference between them was evident (P < .05). Bronchiectasis was more common in the positive test group than in the negative test group (54.7% vs 17%, P < .05), while air bronchogram was more often shown in the negative group (28.4% vs 9.4%, P < 0.05). (Figs. 1–3)
Table 3.
CT imaging characteristics of 216 lesions from COVID-19 patients.
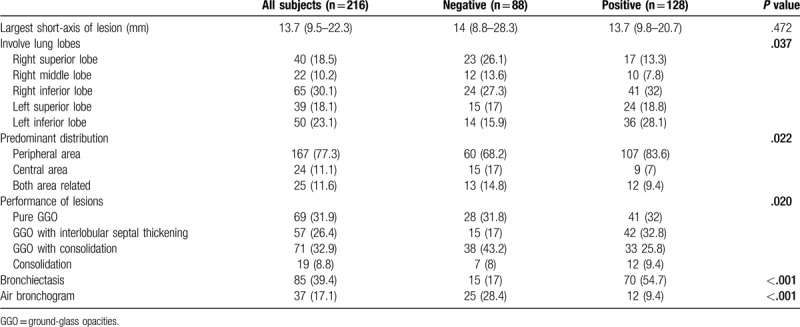
Figure 1.
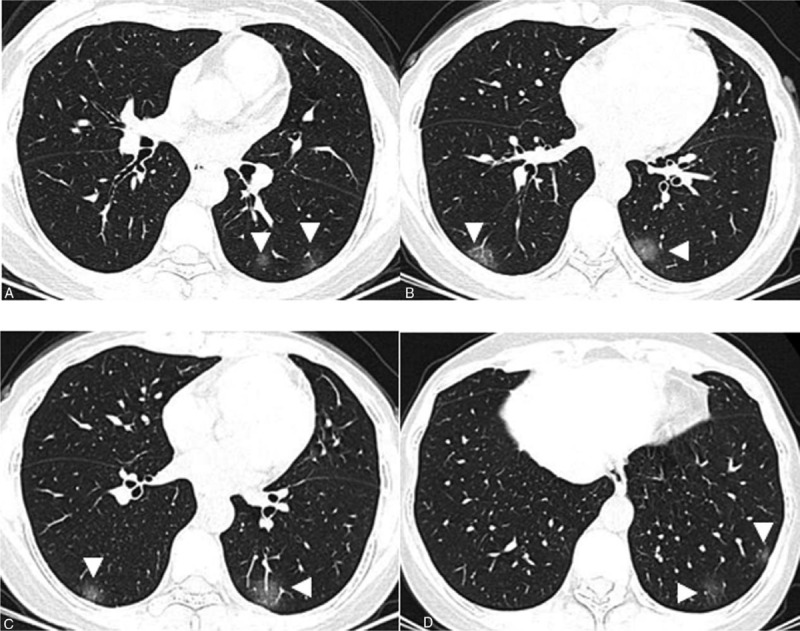
A–D. Chest CT images of a 43-year-old female, presenting multiple patchy areas of pure ground-glass opacities (GGOs) (white arrowhead). These abnormalities are all distributed in the posterior and peripheral parts of both lungs.
Figure 3.
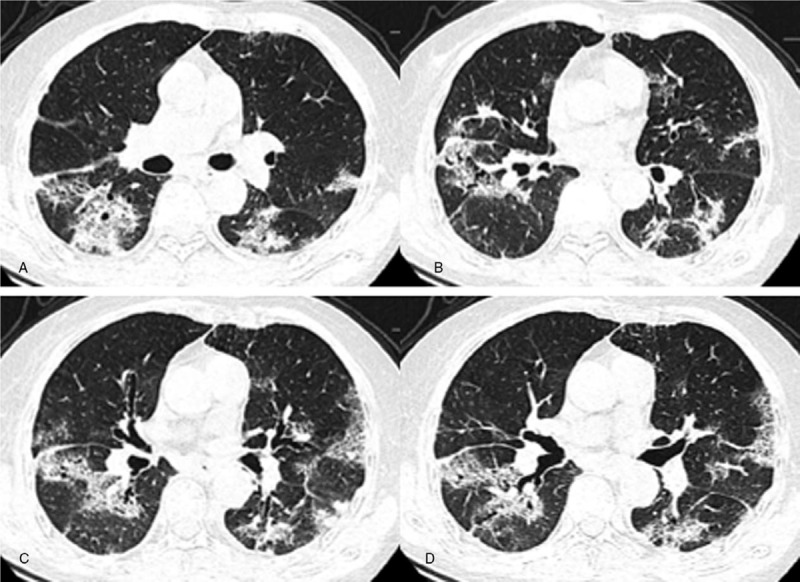
A–D. Chest CT images of an 89-year-old female, presenting multiple patchy and segmental areas of GGOs with interlobular septal thickening, GGOs with consolidation and consolidation in both lungs. Lesions are located in both the peripheral and the central area. Bronchiectasis and air bronchogram are present.
Figure 2.
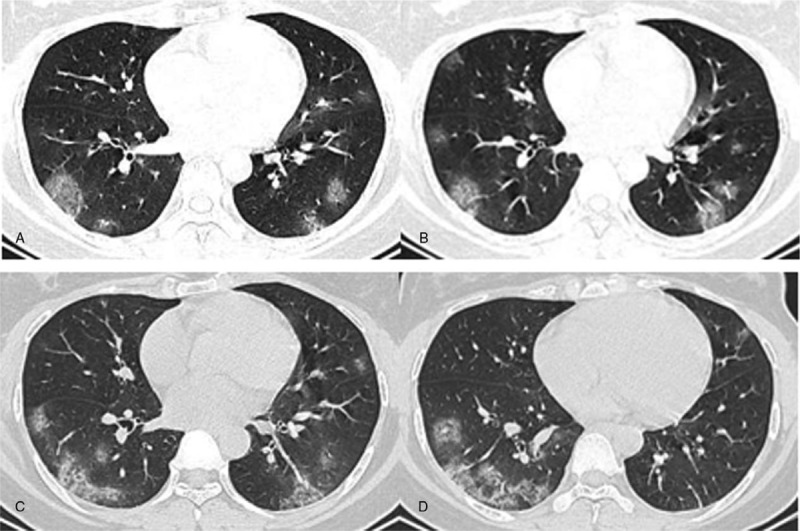
A–D. Chest CT images of a 31-year-old female, presenting multiple patchy areas of pure GGOs and GGOs with interlobular septal thickening in both lungs. These lesions are mostly located in the peripheral area.
3.3. Follow-up evaluation in patients with a negative first RT-PCR test
Eighty lesions in the negative group had CT follow-up information (Table 4). The average time interval between first and follow-up CT was 3.6 days, ranging from 2 days to 10 days. Forty-three of the lesions (63.8%) improved upon follow-up, and 29 of them (36.3%) progressed while the remaining lesions (10%) remained the same. The largest short-axis of a lesion was smaller upon follow-up (median size 13.6 mm vs 14 mm), albeit by a small margin. For lesions that improved upon follow-up, the average decrease in size was 3.4 ± 4.2 mm, ranging from 0.1 mm to 24.5 mm. For lesions that worsened upon follow-up, the average increase in size was 3.5 ± 3.8 mm, ranging from 0.1 mm to 18 mm. The appearance of each lesion also changed significantly (P < .05). Overall, pure GGOs decreased in frequency, from 31.3% to 21.3%, while consolidation increased in frequency, from 7.5% to 12.5% and from 45% to 47.5%. In terms of lesions, the consolidation component decreased in 33 patients (41.3%), increased in 28 patients (35%), and remained the same in 19 patients (23.8%). Similarly, the GGO component decreased in 46 patients (57.5%), increased in 23 patients (28.8%), and remained the same in 11 patients (13.8%). (Fig. 4A–D)
Table 4.
Baseline demographic and clinical characteristics of 11 patients (80 lesions) with a negative first RT-PCR test.

Figure 4.
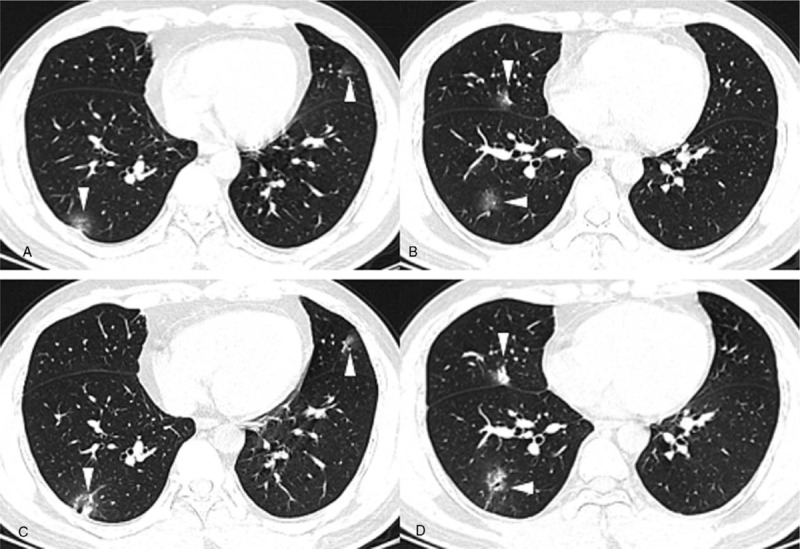
A-B. Baseline chest CT images of a 35-year-old male with a negative first RT-PCR test, presenting multiple patchy areas of pure GGOs and GGOs with interlobular septal thickening in both lungs. C-D. Two days after baseline chest CT, when he had his first positive RT-PCR test, CT images showed that the consolidation component had increased (white arrowhead).
4. Discussion
Chest CT is of paramount importance in the diagnosis of COVID-19 caused by SARS-CoV-2 infection. Notwithstanding, diagnosis cannot be based upon CT features alone, and RT-PCR is the gold standard for the diagnosis of SARS-CoV-2 infection.[8] However, in clinical practice, many patients present with a negative first RT-PCR test even though they have typical lung manifestations and a highly suspected contact history. Thus, we aimed to determine the differences in chest CT imaging features and clinical characteristics between patients with a negative first RT-PCR test and those with a positive first RT-PCR test.
The greatest strength of our study was that we evaluated each lesion rather than just patients based on imaging features and we compared features between our 2 groups. Wang Dawei et al[9] showed that bilateral patchy shadows or GGOs in the lungs were found in all 138 patients. Chung Michael et al[10] included only 21 patients, and they found that 71% of them had more than two lobes involved. This result was similar to that of our study; we found that 30.3% of all patients had five lobes involved. In their study, 57% of patients presented with GGOs, and 33% of them presented with GGOs with rounded morphologies, but only 33% of them were found to have a peripheral distribution.[10] However, in our study, we found 77.3% of all lesions were located in the peripheral area, and 83.6% of lesions in patients with a positive first RT-PCR test were located in that area. A peripheral area distribution was typical in up to 85% of lesions.[5] Pan Yueying et al[11] included 63 patients and found that 44.4% of them had 5 lobes involved, which was similar to our result. Song Fengxiang et al[5] included 51 patients with 1324 lesions and found that 30% of lesions were pure GGOs, 39% were GGOs with interlobular septal thickening, 18% were GGOs with consolidation, and 13% were consolidation lesions. In our study, we found that GGOs with consolidation (43.2%) and pure GGOs (31.8%) were the most common lesion appearances in patients in the negative RT-PCR test group, while pure GGOs (32%) and GGOs with interlobular septal thickening (32.8%) were most frequent appearances in patients in the positive RT-PCR test group. Pleural effusions and lymphadenopathy were absent in most of the patients, which was similar to our study.[5,10]
Patients can present diverse chest CT results, and imaging changes in COVID-19 are very rapid, which may be affected by immune status. Lesions can be absorbed after proper treatment.[12] In this study, we found that GGOs tended to be absorbed or transfer to consolidation. In regard to lesions, the consolidation component decreased in 41.3% of patients, increased in 35%, and remained the same in 23.8%. The GGO component decreased in 57.5% of patients, increased in 28.8%, and remained the same in 13.8%. Pan Feng et al[13] showed that lung involvement progressed to consolidation up to 2 weeks after disease onset, and then lesions were absorbed stage by stage, leaving widespread GGOs and subpleural parenchymal bands. However, Song Fengxiang et al[5] found that the consolidation component was greater within an interval of > 4 days after symptom onset.
Epidemiologically speaking, a negative RT-PCR test seemed likely in patients who had not travelled to Wuhan recently, a city considered an outbreak source of SARS-CoV-2 infection, possibly related to the Huanan Seafood Wholesale Market.[14] Patients exposed directly to Wuhan may carry higher virus titers than patients exposed only to infected patients. COVID-19 tended to occur in patients in their 40 to 50 seconds, both in our study and in others. A large population study analyzed 425 patients with confirmed COVID-19; their median age was 59 years, and 56% of them were male, which was similar to our results.[15] Fever and cough were the most common symptoms in patients, while fever was even more common in patients in the positive RT-PCR group. A study including 138 hospitalized patients found that fever (98.6%), fatigue (69.6%) and dry cough (59.4%) were common symptoms, and 46.4% of the patients had one or more coexisting medical conditions, which was much higher than the proportion in our study, possibly because our patients were much younger (46 vs 56 years old).[9]
Most of our patients had more than one lung lobe involved, and 75.8% of had bilateral lung involvement, while in patents with SARS, unifocal involvement was more frequent than multifocal or bilateral involvement.[16] COVID-19 sometimes has manifestations similar to those of MERS pneumonia, with both appearing as subpleural lesions with extensive GGOs and consolidation. A history of close exposure may differentiate COVID-19 and MERS.[16,17]
There are several limitations in our study. This was a retrospective study with inevitable bias. Only 33 patients were included, and the sample was relatively small, although we included a larger sample of patients with a negative first RT-PCR test than other studies.[6] Some detailed patient information, such as treatment method and patient outcomes, was unavailable in our study.
In conclusion, the manifestations of COVID-19 in patients with a negative first RT-PCR test and patients with a positive first RT-PCR test were different. Lesions in the positive group were more likely to be pure GGOs and GGOs with interlobular septa, with peripheral distribution, while lesions in the negative group were pure GGOs and GGOs with consolidation. After follow-up, the GGO component decreased and the consolidation component increased.
Author contributions
Zu-Hua Chen has finished original manuscript.
Yun-Jiang Li coped with data and did statistical analysis.
Xiu-Juan Wang, Yun-Feng Ye and Bao-Liang Wu have collected patients data and analysis CT images.
Yan Zhang and Wei-Ling Xuan have collected clinical data and did follow-up researches.
Jian-Feng Bao have verified the final results.
Xueying Deng designed and managed this study, and modified final manuscript.
All authors did literature research.
Footnotes
Abbreviations: GGO = ground-glass opacity, MERS-CoV = Middle East respiratory syndrome coronavirus, RT-PCR = reverse-transcription-polymerase chain-reaction, SARS-CoV = severe acute respiratory syndrome coronavirus.
How to cite this article: Chen ZH, Li YJ, Wang XJ, Ye YF, Wu BL, Zhang Y, Xuan WL, Bao JF, Deng XY. Chest CT of COVID-19 in patients with a negative first RT-PCR test: comparison with patients with a positive first RT-PCR test. Medicine. 2020;99:26(e20837).
The authors have no funding and conflicts of interest to disclose.
All data generated or analyzed during this study are included in this published article [and its supplementary information files].
References
- [1].Zhu N, Zhang D, Wang W, et al. A Novel Coronavirus from Patients with Pneumonia in China, 2019. N Engl J Med 2020;382:727–33. [DOI] [PMC free article] [PubMed] [Google Scholar]
- [2].Coronavirus disease 2019 (COVID-19) Situation Report. Geneva: World Health Organization, 16 April, 2020, https://covid19whoint/. Accessed 16 April 2020. [Google Scholar]
- [3].Cui J, Li F, Shi Z-L. Origin and evolution of pathogenic coronaviruses. Nat Rev Microbiol 2018;17:181–92. [DOI] [PMC free article] [PubMed] [Google Scholar]
- [4].Chen N, Zhou M, Dong X, et al. Epidemiological and clinical characteristics of 99 cases of 2019 novel coronavirus pneumonia in Wuhan, China: a descriptive study. Lancet 2020;395:507–13. [DOI] [PMC free article] [PubMed] [Google Scholar]
- [5].Song F, Shi N, Shan F, et al. Emerging coronavirus 2019-nCoV pneumonia. Radiology 2020;295:210–7. [DOI] [PMC free article] [PubMed] [Google Scholar]
- [6].Xie X, Zhong Z, Zhao W, et al. Chest CT for Typical 2019-nCoV Pneumonia: Relationship to Negative RT-PCR Testing. Radiology 2020;200343.doi: 10.1148/radiol.2020200343. [DOI] [PMC free article] [PubMed] [Google Scholar]
- [7].Coronavirus disease 2019 (COVID-19) Situation Report - 24. Geneva: World Health Organization, 13 February 2020, https://wwwwhoint/docs/default-source/coronaviruse/situation-reports/20200213-sitrep-24-covid-19pdf?sfvrsn=9a7406a4_4. Accessed 14 February 2020. [Google Scholar]
- [8].China National Health Commission. Diagnosis and treatment of pneumonitis caused by new coronavirus (trial version 5). Beijing: China National Health Commission, 2020 http://wwwnhcgovcn/xcs/fkdt/202002/e84bd30142ab4d8982326326e4db22eashtml. Accessed 5 February 2020. [Google Scholar]
- [9].Wang D, Hu B, Hu C, et al. Clinical characteristics of 138 hospitalized patients with 2019 novel coronavirus–infected pneumonia inWuhan, China. JAMA 2020;323:1061–9. [DOI] [PMC free article] [PubMed] [Google Scholar]
- [10].Chung M, Bernheim A, Mei X, et al. CT Imaging Features of 2019 Novel Coronavirus (2019-nCoV). Radiology 2020;295:202–7. [DOI] [PMC free article] [PubMed] [Google Scholar]
- [11].Pan Y, Guan H, Zhou S, et al. Initial CT findings and temporal changes in patients with the novel coronavirus pneumonia (2019-nCoV): a study of 63 patients in Wuhan, China. Eur Radiol 2020;30:3306–9. [DOI] [PMC free article] [PubMed] [Google Scholar]
- [12].Duan YN, Qin J. Pre- and posttreatment chest CT findings: 2019 novel coronavirus (2019-nCoV) pneumonia. Radiology 2020;295:21. [DOI] [PMC free article] [PubMed] [Google Scholar]
- [13].Pan F, Ye T, Sun P, et al. Time course of lung changes on chest CT during recovery from 2019 novel coronavirus (COVID-19) pneumonia. Radiology 2020;295:715–21. [DOI] [PMC free article] [PubMed] [Google Scholar]
- [14].Munster VJ, Koopmans M, van Doremalen N, et al. A novel coronavirus emerging in China - key questions for impact assessment. N Engl J Med 2020;382:692–4. [DOI] [PubMed] [Google Scholar]
- [15].Li Q, Guan X, Wu P, et al. Early transmission dynamics in Wuhan, China, of novel coronavirus-infected pneumonia. N Engl J Med 2020;382:1199–207. [DOI] [PMC free article] [PubMed] [Google Scholar]
- [16].Koo HJ, Lim S, Choe J, et al. Radiographic and CT features of viral pneumonia. RadioGraphics 2018;38:719–39. [DOI] [PubMed] [Google Scholar]
- [17].Kanne JP. Chest CT findings in 2019 novel coronavirus (2019-nCoV) infections from Wuhan, China: Key points for the radiologist. Radiology 2010;295:16–7. [DOI] [PMC free article] [PubMed] [Google Scholar]


