Abstract
The aim of this study was to investigate the changes of retinal vessel density (VD) and choriocapillary blood flow area (CBFA) in macula after an acute intraocular pressure (IOP) elevation observed using optical coherence tomography angiography.
This was a prospective comparative study of subjects with narrow anterior chamber angles who underwent laser peripheral iridotomies (LPIs). The IOP was measured before and 1 hour after the LPI. The retinal VDs and CBFAs of the macula were measured using optical coherence tomography angiography at the baseline and 1 hour after the LPI.
A total of 88 eyes of 88 individuals were enrolled in our study, and 70 eyes of 70 individuals finally completed the study with a mean IOP rise of 10.2 ± 7.5 mm Hg after the LPI. The VDs and areas of foveal avascular zone of all of the subjects did not differ significantly between the measurements obtained at the baseline and 1 hour after the LPI (P > .05). However, there were statistically significant differences in the CBFAs at the baseline and 1 hour after the LPI (P < .05). Based on the magnitude of the rise in the IOP, we divided the subjects into three groups: group A = IOP rise ≤ 10 mm Hg, group B = 10 mm Hg < IOP rise ≤20 mm Hg, and group C = IOP rise > 20 mmHg. The VDs of the macula measured at the baseline were significantly different from the measurements obtained 1 hour after the LPI in group C in either the superficial retinal layer or deep retinal layer (P < .05). Compared with baseline, the CBFAs measured at 1 hour after the LPI were decreased in group B and group C (P < .05).
In these subjects with narrow antenior chamber, the blood flow in macula began to be affected with the acute IOP rise greater than 10 mm Hg. It was confirmed that the retina and choroid showed some different ability to regulate its blood flow in response to changes in IOP.
Keywords: choriocapillary blood flow, intraocular pressure, optical coherence tomography angiography, vessel density
1. Introduction
Glaucoma is 1 of the most common irreversible blinding diseases in the world. Although its pathogenesis has not been fully elucidated, intraocular pressure (IOP) rise is the most important factor contributing to glaucomatous damage.[1] Mechanical compression associated with IOP elevation and disturbance of ocular blood circulation are the 2 main causes of glaucomatous injury.[2,3] Studies[4–6] found that macular and papillary microvasculature reduced in the eyes with glaucoma, but it remains to be determined whether these changes were directly result of IOP-elevating.
The blood supply in front of the lamina cribrosa in the optic nerve head mainly comes from the choroid of which thickness is considered to be 1 of the causes of primary angle closure glaucoma.[7,8] Consequently, the relationship between glaucoma and choroid has been widely concerned.[9] In the early research, the choroidal abnormalities of glaucoma patients were studied by histological methods in vitro.[10] While the measurement of choroid in vitro can not show the real situation in vivo due to the influence of perfusion pressure and a variety of vasoactive substances in choroidal vessels.[10]
With the development of technology, OCT angiography (OCTA) based on split-spectrum amplitude-decorrelation angiography has been widely used in ophthalmology and it can accurately measure the blood flow of retinal and choroidal capillaries in only a few seconds. The stability and repeatability of using OCTA to measure the retinal blood flow have been widely demonstrated.[11–13]
In this study, we used OCTA to assess whether there were changes in the retinal vessel densities and choroidal capillary blood flow areas of macular region in patients with an acute IOP rise after undergoing a laser peripheral iridotomy (LPI).
2. Methods and materials
2.1. Participants
A consecutive series of patients with narrow anterior chamber angles who underwent LPIs and exhibited IOP elevations afterwards were prospectively recruited from September 2018 to June 2019, at the First People's Hospital of Huzhou, Zhejiang Province, China. All participants underwent comprehensive ophthalmic examinations, which included assessments of best-corrected visual acuity, non contact IOP measurement, ultrasound biomicroscopy, a refraction test, slit-lamp biomicroscopy, gonioscopy, fundus examination. The Ethical Review Committee of the First People's Hospital of Huzhou approved the study and confirmed its adherence to the provisions of the Declaration of Helsinki for research involving human subjects.
The inclusion criteria were eyes with narrow anterior chamber angles without occlusion, IOP ≤21 mm Hg at the baseline, transparent refractive media, no medication, no retinal diseases, no optic nerve diseases, no diabetes, no ocular trauma, and OCTA images of sufficient quality (a signal strength index higher than 55 and accurate retinal stratification).
2.2. Methods of operation and examination
The device used to perform the LPIs was an Nd: YAG laser (Ellex Medical, Adelaide, South Australia) with the following parameters: wavelength = 1,064 nm, energy = 6–12 MJ, and spot diameter = 30 um. Preoperatively, proparacaine hydrochloride eye drops were given once for the topical anesthesia, and an Abraham contact lens was placed in the conjunctival sac. An upper temporal or upper nasal iris treatment site was selected, the single pulse mode was used, and the slit lamp brightness was increased to shrink the pupil. After the LPI, tobramycin and dexamethasone eye drops were applied three times (once every 10 minutes), and then four times a day for 1 week.
At the baseline and 1 hour after the LPI, the IOP was measured using noncontact tonometry (CT-60; Topcon Ltd., Tokyo, Japan). All of the IOP measurements were taken three times, and the mean value of the three measurements was used for the statistical analysis. Shortly after measuring the IOP, the vasculature of the macula was visualized using OCTA. If the IOP was greater than 30 mm Hg, it was decreased with medication immediately following the examination.
The RTVue XR OCTA system (ReVue software, version 2017.1.1.155; Optovue Inc., Fremont, CA) with the Angio Retina mode (6 × 6 mm) was used to measure macular blood flow. In order to evaluate the capillary blood flow of retina and choroid in macular region, we measured the vessel density (VD) of the superficial retinal layer, which extended from approximately 3 μm below the inner limiting membrane to 15 μm below the inner plexiform layer, the VD of the deep retinal layer, which extended from 15 μm below the inner plexiform layer to 70 μm below the inner plexiform layer, and the choriocapillary blood flow area (CBFA) of the choroidal capillary layer, which extended from approximately 30 μm to 60 μm below the retinal pigment epithelium (Fig. 1). The CBFA of the circular area with a diameter of 1.5 mm in the macula was selected for data analysis. In addition, we measured the area of foveal avascular zone (FAZ) automatically at the baseline and 1 hour after LPI.
Figure 1.

Optical coherence tomography angiography image of the macular region from superficial retinal layer to choroidal capillary layer.
3. Statistical analysis
The statistical analysis was performed using the Statistical Package for the Social Sciences (version 17; SPSS Inc., Chicago, IL). The measurements taken at the baseline and after the LPI were compared using the paired Student t test. Pearson correlation analysis was used to analyze the correlation between IOP elevation and changes of CBFA, FAZ. All of the measurements were described as the mean ± standard error. A P value of less than .05 was considered to be statistically significant.
4. Results
A total of 88 eyes of 88 individuals were enrolled in our study, of which 18 eyes of 18 individuals were excluded due to offset deviations or poor imaging signals (signal strength index lower than 55). Signal strength index pre and post LPI was no statistical difference. Finally, 70 eyes completed our study, including 27 males (27 eyes) and 43 females (43 eyes), with a mean age of 58.2 ± 5.1 years old (range = 48–74 years). The IOP rose from 15.0 ± 4.2 mm Hg to 25.3 ± 10.1 mm Hg, with a mean rise of 10.2 ± 7.5 mm Hg.
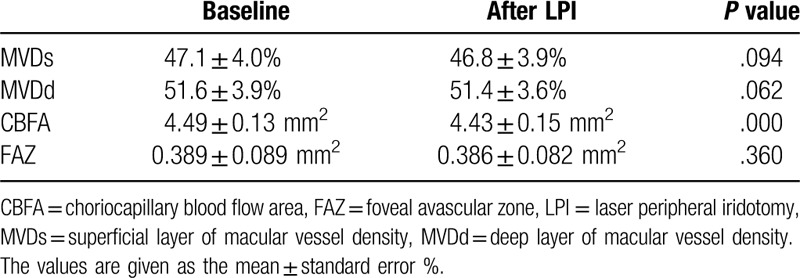
The VDs and areas of FAZ of all of the subjects did not differ significantly between the measurements obtained at the baseline and 1 hour after the LPI (superficial layer of macular VD [MVDs] = 47.1 ± 4.0% versus 46.8 ± 3.9%, P = .094; deep layer of macular VD [MVDd] = 51.6 ± 3.9% versus 51.4 ± 3.6%, P = .062; FAZ = 0.389 ± 0.089 mm2 versus 0.386 ± 0.082 mm2, P = .360). However, there were statistically significant differences in the C at the baseline and 1 hour after the LPI (CBFA = 4.49 ± 0.13 mm2 versus 4.43 ± 0.15 mm2, P = .000 (Table 1).
Table 1.
The retinal vessel densities, choriocapillary blood flow areas and foveal avascular zone in macular region at the baseline and one hour after the laser peripheral iridotomy (LPI) in all of the study subjects.

According to the magnitude of rise in the IOP, we divided the subjects into three groups: group A = IOP rise ≤10 mm Hg, group B = 10 mm Hg < IOP rise ≤ 20 mmHg, and group C = IOP rise > 20 mm Hg. There were 35 eyes in group A, with a mean IOP rise of 4.0 ± 1.6 mm Hg, there were 22 eyes in group B, with a mean IOP rise of 12.7 ± 2.8 mm Hg, and there were 13 eyes in group C, with a mean IOP rise of 23.0 ± 2.7 mm Hg (Table 2). Except for the IOP, there was no difference in age and sex composition among the 3 groups. (Table 2)
Table 2.
General information from the 3 patient groups (group A = IOP increase ≤10 mm Hg, group B = 10 mm Hg < IOP increase ≤ 20 mm Hg, and group C = IOP increase > 20 mm Hg).

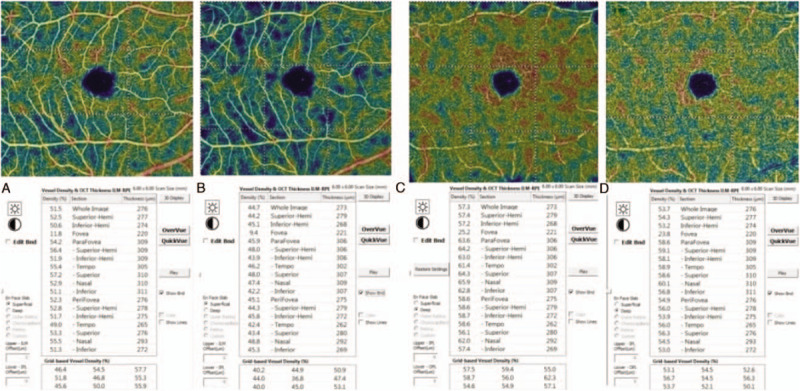
The MVD measured at the baseline were not significantly different from the measurements obtained 1 hour after the LPI in group A or group B in either the superficial retinal layer or deep retinal layer (MVDs = 45.2 ± 4.6% versus 45.3 ± 4.4%, p = 0.504 and 49.2 ± 1.9% versus 49.1 ± 2.1%, P = .812, respectively; MVDd = 50.1 ± 4.3% versus 50.3 ± 4.0%, P = .367 and 53.9 ± 2.9% versus 53.6 ± 2.4%, P = .146, respectively). However, there were significant differences between the values in group C (MVDs = 49.0 ± 2.1% versus 46.8 ± 3.0%, p = 0.009; MVDd = 52.0 ± 2.6% versus 50.7 ± 2.9%, P = .008) (Table 3, Fig. 2).
Table 3.
The vessel density of the macular region (MVD) at the baseline and one hour after the laser peripheral iridotomy (LPI) in the three patient groups (group A = IOP increase ≤10 mm Hg, group B = 10 mm Hg < IOP increase ≤20 mm Hg, and group C = IOP increase > 20 mm Hg).

Figure 2.

Images of the vessel densities measured before and one hour after the laser peripheral iridotomy (LPI). A: Measurements of the superficial retinal layer at the baseline; B: Measurements of the superficial retinal layer at one hour after LPI; C: Measurements of the deep retinal layer at the baseline; D: Measurements of the deep retinal layer at 1 h after the LPI.
The CBFA that measured at the baseline and 1 hour after the LPI were no statistically significant difference in group A (CBFA
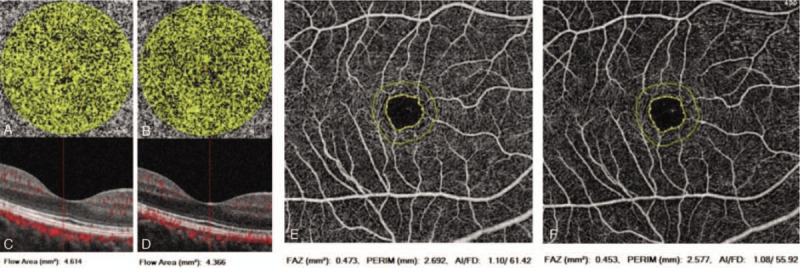
= 4.47 ± 0.16 mm2 versus 4.46 ± 0.14 mm2, P = .563), but there were significant differences in group B and group C (CBFA = 4.49 ± 0.12 mm2 versus 4.42 ± 0.14 mm2, P = .005 and 4.53 ± 0.09 mm2 versus 4.34 ± 0.16 mm2, P = .001, respectively) (Table 4, Fig. 3). The FAZ measurements taken at the baseline and 1 hour after the LPI didn’t differ in the 3 groups (FAZ = 0.388 ± 0.087 mm2 versus 0.384 ± 0.081 mm2, P = .388; 0.384 ± 0.095 mm2 versus0.378 ± 0.081 mm2, P = .416; 0.404 ± 0.092 mm2 versus0.408 ± 0.088 mm2P = .526) (Table 4, Fig. 3).
Table 4.
The areas of choriocapillary blood flow and foveal avascular zone of the macular region at the baseline and one hour after the laser peripheral iridotomy (LPI) in the 3 patient groups (group A = IOP increase ≤ 10 mmHg, group B = 10 mm Hg < IOP increase ≤ 20 mm Hg, and group C = IOP increase > 20 mm Hg).

Figure 3.

Images of areas of choriocapillary blood flow and foveal avascular zone. A) Preoperative image of the choriocapillary blood flow area; B) Postoperative image of the choriocapillary blood flow area; C, D): The corresponding B-scan images of A, B. E: Preoperative image of the foveal avascular zone; F) Postoperative image of foveal avascular zone.
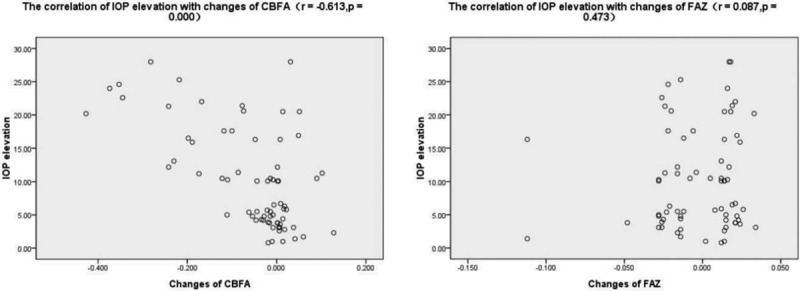
The pearson correlation analysis showed that there was a significant negative correlation between IOP elevation and changes of CBFA (r = -0.613, P = .000), and there was no correlation between IOP elevation and changes of FAZ (r = 0.087, P = .473) (Fig. 4).
Figure 4.

Images of the correlation of intraocular pressure (IOP) elevation with changes of choriocapillary blood flow (CBFA) and foveal avascular zone (FAZ).
5. Discussion
The results of our study suggest that either the retinal VD or the choroidal capillary blood flow in macula as measured by OCTA in these patients with narrow antenior chamber did not change markedly while acute IOP increased less than 10 mmhg after LPI, but when the IOP rise was more than 10 mm Hg the choroidal capillary blood flow decreased significantly, once the IOP elevation was more than 20 mm Hg the retinal VD also significantly reduced. In addition, the data supports the hypothesis that microcirculation in macular region has autoregulatory capacity during changes in IOP within a certain range.[3,14]
It has been shown that reducing the IOP increases the ocular perfusion pressure, which enhances ocular blood flow. Recent studies using OCTA have demonstrated a reduced retinal blood flow in glaucoma cases compared to control cases[5,6,15] and an improved retinal microvasculature after IOP lowering in glaucomatous eyes.[16,17] However, it is not clear whether an acute elevated IOP has an immediate effect on retinal and choroidal blood flow. To our knowledge, there are few researches in this field at present. Animal experiments have shown that with a sharp increase in the IOP, the retinal blood flow decreases significantly.[18,19] However, Zhang et al found that healthy eyes with acute and physiological IOP elevations of 10 mm Hg or 15 mm Hg for 2 hours did not show significant changes in the capillary VD in either the ONH or macula, as examined using OCTA.[20] Our findings indicate that the autoregulatory mechanisms of microcirculation of retina and choroid in macula would be destroyed once IOP is elevated to a critical level, especially in choroidal capillaries. Compared with retinal blood flow in macula, perhaps choroidal capillaries have a worse autoregulatory on the change of IOP, which is in good agreement with findings of Polska et al,[21] whose study indicated that the choroid regulated its blood flow worse during changes in IOP. Our results may be relevant with regard to the discussion of ocular blood flow in glaucoma and important in linking the pressure theory with the vascular theory of glaucoma etiology.
Although the damage caused by glaucoma at the retinal level is mainly manifested in the inner layer of the retina, such as the thinning of the retinal nerve fiber layer and the loss of ganglion cells, studies have found that the outer layer of the retina in glaucoma patients is also affected, such as the edema and loss of photoreceptor cells, which may be due to the decrease of choroidal blood flow ischemia in glaucoma patients.[22] According to our study, CCFA in macula decreased with the increase of IOP more than 10 mmHg. However, the result is in different with the fingings of animal experiment by Zhi et al,[23] who showed choroidal perfusion in optic nerve head did not appear to be affected until 60 mm Hg in rats using optical microangiography, above which further reductions developed exponentially. It should be noted that the results of this study are only obtained in animal experiments, it is necessary to carry out further studies in human body. Additionally, our study is needed to elucidate whether our findings may also be true for optic nerve head blood flow. Besides, our research demonstrated that there was no significant change in FAZ before and after LPI, which may be attributed to the short time and limited range of IOP rise.
Several limitations should be addressed. First, the study included only patients with narrow anterior chamber angles, and we do not know whether the results can be generalized to any other individuals. Second, the VD and CCFA observed by OCTA is not exactly equal to blood flow, while blood flow is slightly damaged, OCTA may not be able to detect it. Third, whether blood flow in other parts of the retina and choroid reacts in a similar way remains unknown. Fourth, the limited number of samples in this study, especially in the cases with IOP increases greater than 20 mm Hg after the LPI, may have had an impact on the outcomes. Further work should be applied.
In conclusion, the present study demonstrated that the macular blood flow in these subjects with narrow antenior chamber began to be affected with the acute IOP rise greater than 10 mm Hg. It was confirmed that the retina and choroid showed some different ability to regulate its blood flow in response to changes in IOP. Compared to the retina, the choroid has a poor regulatory ability.
Author contributions
Ziwei Ma carried out the entire procedure, including research design, data collection, data analysis, manuscript writing and submission. Hong Chen and Xuefeng Pan participated in the design of the study. Danni Zhou, Zhuangzhi Zhu, Aiping Xu, Peng Shi assisted with the acquisition of the data. All authors reviewed and approved the final manuscript.
Footnotes
Abbreviations: CBFA = choriocapillary blood flow area, FAZ = foveal avascular zone, IOP = intraocular pressure, LPI = laser peripheral iridotomy, MVDd = deep layer of macular vessel density, MVDs = superficial layer of macular vessel density, OCTA = optical coherence tomography angiography, VD = vessel density.
How to cite this article: Ma Z, Pan X, Zhou D, Zhu Z, Xu A, Shi P, Chen H. Changes of retinal and choroidal capillary blood flow in macula after an acute intraocular pressure elevation. Medicine. 2020;99:26(e21007).
This study was supported by Huzhou science and Technology Bureau, Zhejiang Province, China, (Item Number: 2018 GY06).
The patient has provided informed consent for publication of the case.
The authors have no conflicts of interest to disclose.
The datasets generated during and/or analyzed during the current study are not publicly available, but are available from the corresponding author on reasonable request.
References
- [1].Weinreb RN, Leung CK, Crowston JG, et al. Primary openangle glaucoma. Nat Rev Dis Primers 2016;2:16067. [DOI] [PubMed] [Google Scholar]
- [2].Miglior S, Bertuzzi F. Relationship between intraocular pressure and glaucoma onset and progression. Curt Opin Pharmacol 2013;13:32–5. [DOI] [PubMed] [Google Scholar]
- [3].Cherecheanu AP, Garhofer G, Schmidl D, et al. Ocular perfusion pressure and ocular blood flow in glaucoma. Curr Opin Pharmaeol 2013;13:36–42. [DOI] [PMC free article] [PubMed] [Google Scholar]
- [4].Wu J, Sebastian RT, Chu CJ, et al. Reduced macular vessel density and capillary perfusion in glaucoma detected using OCT angiography. Curr Eye Res 2018;44:533–40. [DOI] [PubMed] [Google Scholar]
- [5].Yarmohammadi A, Zangwill LM, Diniz-Filho A, et al. Optical coherence tomography angiography vessel density in healthy, glaucoma suspect, and glaucoma eyes. Invest Ophthalmol Vis Sci 2016;57:OCT451–9. [DOI] [PMC free article] [PubMed] [Google Scholar]
- [6].Mammo Z, Heisler M, Balaratnasingam C, et al. Quantitative optical coherence tomography angiography of radial peripapillary capillaries in glaucoma, glaucoma suspect and normal eyes. Am J Ophthalmol 2016;170:41–9. [DOI] [PubMed] [Google Scholar]
- [7].Hayreh SS. Blood flow in the optic nerve head and factors that may influence it. Prog Retin Eye Res 2001;20:595–624. [DOI] [PubMed] [Google Scholar]
- [8].Quigley HA. Angle-closure gaucoma-simpler answers to complex mechanisms: LXVI Edward Jackson Memorial Lecture. Am J Ophthalmol 2009;148:657–69. [DOI] [PubMed] [Google Scholar]
- [9].Rechtman E, Harris A. Choroidal blood flow regulation and possible implications to glaucoma. Clin Experiment Ophthalmol 2008;36:111–2. [DOI] [PubMed] [Google Scholar]
- [10].Spraul CW, Lang GE, Lang GK, et al. Morphometric changes of the choriocapillaris and the choroidal vasculature in eyes with advanced glancomatous changes. Vision Res 2002;42:923–32. [DOI] [PubMed] [Google Scholar]
- [11].Felipe F, Jason M, Fabiana Q, et al. Repeatability of split-spectrum amplitude- decorrelation angiography to assess capillary perfusion density within optical coherence tomography. Ophthalmic Surg Lasers Imaging Retina 2018;49:e9–19. [DOI] [PubMed] [Google Scholar]
- [12].Lei J, Pei C, Wen C, et al. Repeatability and reproducibility of quantification of superficial peripapillary capillaries by four different optical coherence tomography angiography devices. Sci Rep 2018;8:17866. [DOI] [PMC free article] [PubMed] [Google Scholar]
- [13].Mihailovic N, Brand C, Lahme L, et al. Repeatability, reproducibility and agreement of foveal avascular zone measurements using three different optical coherence tomography angiography devices. Plos One 2018;13:e0206045. [DOI] [PMC free article] [PubMed] [Google Scholar]
- [14].Guidoboni G, Harris A, Cassani S, et al. Intraocular pressure, blood pressure, and retinal blood flow autoregulation: a mathematical model to clarify their relationship and clinical relevance. Invest Ophthalmol Vis Sci 2014;55:4105–18. [DOI] [PMC free article] [PubMed] [Google Scholar]
- [15].Wu J, Sebastian RT, Chu CJ, et al. Reduced macular vessel density and capillary perfusion in glaucoma detected using OCT angiography. Curr Eye Res 2018;21:1563195. [DOI] [PubMed] [Google Scholar]
- [16].Shin JW, Sung KR, Uhm KB, et al. Peripapillary microvascular improvement and lamina cribrosa depth reduction after trabeculectomy in primary open-angle glaucoma. Invest Ophthalmol Vis Sci 2017;58:5993–9. [DOI] [PubMed] [Google Scholar]
- [17].Hollo G. Influence of large intraocular pressure reduction on peripapillary OCT vessel density in ocular hypertensive and glaucoma eyes. J Glaucoma 2017;26:e7–10. [DOI] [PubMed] [Google Scholar]
- [18].Zhi Z, Cepurna W, Johnson E, et al. Evaluation of the effect of elevated intraocular pressure and reduced ocular perfusion pressure on retinal capillary bed filling and total retinal blood flow in rats by OMAG/OCT. Microvasc Res 2015;101:86–95. [DOI] [PMC free article] [PubMed] [Google Scholar]
- [19].Shibata M, Sugiyama T, Kurimoto T, et al. Involvement of glial cells in the autoregulation of optic nerve head blood flow in rabbits. Invest Ophthalmol Vis Sci 2012;53:3726–32. [DOI] [PubMed] [Google Scholar]
- [20].Zhang Q, Jonas JB, Wang Q, et al. Optical coherence tomography angiography vessel density changes after acute intraocular pressure elevation. Sci Rep 2018;8:6024. [DOI] [PMC free article] [PubMed] [Google Scholar]
- [21].Polska E, Simader C, Weigert G, et al. Regulation of choroidal blood flow during combined changes in intraocular pressure and arterial blood pressure. Invest Ophthalmol Vis Sci 2007;48:3768–74. [DOI] [PubMed] [Google Scholar]
- [22].Nork TM, Ver Hoeve JN, Poulsen GL, et al. Swelling and loss of photoreceptors in chronic human and experimental glaucomas. Arch Ophthalmol 2000;118:235–45. [DOI] [PubMed] [Google Scholar]
- [23].Zhi Z, Cepurna WO, Johnson EC, et al. Impact of intraocular pressure on changes of blood flow in the retina, choroid, and optic nerve head in rats investigated by optical microangiography. Biomed Opt Express 2012;3:2220–33. [DOI] [PMC free article] [PubMed] [Google Scholar]


