Supplemental Digital Content is available in the text
Keywords: diffusion magnetic resonance imaging, liver neoplasms, radiofrequency ablation
Abstract
To explore different posttreatment changes between multimode tumor ablation therapy (MTAT) and radiofrequency ablation (RFA) using intravoxel incoherent motion diffusion-weighted imaging (IVIM-DWI) and diffusion kurtosis imaging (DKI) in patients with hepatic malignancies.
Eighty - seven patients with one hundred and twenty eight hepatic lesions receiving MTAT or RFA underwent IVIM-DWI and DKI before and after treatment. The mean value of apparent diffusion coefficient (ADC), IVIM-DWI parameters, including true diffusion coefficient (D), pseudo-diffusion coefficient (DP), perfusion fraction (f), and DKI parameters including diffusion coefficient (DK), apparent diffusional kurtosis (K) were retrospectively compared prior to and following treatment as well as between treatment groups. The degree of parameters change after ablation was compared between 2 treatment modalities.
The mean value of ADC, D, and DK increased while f, and K decreased significantly in MTAT group. In RFA group, just ADC and K showed significantly change following treatment. The ADC and D value were higher in MTAT group than in RFA group 1 month after treatment. While f was lower in MTAT group after treatment compared with RFA group. The ADC, D and DK increased (21.89 ± 24.95% versus 8.76 ± 19.72%, P = .04 for ADC, 33.78 ± 54.01% versus 7.91 ± 25.16%, P = .03 for D, 25.91 ± 36.28% versus 1.75 ± 46.42%, P = .01 for DK) while f declined (-32.62 ± 41.48% versus 6.51 ± 44.16%, P < .001) more in MTAT group.
The MTAT induced different posttreatment changes on water molecule diffusion and microvasculature related functional MR parameters compared to RFA in patients with liver tumors.
1. Introduction
Locoregional ablation is an effective choice for liver primary tumor or metastatic lesions. In selected patients, clinical benefits of percutaneous ablation are comparable to surgical resection.[1] The fundamental anti-tumor mechanism of ablation is thermal energy induced coagulative necrosis. Interestingly, both hyperthermia and cryo-ablation were found to be able to induce anti-tumor immunity in murine model.[2] Furthermore, the alternate combination of cryo- and radiofrequency ablation (RFA) was found to achieving lasting immune effect and suppression on metastases lesions in recent studies.[3,4] To further verify the lasting anti-tumor effect, this multimode tumor ablation therapy (MTAT, the combination therapy of cryo-ablation and RFA) was compared with conventional RFA in a clinical trail. This novel treatment modality was reported to be a safe and clinically effective method for liver malignancies on an international meeting (see abstract, Supplemental Digital Content).
Previous studies revealed several differences between alternative cryo-thermal therapy and individual cooling or heating treatment alone on histological and molecular level in animal models.[3,5,6] However, histological samples are difficult to acquire in clinical practice. Thus, imaging played important role in confirmation of similar histological findings as well as in treatment efficacy assessment. Magnetic resonance imaging (MRI) is widely used imaging modality for tumor ablation response evaluation for its high soft tissue resolution. Moreover, functional MR imaging, such as diffusion weighted imaging (DWI) and diffusion kurtosis imaging (DKI), is able to provide with more information in tissue diffusion and irregularity property.[7] The intravoxel incoherent motion (IVIM) DWI is developed to describe both molecular diffusivity and microcirculation. The value of IVIM imaging in renal function evaluation,[8] liver fibrosis grading,[9] liver focal lesions characterization,[10] and liver tumor treatment response prediction[11–13] has been verified in recent studies. However, the utility of IVIM imaging or DKI in liver tumor ablation assessment has been seldom reported.
The current study aimed to discover the different posttreatment changes between MTAT and conventional RFA in patients with liver malignancies by functional MRI including IVIM-DWI and DKI.
2. Methods
2.1. Patients
Patients were from a clinical trail (register No.: ChiCTR-INR-16009089), which prospectively investigates the safety and clinical efficacy of MTAT comparing with RFA alone in treatment of liver tumors, including colorectal cancer liver metastases (CRCLM) and hepatocellular carcinoma (HCC). This study was approved by institutional review boards. The written inform consents were obtained by all patients. All patients received percutaneous biopsy for pathological diagnosis prior to treatment. Then patients underwent baseline functional MRI within one week prior to ablation procedures. Patients received follow-up functional MRI on 1 and 3 months following treatment with the same scanner and imaging protocol. Then, contrast enhanced CT scan or MR imaging were obtained for response evaluation at 3 months interval in first two years. The IVIM-DWI and DKI derived parameters before and 1 month after ablation were compared between two treatment groups.
In total, eighty- seven patients with one hundred and twenty- eight lesions were enrolled and treated in this clinical trail. Twenty- six patients with thirty- two lesions were excluded from imaging analysis for lacking either pre- or post- treatment functional MR imaging. Another five patients with ten lesions were excluded from IVIM-DWI analysis for poor imaging quality. For DKI analysis, another ten patients with twenty- one lesions were excluded due to either poor image quality or motion artifacts. In total, fifty- six patients with eighty-six lesions were included in IVIM-DWI analysis while fifty-one patients with seventy- five lesions were included in DKI analysis.
2.2. Multimode tumor ablation therapy and RFA procedure
Procedures in both treatment groups were performed under CT (computed tomography) guidance by three interventional radiologists with at least 5 years experience in image guided percutaneous ablation. A cryo-ablation system with 17 gauge applicators (Cryo-HIT, Galil Medical) was employed for cryo-ablation. And a cluster radiofrequency electrode (17 gauge, MedSphere) was used for RFA. All patients received intramuscular conscious sedation and local anesthesia at the entry site prior to both procedures.
For MTAT group, the cryo-ablation applicators were advanced in the target area followed by freezing. When the ice ball on CT scan indicated 5 mm ablative margin, the freezing power was adjusted to maintain ice ball with stable size for 5 minutes. After passive thawing for 10 minutes, the cryo-ablation applicators were retracted followed by a session of RFA immediately. According to the preoperative planning and real-time applicator tip temperature monitoring, the power and ablation time were set to achieving 5 mm ablative margin.
For RFA group, a traditional session of RFA was performed alone by using the same RFA system. And the ablation halted based on CT images that indicated at least 5 mm ablative margin.
Instantly after ablation in both groups, non-contrast enhanced CT scan was performed for evaluation of ablative efficacy as well as complications.
2.3. MR imaging
All patients received MRI using a 3-T MRI scanner (Skyra, Siemens healthcare, Germany) with 32 channel body matrix coil. The sequence details were listed in Table 1. The contrast enhanced series were obtained by the following protocol: a bolus injection of 0.1 mmol/kg body weight of gadolinium contrast agent (Magnevist, Bayer Healthcare Pharmaceuticals) was given intravenously at rate of 2 mL/s, followed by 20 mL saline flush. Then T1-weighted volumetric interpolated breath-hold series were repeated at 20–30 seconds, 70 to 80 seconds and 180 seconds for arterial, portal venous, and equilibrium phase images acquisition respectively.
Table 1.
Detailed MRI sequence parameters.

2.4. Image quantitative analysis
The apparent diffusion coefficient (ADC), IVIM parameter maps and DKI parameter maps were generated on a pixel-by-pixel basis by software (MR Body Diffusion Toolbox, Siemens), using all b values with monoexponential model for ADC value, a non-linear biexponential model for IVIM and a non-Gaussian kurtosis fit for DKI derived parameters calculation, respectively. Two reviewers with at least 5 years experience in abdominal MRI diagnosis firstly determined the slice with maximum lesion diameter by consensus on the b value of 0 images. Then the reviewers manually delineate two types of region of interests (ROIs) including the whole lesion and liver parenchyma avoiding vessels on the chosen slice. The ROIs were automatically copied to parametric maps. The two reviewers were blinded to clinicopathological information.
Therefore, six parameters were extracted on pre- and post- ablation MRI including ADC, true diffusion coefficient (D), pseudo-diffusion coefficient (DP), perfusion fraction (f), and DKI parameters including diffusion coefficient (DK), apparent diffusional kurtosis (K). Furthermore, the degree of these parameters variation before and after ablation was evaluated by the ratio calculated as following: taking ADC as example, ADCratio = (ADCpost - ADCpre) / ADCpre × 100%.
The first ten lesions were employed for measurement repeatability evaluation. Reviewer one repeated delineation of these ten lesions one week after the first drawing. Since the parameters were extracted from the same ROIs, the value of ADC and DK were used for inter-observer and intra-observer intra-class correlation coefficients (ICC) calculation. The ICC over 0.75 was considered as good agreement.
2.5. Statistics analysis
All analysis was conducted using SPSS version 22.0 (IBM, Armonk, NY). The statistical significant level was set at P value less than .05. Variables were presented as mean ± standard deviation. The parameters change before and after treatment were compared by paired t-test. And student t test was employed for parameters comparison on 2 time points between treatment groups. The parameters ratio between groups were compared by Mann-Whitney U test.
3. Results
Overall, for IVIM analysis, twenty- four patients with twenty- three lesions (seventeen CRCLM and 6 HCC) were ablated by MTAT. Another thirty- nine patients with sixty- three lesions (thirty- three CRCLM and thirty HCC) were treated by RFA. For DKI anlysis, twenty- one patients with twenty lesions (sixteen CRCLM and five HCC) were treated by MTAT. Thirty- three patients with fifty- five lesions (twenty- eight CRCLM and twenty seven HCC) were ablated by RFA. No major complications and procedure related mortality was observed in all patients till the 6-month follow-up. Based on 1 month MRI, all lesions were totally ablated.
3.1. Measurement repeatability
The inter-observer ICC for ADC and DK measurement were 0.85 and 0.81. And the intra-observer ICC for ADC and DK measurement were 0.93 and 0.87, respectively. Therefore, the reviewer one completed ROIs delineation for remaining lesions. The parameters value extracted from reviewer one's ROIs were used for analysis.
3.2. IVIM and DKI parameters analysis
The mean value of the 6 parameters from liver parenchyma did not change significantly prior to and following treatments. Furthermore, the parameters from liver parenchyma were not statistically different between groups either before or after treatment. In MTAT groups, the lesions mean value of ADC, D and DK increased with f and K decreasing one month following treatment (Fig. 1, and Fig. 3) (ADC from 1.25 ± 0.30 to 1.47 ± 0.24 × 10⁻³ mm2/s, P < .001, D from 1.18 ± 0.37 to 1.44 ± 0.24 × 10⁻³ mm2/s, P < .001, DK from 1.71 ± 0.49 to 2.09 ± 0.67 × 10⁻³ mm2/s, P = .00, f from 0.14 ± 0.07 to 0.08 ± 0.03, P < .001, K from 0.67 ± 0.14 to 0.56 ± 0.12, P = .00). Nevertheless, in RFA group, just ADC increased with K decreasing significantly (Fig. 2, and Fig. 3).
Figure 1.
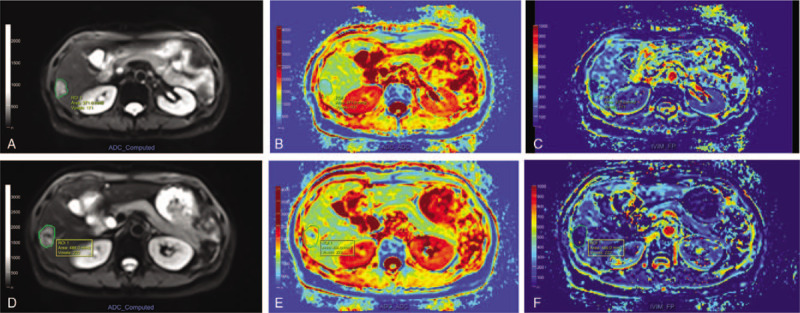
MR images of a 62 yr-old female patient with rectal cancer liver metastases before (upper line) and 1 mo following (lower line) multimode tumor ablation therapy (MTAT). After drawing region-of-interest (ROI) of index tumor and ablative zone on b value of 0 diffusion-weighted imaging (DWI) image (A, D), the mean apparent diffusion coefficient (ADC) value increased from 0.98 × 10⁻³ mm2/s (B) to 1.34 × 10⁻³ mm2/s (E). The mean f value decreased from 0.31 (C) to 0.13 (F). These parameters change indicated necrosis and microvasculature impairment following MTAT. MTAT = multimode tumor ablation therapy.
Figure 3.
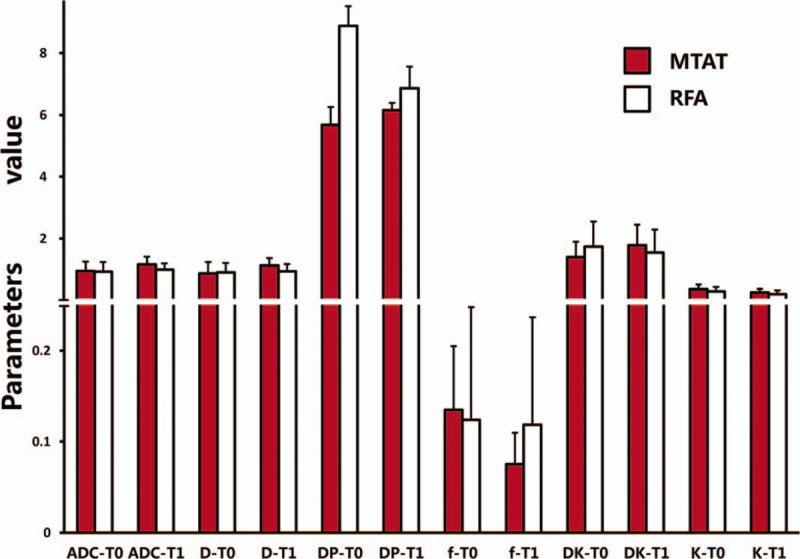
Intravoxel incoherent motion diffusion-weighted imaging (IVIM-DWI) and diffusion kurtosis imaging (DKI) parameters comparison before and after treatment in multimode tumor ablation therapy (MTAT) or radiofrequency ablation (RFA) group. The f value one month following MTAT was significantly lower compared to RFA group (P = .00). The DP of 100 × 10–3 mm2/s was displayed as value of 1. Error bars = 95% confidence intervals.
Figure 2.
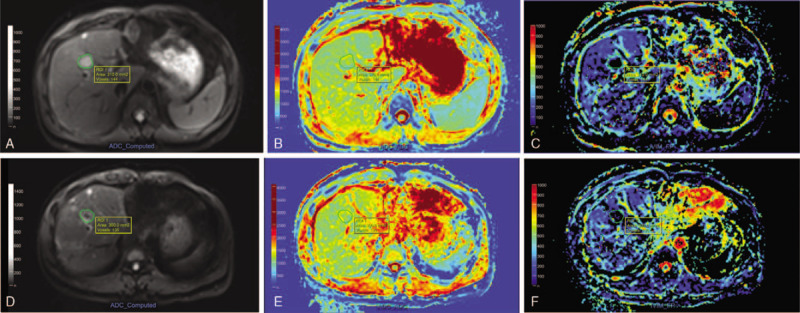
MR images of a 40 yr-old male patient with colon cancer liver metastases before (upper line) and 1 mo after (lower line) radiofrequency ablation (RFA). Following drawing region-of-interest (ROI) of index tumor and ablative zone on b value of 0 diffusion-weighted imaging (DWI) image (A, D), the apparent diffusion coefficient (ADC) maps (B, E) demonstrated slight increasing of mean ADC value from 1.16 × 10⁻³ mm2/s to 1.22 × 10⁻³ mm2/s. And the f maps (C, F) showed minor increasing of mean f value from 0.21 to 0.28.
The baseline parameters between treatment groups were not statistically different. Among all parameters 1 month after ablation, the mean ADC and D value were higher with lower mean f value in MTAT group compared to RFA group (1.47 ± 0.24 × 10⁻³ versus 1.29 ± 0.21 mm2/s, P < .001 for ADC, 1.44 ± 0.24 × 10⁻³ versus 1.24 ± 0.24 mm2/s, P = .00 for D, 0.08 ± 0.03 versus 0.12 ± 0.05, P < .001 for f). The parameters changes were displayed in Fig. 3.
The degree of parameters change in 2 treatment groups were summarized in Table 2. The ADCratio, Dratio and DKratio were much higher in MTAT group. The fratio were significantly lower in MTAT group (-32.62%) compared to RFA group (6.51%). The comparison of ADCratio, Dratio, DKratio and fratio between 2 treatment modalities were shown in Fig. 4.
Table 2.
Parameters ratio comparison.
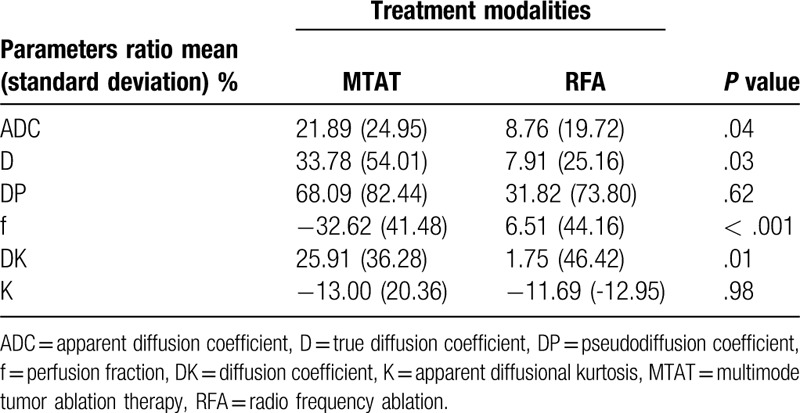
Figure 4.
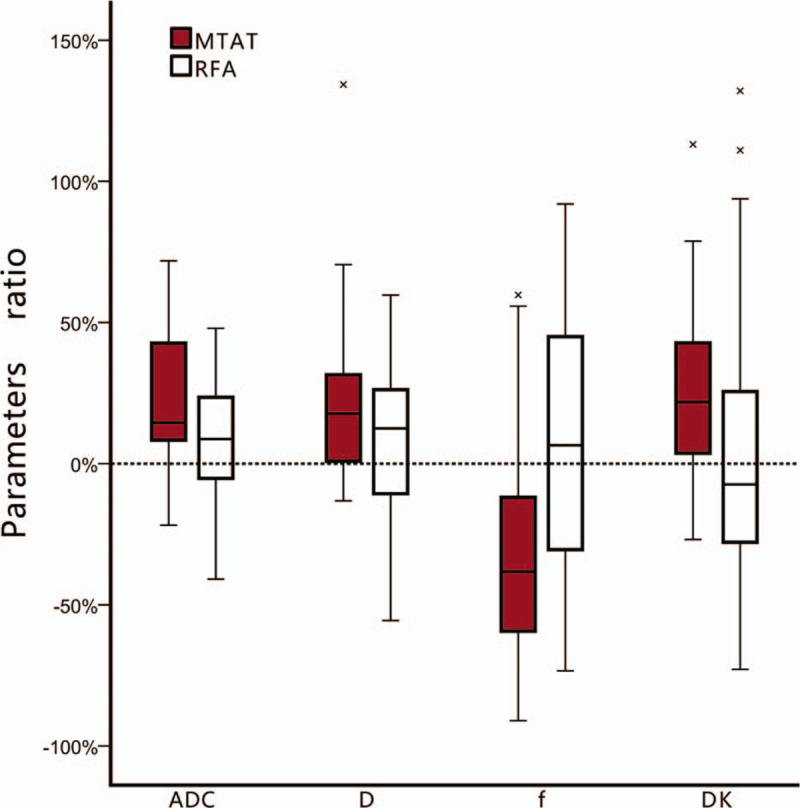
The box-plot of apparent diffusion coefficient (ADC), D, f and DKratio comparison between treatment groups. The ADCratio, Dratio and DKratio in multimode tumor ablation therapy (MTAT) group were higher than in radiofrequency ablation (RFA) group. The f value decreased in MTAT group while increased in RFA group. Error bars = 95% confidence intervals. Stars = outlier cases.
4. Discussion
Previous studies indicated that the alternate combination of cooling and heating was different not only in tissue damage pattern[5] but also in host immuno-response[14] compared to cooling or heating alone. One of the most obvious difference in tissue damage was that the alternate cooling and heating induced much more severe microvasculature rupture throughout the entire tumor.[6] Hence, we employed IVIM-DWI, which was developed based on random molecular motion, to evaluate the vasculature change. In IVIM model, the water diffusion is separated into 2 compartments including tissue water molecular diffusion and blood flow in the capillary networks.[15] Two parameters, DP and f, were used to characterize the later component. The f refers to the volume fraction of water flowing in the capillaries, while DP represents these water molecular mobility. According to the definition, the lower value of f refers to less density of capillaries. In current study, the lesion f value in MTAT group decreased significantly compared with RFA group after treatment, which indicated more microvasculature damage. This result was accordance with histological findings in previous study.[5] On the other hand, the f value in RFA group increased slightly without statistical difference. This contradictory evolution could be explained by the underlying theoretical difference. Firstly, the alternate freezing and heating induced rapid thermal stress in opposite direction to the vessel wall, which caused serious microvasculature damage. However, in RFA group, blood vessels suffered from just heating stress. Secondly, the freezing process in MTAT formed a relative homogenous zone, in which the energy distribution was extended. On the other hand, the temperature on the peripheral ablation zone in RFA may not be adequate enough to break off the vessel wall due to the heterogeneous tissue structure. To our knowledge, only one published study had been reported the IVIM related parameters change following ablation.[16] Guo et al observed that f and DP decreased and D increased in ablated necrosis area instantly after ablation in rabbit VX2 tumor. Besides, the f increased in the residual unablated tumor zone. The discrepancy between our results and Guo's could be originated from different post-ablation imaging time point. In current study, the IVIM parameters were obtained 1 month after ablation. Several histological changes could occur during this time span. In an animal study, the tubular structure vessels appeared in tumor periphery 7 days following totally hyperthermia treatment.[5] These recurred vessels could influence the f value.
In current study, lesion DP values did not show any obvious difference neither between treatment groups nor pre- and post- treatment in the same group. DP fitting was reported to be very sensitive to imaging technique and other factors in IVIM model.[17] Therefore, lesion DP values may be influenced by factors other than treatment. The value of DP in post-treatment change evaluation needs further investigation in future studies.
The evolution of ADC following ablation had been reported by a few studies. Schramlet al reported that no evident changes in ablation zone ADC value over time in patients with liver malignancies following RFA.[18] On the contrary, another study revealed an up and down evolution of ADC value in patients with liver metastases 1, 3, and 6 months after completely RFA.[19] We found just slightly ADC value increasing (ADCratio of 8.76%) after RFA. In current study, CRCLMs were included. This type of tumor was with frequent necrosis. And necrotic area was with higher ADC value compared to viable tumor parts.[20] Therefore, relative higher pre-treatment mean ADC value might overlay the ADC value escalation induced by RFA.
The ADC, D, and DK value increased significantly after MTAT in current study. And the degree of ADC, D and DK value increment (presented as ADCratio, Dratio and DKratio) were higher in MTAT group compared to RFA group. This result may be due to another mechanism difference between two modalities. In MTAT group, the cryo-ablation could induce more significant degree of apoptosis.[3] The apoptotic death resulted in plenty of cell debris and structures containing hydrate. However, in RFA group, the tumor cells were totally ablated into dehydrated coagulation materials, which presented as homogenous hypo-intensity zone in DW images.[21] More content of water in ablation zone after MTAT may contribute to the higher escalation in ADC, D, and DK.
Another functional imaging method we employed was DKI. DKI model was developed to describe the non-Gaussian diffusion property caused by cell membrane or complex tissue structure.[22] The parameter K, which trended to be between 0 and 1 in vivo, was used to present extent of non-Gaussian diffusion.[23] Theoretically, smaller K value indicated less complexity of tissue. In previous study, lowering K was found to be related to tumor viability in HCC following RFA or transcatheter arterial chemoembolization.[24] We observed similar K value change after both treatment modalities in current study. It could be explained by destructive effect by ablation. However, the posttreatment K value were not significantly different between treatment groups. The underlying reason may be that K value were not sensitive enough to distinguish micro-structure difference following two modalities.
There are several limitations in current study. First, the histological changes after treatments were unable to correspond with the image findings, as none of the participants received surgical resection or post-ablation biopsy. Second, 6 patients with multiple lesions received both treatment modalities in the same session. Thus, the ablation effect could be interfered mutually. Moreover, the purpose of the current study was to find out whether there was any difference between MTAT and RFA on functional MRI. The relationship between IVIM or DKI parameters and prognosis, such as local tumor recurrence, was not analyzed. As one of the most valuable issues in liver tumor ablation, the predict value of imaging on local recurrence and survival following MTAT or RFA should be evaluated in further studies.
The liver malignancies treated with MTAT showed lower microvasculature and high water diffusion related parameters compared to traditional RFA on posttreatment functional MRI. These differences on functional MR imaging parameters could be related to the different underlying pathological changes between MTAT and RFA, which are worth further investigation.
Author contributions
Conceptualization: Wentao Li.
Data curation: Guangyuan Zhang.
Formal analysis: Guangyuan Zhang.
Investigation: Wentao Li, Guangzhi Wang, Xinhong He, Lichao Xu, Shengping Wang.
Methodology: Wentao Li.
Resources: Weijun Peng.
Writing – original draft: Guangyuan Zhang.
Writing – review & editing: Wentao Li.
Supplementary Material
Footnotes
Abbreviations: ADC = apparent diffusion coefficient, CRCLM = colorectal cancer liver metastases, CT = computed tomography, D = true diffusion coefficient, DK = diffusion coefficient, DKI = diffusion kurtosis imagine, DP = pseudo-diffusion coefficient, f = perfusion fraction, HCC = hepatocellular carcinoma, ICC = intra-class correlation coefficients, IVIM-DWI = intravoxel incoherent motion diffusion-weighted imaging, K = apparent diffusional kurtosis, MTAT = multimode tumor ablation therapy, RFA = radiofrequency ablation, ROI = region of interests.
How to cite this article: Zhang G, Li W, Wang G, He X, Xu L, Wang S, Peng W. Multimode tumor ablation therapy induced different diffusion and microvasculature related parameters change on functional magnetic resonance imaging compared to radiofrequency ablation in liver tumor: an observational study. Medicine. 2020;99:26(e20795).
ZG and LW contributed equally to this study.
This study has received funding by the National Key Research and Development Program (2016YFC0106201).
Supplemental Digital Content is available for this article.
The authors have no conflicts of interest to disclose.
The datasets generated during and/or analyzed during the current study are not publicly available, but are available from the corresponding author on reasonable request.
References
- [1].Hur H, Ko YT, Min BS, et al. Comparative study of resection and radiofrequency ablation in the treatment of solitary colorectal liver metastases. Am J Surg 2009;197:728–36. [DOI] [PubMed] [Google Scholar]
- [2].den Brok MH, Sutmuller RP, Nierkens S, et al. Efficient loading of dendritic cells following cryo and radiofrequency ablation in combination with immune modulation induces anti-tumour immunity. Br J Cancer 2006;95:896–905. [DOI] [PMC free article] [PubMed] [Google Scholar]
- [3].Zhu J, Zhang Y, Zhang A, et al. Cryo-thermal therapy elicits potent anti-tumor immunity by inducing extracellular Hsp70-dependent MDSC differentiation. Sci Rep 2016;6:27136. [DOI] [PMC free article] [PubMed] [Google Scholar]
- [4].He K, Liu P, Xu LX. The cryo-thermal therapy eradicated melanoma in mice by eliciting CD4(+) T-cell-mediated antitumor memory immune response. Cell Death Dis 2017;8:e2703. [DOI] [PMC free article] [PubMed] [Google Scholar]
- [5].Shen YY, Zhang AL. Study of alternate cooling and heating treatment induced tumor microvasculature injury. Chinese Sci Bull 2010;55:172–8. [Google Scholar]
- [6].Shen YY, Liu P, Zhang AL, et al. Study on tumor microvasculature damage induced by alternate cooling and heating. Ann Biomed Eng 2008;36:1409–19. [DOI] [PubMed] [Google Scholar]
- [7].Rosenkrantz AB, Padhani AR, Chenevert TL, et al. Body diffusion kurtosis imaging: basic principles, applications, and considerations for clinical practice. J Magn Reson Imaging 2015;42:1190–202. [DOI] [PubMed] [Google Scholar]
- [8].Ichikawa S, Motosugi U, Ichikawa T, et al. Intravoxel incoherent motion imaging of the kidney: alterations in diffusion and perfusion in patients with renal dysfunction. Magn Reson Imaging 2013;31:414–7. [DOI] [PubMed] [Google Scholar]
- [9].Jiang H, Chen J, Gao R, et al. Liver fibrosis staging with diffusion-weighted imaging: a systematic review and meta-analysis. Abdom Radiol 2017;42:490–501. [DOI] [PubMed] [Google Scholar]
- [10].Calistri L, Castellani A, Matteuzzi B, et al. Focal liver lesions classification and characterization: what value do DWI and ADC have? J Comput Assist Tomogr 2016;40:701–8. [DOI] [PubMed] [Google Scholar]
- [11].Kim JH, Joo I, Kim TY, et al. Diffusion-related mri parameters for assessing early treatment response of liver metastases to cytotoxic therapy in colorectal cancer. AJR Am J Roentgenol 2016;207:W26–32. [DOI] [PubMed] [Google Scholar]
- [12].Pan F, Den J, Zhang C, et al. The therapeutic response of gastrointestinal stromal tumors to imatinib treatment assessed by intravoxel incoherent motion diffusion-weighted magnetic resonance imaging with histopathological correlation. PloS One 2016;11:e0167720. [DOI] [PMC free article] [PubMed] [Google Scholar]
- [13].Wu L, Xu P, Rao S, et al. ADCtotal ratio and D ratio derived from intravoxel incoherent motion early after TACE are independent predictors for survival in hepatocellular carcinoma. J Magn Reson Imaging 2017;46:820–30. [DOI] [PubMed] [Google Scholar]
- [14].Dong J, Liu P, Xu LX. Immunologic response induced by synergistic effect of alternating cooling and heating of breast cancer. Int J Hyperthermia 2009;25:25–33. [DOI] [PubMed] [Google Scholar]
- [15].Le Bihan D, Breton E, Lallemand D, et al. Separation of diffusion and perfusion in intravoxel incoherent motion MR imaging. Radiology 1988;168:497–505. [DOI] [PubMed] [Google Scholar]
- [16].Guo Z, Zhang Q, Li X, et al. Intravoxel incoherent motion diffusion weighted mr imaging for monitoring the instantly therapeutic efficacy of radiofrequency ablation in rabbit vx2 tumors without evident links between conventional perfusion weighted images. PloS one 2015;10:e0127964. [DOI] [PMC free article] [PubMed] [Google Scholar]
- [17].Patel J, Sigmund EE, Rusinek H, et al. Diagnosis of cirrhosis with intravoxel incoherent motion diffusion MRI and dynamic contrast-enhanced MRI alone and in combination: preliminary experience. J Magn Reson Imaging 2010;31:589–600. [DOI] [PMC free article] [PubMed] [Google Scholar]
- [18].Schraml C, Schwenzer NF, Clasen S, et al. Navigator respiratory-triggered diffusion-weighted imaging in the follow-up after hepatic radiofrequency ablation-initial results. J Magn Reson Imaging 2009;29:1308–16. [DOI] [PubMed] [Google Scholar]
- [19].Lu TL, Becce F, Bize P, et al. Assessment of liver tumor response by high-field (3 T) MRI after radiofrequency ablation: short- and mid-term evolution of diffusion parameters within the ablation zone. Eur J Radiol 2012;81:e944–50. [DOI] [PubMed] [Google Scholar]
- [20].Albiin N. MRI of Focal Liver Lesions. Curr Med Imaging Rev 2012;8:107–16. [DOI] [PMC free article] [PubMed] [Google Scholar]
- [21].Hoffmann R, Rempp H, Schraml C, et al. Diffusion-weighted imaging during MR-guided radiofrequency ablation of hepatic malignancies: analysis of immediate pre- and post-ablative diffusion characteristics. Acta radiologica 2015;56:908–16. [DOI] [PubMed] [Google Scholar]
- [22].Jensen JH, Helpern JA, Ramani A, et al. Diffusional kurtosis imaging: the quantification of non-gaussian water diffusion by means of magnetic resonance imaging. Magn Reson Med 2005;53:1432–40. [DOI] [PubMed] [Google Scholar]
- [23].Jensen JH, Helpern JA. MRI quantification of non-Gaussian water diffusion by kurtosis analysis. NMR Biomed 2010;23:698–710. [DOI] [PMC free article] [PubMed] [Google Scholar]
- [24].Goshima S, Kanematsu M, Noda Y, et al. Diffusion kurtosis imaging to assess response to treatment in hypervascular hepatocellular carcinoma. AJR Am J Roentgenol 2015;204:W543–9. [DOI] [PubMed] [Google Scholar]
Associated Data
This section collects any data citations, data availability statements, or supplementary materials included in this article.


