

Abstract
Rationale:
Whether short-term glucose control in cystic fibrosis-related diabetes (CFRD) is associated with FEV1 recovery during acute pulmonary exacerbations is unclear.
Methods:
Data from all patients with CFRD ages 6–21 years hospitalized in 2010–2016 for pulmonary exacerbations at our CF Center were analyzed, including CFRD status at each encounter, all FEV1 recorded during each exacerbation, and relevant clinical covariates. Glucose control was analyzed using meter blood glucose area under the curve (AUC) indices. The primary outcome was FEV1 recovery.
Results:
Patients with CFRD who finished IV antibiotics at home were treated for longer than those fully treated in the hospital (22.2 vs. 13.8 days). In those who finished treatment at home, poor inpatient glycemic control was associated with lower lung function improvement: when comparing the 75th to the 25th percentile of each glycemic index (i.e., “poorer” vs. “better” glycemic control), FEV1 recovery at discharge was 20.1% lower for glucose AUC (95%CI −0.4%, −39.9%); 20.9% lower for 48-hour AUC (95%CI −2.7%, −39.1%); and 28.2% lower for AUC/day (95%CI −7.1%, −49.3%). Similar results were found at the end of IV antibiotics and at clinic follow-up. Likewise, patients with poor glycemic control had a lower slope of inpatient FEV1 recovery. Analysis in patients with normal glucose tolerance was largely non-significant. No associations were found between hemoglobin A1c and FEV1 recovery.
Conclusions:
In patients with CFRD who complete IV antibiotic treatment at home, poor inpatient glycemic control is associated with worse FEV1 recovery despite longer duration of treatment.
Keywords: Cystic fibrosis, cystic fibrosis-related diabetes, lung function, glycemic control
INTRODUCTION
Pulmonary disease remains the most significant determinant of morbidity and mortality in cystic fibrosis (CF). Patients with CF typically experience progressive decline in lung function punctuated by pulmonary exacerbations(1), acute episodes characterized by worsened cough and sputum production and thickness, as well as decreases in pulmonary function, appetite, and weight. Over 34% of patients with CF are treated with IV antibiotics for an exacerbation each year(2); median duration of hospitalization for these events is 9.3 days, and the median duration of IV antibiotics is 13 days(2). Yet, in 25% of cases pre-exacerbation lung function is not fully recovered(1, 3). Identifying predictors of lung function recovery during pulmonary exacerbations could prove useful to help patients with CF maintain lung function and improve both quality and length of life.
CF-related diabetes (CFRD) is one of the most common comorbidities in CF, affecting 20% of adolescents and over 40% of adults(4, 5). CFRD pathogenesis is incompletely understood and likely multifactorial, but is thought to primarily be a combination of insulin insufficiency (secondary to fibrosis and scarring of the pancreatic ducts from obstruction by thick mucus produced in CF and destruction of adjacent insulin-producing islet cells), insulin resistance (which may be more prominent during pulmonary exacerbations) and impaired glucagon suppression(6–8). CFRD is associated with more rapid declines in lung function(9), increased frequency of exacerbations and shortened interval between exacerbations(10), failure of exacerbation treatment, and decreased survival(5, 11, 12). The mechanisms by which CFRD affects the lungs are not well elucidated, but potential mechanisms include impairment of bacterial clearance, exaggerated lung neutrophil infiltration(13), impaired neutrophil function(14), and increased inflammation(15).
Previous literature on CFRD and lung function has focused on long-term effects. Whether short-term glucose control affects lung function recovery during acute pulmonary exacerbations is unclear. We hypothesized that better acute glycemic control in patients with CFRD would be associated with better FEV1 recovery during inpatient IV treatment of pulmonary exacerbations. We further hypothesized that glucose control in CF patients with normal glucose tolerance (NGT) would be less critical for FEV1 recovery. Some of the results of this study were reported at the 2019 ATS International Conference as a poster and published abstract.
METHODS
Study design and subjects
A retrospective chart review was performed of clinical, laboratory, and pulmonary function test data for all children and adolescents with CF (ages years) hospitalized for acute pulmonary exacerbations from January 2010 to December 2016 at the UPMC Children’s Hospital of Pittsburgh (CHP). Patients were included in this study if they had a confirmed diagnosis of CF, had provided consent to be in the CF Foundation Patient Registry (CFFPR), had a pulmonary exacerbation requiring IV antibiotics during the seven-year period, and were at least six years old to ensure reproducible spirometry. CFRD diagnosis was confirmed according to the Cystic Fibrosis Foundation clinical practice guidelines for CFRD(4). Patients with impaired glucose tolerance, impaired fasting glucose, or indeterminate status (n=30 total) were excluded from analysis. This study was approved by the University of Pittsburgh Institutional Review Board (PRO17040055).
Data collection
For each episode, the “start” was defined as the day of hospital admission (day 0) and the “end” was defined as the day IV antibiotics were stopped; thus, for patients who completed IV antibiotics in the hospital, “discharge” and “end of exacerbation” were the same day, while for those who went home on IV antibiotics, the end of exacerbation happened after their discharge. “Follow-up” was defined as the first set of PFTs within 30 to 90 days after the end of IV antibiotics. For each episode, data collected included patient demographics, hospitalization diagnosis, CFRD status, insulin use, pancreatic sufficiency status, CFTR genotype, body mass index (BMI), hemoglobin A1c (HbA1c), presence of gastrostomy tube, and antibiotics from the electronic medical record; and sweat chloride levels and sputum culture microbiology from the CFFPR. Patients were considered positive for a bacterial pathogen if their culture tested positive within the year prior to admission. All meter blood glucoses (MBGs) during each hospitalization were included for analysis, as well as all forced expiratory volume in 1 second (FEV1) measurements from CHP’s pulmonary function test (PFT) database (ComPAS, Morgan Scientific, Haverhill, MA). Spirometries were collected according to American Thoracic Society guidelines(16), and FEV1 was normalized using Global Lung Function Initiative (GLI) equations(17). The closest available HbA1c to the beginning of an exacerbation was used, up to a maximum of 90 days before the exacerbation.
Glycemic control
Glycemic control was analyzed using the area under curve (mg/dL·days) derived from all MBG levels from the hospitalization (hereinafter “AUC”). Glucose AUC was calculated using the trapezoidal rule, which has been previously validated in diabetes research(18). The importance of prompt glycemic control was also evaluated using the AUC for the first 48 hours of each episode (“AUC48”). Moreover, the total AUC was standardized by the number of hospitalization days during which glucose levels were monitored (“AUC/day”) to account for varying lengths of stay and for the different numbers of blood glucose measurements. AUC and AUC48 were non-normally distributed and log-transformed for analysis. In addition to the AUC glycemic indices, we also analyzed HbA1c and the median MBG during the hospitalization.
Statistical analysis
Our primary outcome was FEV1 recovery for each exacerbation, defined as the FEV1 at each time point relative to FEV1 on admission (e.g. FEV1 at discharge * 100 / FEV1 on admission). We used longitudinal random-effects models with generalized least-squares (GLS) estimators, which produces a matrix-weighted average of between- and within-subject effects. Models were adjusted for repeated measures as well as sex, age, age at CFRD diagnosis, year’s best FEV1, hospital length of stay, and covariates associated with CFRD in our population (BMI, presence of G-tube, and growth of MRSA within the past year). We also analyzed the speed of inpatient FEV1 recovery, defined as the slope (best FEV1 during hospitalization – FEV1 on admission) / (number of days from admission to best FEV1). Patients whose CFRD status changed throughout the study period were analyzed using their CFRD status at the time of each exacerbation. In addition to the overall group, analysis was stratified according to glycemic control (i.e. good vs poor control) and whether IV antibiotic treatment was completed in the hospital or at home for two key reasons: 1) the inpatient treatment setting is likely better controlled and supervised (e.g. airway clearance treatments, glucose monitoring, insulin administration) than the home setting; and 2) patients who went home on IV antibiotics were discharged earlier (9.9 days vs. 13.8 days, p=0.019) but required longer total treatment than those who completed IV treatment in the hospital (22.2 vs. 13.8 days, p<0.001). For standardization and ease of interpretation, we present the effect estimates of comparing the 75th vs 25th percentile (i.e., poor vs good control) for each glycemic index. All data were analyzed in Stata 15 (StataCorp, TX). Statistical significance was defined as a P-value < 0.05.
RESULTS
A total of 164 hospitalizations for CF pulmonary exacerbations in 58 patients 6–21 years old were identified during the study period: 97 hospitalizations in 39 patients with NGT, and 67 hospitalizations in 19 patients with CFRD (Supplementary Figure S1). For this study, we focused on the CFRD population; baseline characteristics are shown in Table 1. Compared to patients with NGT (Supplementary Table S1), those with CFRD were more likely to be male, were older on admission, had lower BMI, and had higher proportions of G-tube and MRSA colonization within the past year. CFRD was also associated with more exacerbation episodes and higher levels of all glycemic control measures, including HbA1c, total glucose AUC, AUC within the first 48 hours of admission (AUC48), AUC per day, median glucose level and the average proportion of their glucose measurements that were above normal. Moreover, subjects with CFRD had lower FEV1 at all time points (prior year’s best, admission, discharge, end of IV antibiotics, and follow-up). However, average FEV1 recovery (as percent of FEV1 on admission) was similar in patients with and without CFRD. Furthermore, there were no statistically significant differences in F508del genotype, pancreatic insufficiency, Pseudomonas isolation, total treatment days, or percent of exacerbation treated in the hospital by CFRD status.
Table 1 –
Baseline characteristics of the CFRD study cohort
| All patients with CFRD | |
|---|---|
| Number of episodes (hospitalization for an exacerbation) | 67 |
| Number of individual patients1 | 19 |
| Episodes per patient, median [IQR] | 3 [2–5] |
| Female sex (%) | 34 (50.7%) |
| Age at hospital admission, years | 15.1 (3.3) |
| F508del: | |
| Pancreatic insufficient (%) | 56 (83.6%) |
| BMI percentile at admission | 28.3 (28.6) |
| G-tube (%) | 34 (50.7%) |
| Microbiology (sputum): | |
| Insulin use (%) | 57 (85.1%) |
| Glycemic control indices | |
| HbA1c, % | 6.5 (1.1) |
| Number of inpatient MBG tests, median [IQR] | 56.5 [40–79] |
| AUC (log) | 7.2 (0.6) |
| AUC48 (log) | 5.6 (0.3) |
| AUC/day | 147.5 (34.3) |
| Median MBG (mg/dl) | 135.1 (33.5) |
| Glucose concentration categories: | |
| Exacerbation and recovery measures | |
| Total IV antibiotic treatment days | 17.9 (9.7) |
| Percent of time treated in hospital | 72.1 (30.7) |
| FEV1 (%predicted): | |
| FEV1 recovery (as % of FEV1 on admission): | |
Continuous variables shown as mean (SD) and categorical variables shown as N (%), unless otherwise stated. AUC: Area under the curve for meter blood glucose levels. AUC48 calculated using data from the first 48 hours only. AUC/day is the total AUC standardized by the total time during which glucose was monitored. BMI: Body mass index. CFRD: Cystic fibrosis-related diabetes. HbA1c: Hemoglobin A1c. IQR: Interquartile range (25th, 75th percentiles). MBG: Meter blood glucose level. NGT: Normal glucose tolerance.
Summary statistics shown for all events/exacerbations, rather than per patient, because some patients changed CFRD status during the study period.
Slope = (Best FEV1 – admission FEV1) / total days to improvement.
Figure 1 provides an example of the MBG data used to generate glucose AUCs. Supplementary Figure S2 shows that all AUC indices (AUC, AUC48 and AUC/day) have good accuracy to discriminate between CFRD and NGT. Supplementary Figure S3 shows the correlations between the AUC glycemic indices and HbA1c: log(AUC), log(AUC48), AUC/day, and the median MBG during hospitalization were all moderately correlated with HbA1c.
Figure 1 – Example of MBG glycemic control patterns in patients with CFRD.

Meter blood glucose (MBG) concentrations from two actual patients with CFRD, shown as examples of different patterns of glycemic control.
Table 2 shows the results from the adjusted longitudinal, repeated-measures analysis of acute glycemic control and FEV1 recovery in patients with CFRD. Given the different units and range for each glycemic index, the table shows the predicted difference in FEV1 recovery between subjects in the 75th percentile and those in the 25th percentile for each glycemic control index (i.e. poorer vs. better control); per-unit regression coefficients are shown in Supplementary Table S2. In episodes when CFRD patients completed IV antibiotic treatment at home (Table 2 middle panel), poor glycemic control was associated with lower FEV1 recovery at discharge, regardless of the index used: average improvement was 20.1% lower when defined using AUC; 20.9% lower when defined by AUC48; 28.2% lower when using AUC/day; and 13.9% lower when defined using median MBG. Lung function recovery by the end of treatment was 20.8% to 25.2% lower when poor glycemic control was defined using AUC48 or AUC/day. Similarly, recovery by next clinic visit was 21.6% to 29.3% lower when analyzing AUC or AUC/day, and 15% when using median MBG. Finally, the slope (speed) of inpatient FEV1 improvement was lower when glycemic control was defined using AUC48, AUC/day, or median MBG. Sensitivity analysis restricted to the ~85% of subjects on insulin yielded similar results (see Supplementary Table S3). In further sensitivity analyses using clustered bootstrapping to calculate confidence intervals, results remained largely unchanged.
Table 2 –
FEV1 recovery in patients with CFRD
| Difference in FEV1 recovery at each point (compared to admission) by glycemic control | ||||
|---|---|---|---|---|
| Hospital discharge | End of IV antibiotics | Clinic follow-up | FEV1 recovery slope1,2 | |
| All hospitalizations in CFRD patients (64 hospitalizations) | ||||
| AUC1 | −3.2 (−17.1, 10.7) p=0.65 | −2.0 (−15.9, 11.8) p=0.77 | −14.7 (−33.3, 3.9) p=0.12 | −0.3 (−0.7, 0.2) p=0.22 |
| AUC481 | −17.9 (−32.1, −3.7) p=0.014 | −19.7 (−33.2, −6.2) p=0.004 | −11.9 (−28.1, 4.4) p=0.15 | −0.3 (−0.7, 0.2) p=0.22 |
| AUC/day | −1.4 (−13.0, 10.3) p=0.82 | −1.0 (−12.9, 10.9) p=0.87 | −4.4 (−21.1, 12.4) p=0.61 | −0.3 (−0.7, 0.1) p=0.20 |
| Median MBG | −0.02 (−9.7, 9.7) p=0.99 | +1.9 (−7.8, 11.5) p=0.70 | −4.6 (−15.5, 6.4) p=0.41 | −0.2 (−0.5, 0.1) p=0.16 |
| Discharged home on IV antibiotics (32 hospitalizations) | ||||
| AUC1 | −20.1 (−39.9, −0.4) p=0.045 | −12.1 (−31.3, 7.2) p=0.22 | −21.6 (−41.4, −1.8) p=0.033 | −0.8 (−1.7, 0.2) p=0.13 |
| AUC481 | −20.9 (−39.1, −2.7) p=0.025 | −25.2 (−41.7, −8.8) p=0.003 | −7.5 (−29.0, 14.0) p=0.49 | −0.9 (−1.9, 0.0) p=0.05 |
| AUC/day | −28.2 (−49.3, −7.1) p=0.009 | −20.8 (−41.7, −0.1) p=0.051 | −29.3 (−52.8, −5.8) p=0.014 | −1.1 (−2.2, −0.04) p=0.042 |
| Median MBG | −13.9 (−27.3, −0.6) p=0.04 | −5.9 (−19.7, 7.9) p=0.40 | −15.0 (−29.2, −0.8) p=0.039 | −0.7 (−1.3, −0.02) p=0.044 |
| Fully treated in-hospital (32 hospitalizations) | ||||
| AUC1 | + 4.9 (−11.6, 21.3) p=0.56 | −4.8 (−24.7, 15.1) p=0.64 | +0.05 (−0.3, 0.4) p=0.80 | |
| AUC481 | −10.0 (−27.5, 7.5) p=0.26 | −6.1 (−30.9, 18.8) p=0.63 | −0.1, (−0.5, 0.3) p=0.51 | |
| AUC/day | +12.0 (−4.9, 28.8) p=0.17 | +16.5 (−9.7, 42.7) p=0.22 | +0.5 (0.1, 0.8) p=0.007 | |
| Median MBG | +17.2 (−1.7, 36.2) p=0.074 | +15.6 (−10.7,41.9) p=0.25 | +0.5 (0.1, 0.8) p=0.019 | |
Numbers show the difference in FEV1 recovery between patients with poor and good glycemic control (i.e., at the 75th vs the 25th percentile for each glucose measure): e.g. among CFRD patients discharged home on IV antibiotics, those with AUC48 at the 75th percentile have 20.9% lower FEV1 recovery at discharge than those in the 25th percentile. FEV1 recovery defined as (FEV1 at each time point * 100) / (FEV1 on admission). All models adjusted for sex, age at admission, age at CFRD diagnosis, year’s best FEV1, hospital length of stay, and covariates associated with CFRD status (BMI, G-tube, and MRSA growth in the past year). AUC: Area under the curve. AUC48 calculated using data from the first 48 hours only. AUC/day is the total AUC standardized by the total time during which glucose was monitored. MBG: Meter blood glucose level.
Analyzed as log.
Slope = (Best FEV1 – admission FEV1) / total days to best FEV1.
In episodes during which CFRD patients completed IV antibiotic treatment in the hospital (Table 2 lower panel), no significant associations were observed between glycemic control and FEV1 recovery at discharge, end of treatment or follow-up. There was a small but significant relationship between higher AUC/day or higher median MBG and a faster slope of FEV1 recovery. Similarly, when restricting to patients on insulin who completed IV treatment in the hospital, there was a significant association between AUC/day and median MBG and a better FEV1 recovery at the time of discharge (Supplementary Table S3).
On the other hand, analysis of acute glycemic control and FEV1 recovery in patients with NGT was mostly non-significant and showed only sporadic associations (Supplementary Tables S4 and S5). Furthermore, no associations were found between HbA1c and FEV1 recovery at any point in either CFRD or NGT patients (data not shown).
Figure 2 shows the FEV1 trajectories over time, from admission through 60 days post admission, in patients with well-controlled and poorly-controlled CFRD (defined as AUC/day levels below and above the median, respectively) and those with NGT. Patients with well-controlled CFRD exhibited FEV1 values much closer to patients with NGT, whereas FEV1 recovery was much lower among poorly-controlled patients. Figure 3 shows the trajectory of FEV1 recovery (as percent of FEV1 on admission) in CFRD, stratified by hospitalization status and acute glycemic control. Among CFRD patients with good glycemic control, FEV1 recovery was similar in patients treated in the hospital and in those who finished treatment at home. In contrast, among patients with poor glycemic control there was a greater FEV1 recovery among those fully treated in the hospital compared to those who were discharged to finish antibiotics at home. Moreover, in the well-controlled group FEV1 was still ~130% of admission after ~60 days, whereas in the poorly controlled group FEV1 declined and by ~60 days it approached the same value as on admission.
Figure 2 – FEV1 trajectories for patients with normal glucose tolerance (NGT), well-controlled CFRD, and poorly-controlled CFRD.
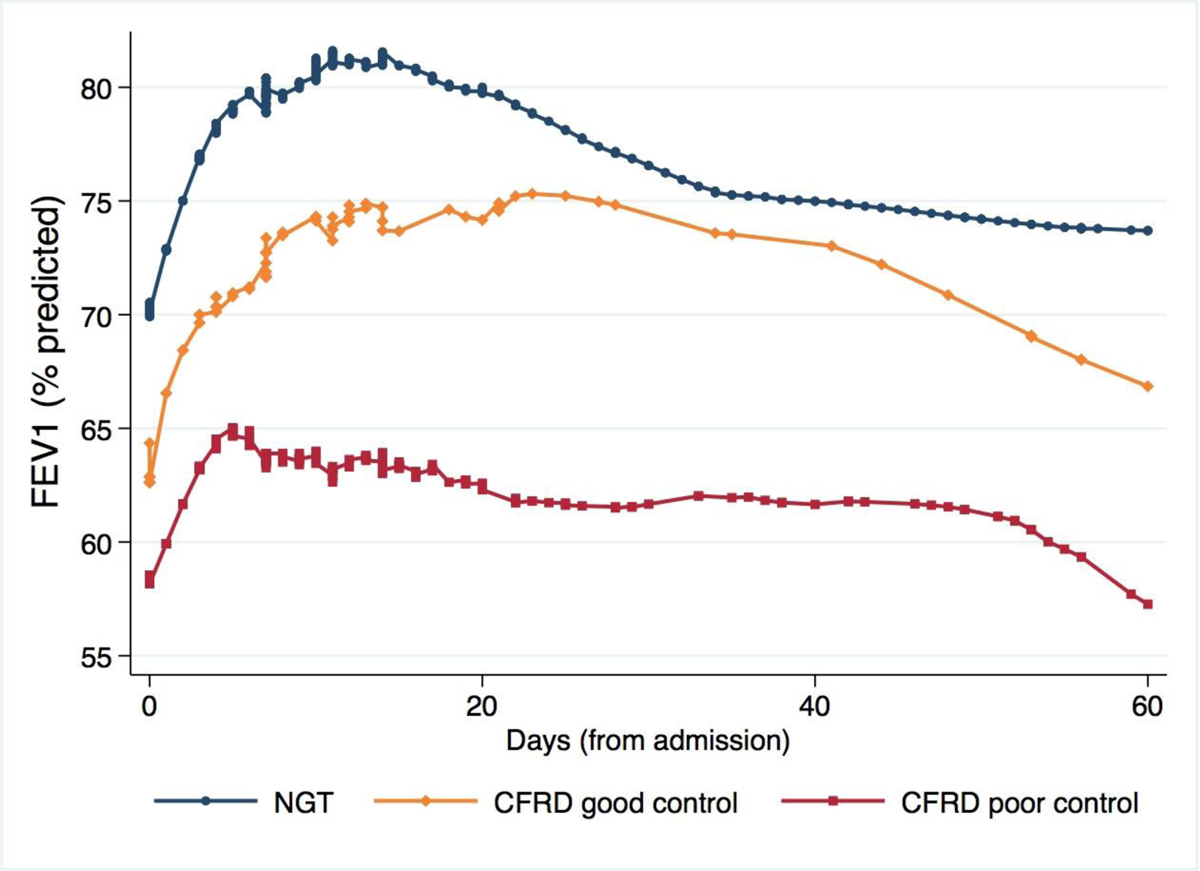
Poorly-controlled CFRD was defined as AUC/day in the highest quartile (quartile 4); well-controlled CFRD was defined as AUC/day below the median (quartiles 1–2). Quartile 3 excluded to highlight the differences. Trajectories estimated using LOWESS smoothing. NGT: Normal glucose tolerance.
Figure 3 – FEV1 recovery in CFRD patients by glycemic control and treatment setting.

FEV1 improvement (relative to FEV1 on admission) in CFRD patients, according to glycemic control and whether IV antibiotic treatment was finished in the hospital or at home. Poorly-controlled CFRD was defined as AUC/day in the highest quartile (quartile 4); well-controlled CFRD was defined as AUC/day below the median (quartiles 1–2). Quartile 3 excluded to highlight the differences. Trajectories estimated using LOWESS smoothing.
Finally, we re-evaluated clinical characteristics of CFRD patients with good vs poor glycemic control (defined as AUC/day below vs above the median), to assess whether other differing clinical characteristics could explain our findings. Patients with poor control were more likely to be female (41.2% vs 20%), had lower BMI (22.5th vs 49.7th percentile), had more frequent hospitalizations for IV treatment, and were treated longer (19.4 vs 13.1 days) with less time spent in the hospital (67.6% vs 85.8% of the total treatment time), but there were no differences in other baseline characteristics (Supplementary Table S6). Sex, BMI, and total days of inpatient treatment were all in our adjusted models.
DISCUSSION
In this longitudinal analysis, we report that poor glycemic control is associated with worse FEV1 recovery in patients with CFRD hospitalized for acute pulmonary exacerbations. Furthermore, patients with CFRD and poor glycemic control who are fully treated in-hospital show better improvements in FEV1 than those who finish IV antibiotics at home. In contrast, patients with well-controlled CFRD exhibited an FEV1 recovery curve closer to that of patients with normal glucose tolerance. To our knowledge, this is the first report suggesting that more tightly controlled glycemia in subjects with CFRD may improve acute FEV1 recovery during pulmonary exacerbations.
Prior studies have shown that CFRD is associated with lower baseline lung function as well as greater long-term lung function decline(19, 20). In our analysis, patients with CFRD and poor glycemic control who finished IV antibiotics at home had lower FEV1 recovery than all other groups. Independent of the index used to assess glycemic control or the time at which lung function was assessed, these patients had ~15% to 30% lower FEV1 improvement (relative to FEV1 at admission) than those who had adequate control. On the other hand, there were no significant differences in FEV1 recovery between well-controlled and poorly-controlled CFRD among patients whose exacerbations were fully treated in the hospital setting. These results therefore extend our prior knowledge and suggest that patients with CFRD who present with an exacerbation and poor glycemic control may benefit the most from in-hospital treatment.
The mechanisms by which increased airway glucose concentrations contribute to the deterioration of lung function are not entirely clear, but airway glucose concentration increases when blood levels rise above 140 mg/dL(21, 22). Rising glucose levels have been associated with increased growth of S. aureus, MRSA, and P. aeruginosa(22), and murine models of CFRD have shown hyperglycemia leads to impaired lung bacterial clearance(13). In addition to increased bacterial colonization, exaggerated inflammatory responses may play a role, such as NF-kB-mediated inflammation activated by RAGE (receptor for advanced glycation end-products; irreversibly glycated proteins and lipids increased in aging, hyperglycemia, and states of oxidative stress) signaling(15). Therefore, hyperglycemia in CFRD may favor pathogenic bacterial growth and altered immune and inflammatory responses to infection. At the same time, P. aeruginosa may lead to increased glucose efflux through the airway epithelium in CF(23). Further research will be needed to elucidate whether these mechanisms are relevant to our findings during an acute exacerbation, whether poor glycemic control causally leads to worsened FEV1 recovery, or whether the elevated glycemic indices are instead a biomarker for worse acute disease. Additionally, although we analyzed only inpatient glucose levels, poor glycemic control could well be a surrogate for worse outpatient adherence to treatments and airway clearance. These patients could have worse acute inflammation that leads to both worse glucose levels and poor FEV1 recovery if not adequately treated.
Consistent with that, some of our results suggested that patients with CFRD and poor glycemic control who were fully treated in the hospital may have faster FEV1 recovery slopes (Table 2 and Figure 3) and a higher FEV1 at discharge (Supplementary Table S3). At the same time, we found no associations between HbA1c and any measure of acute FEV1 recovery, despite prior studies showing that it may be a good tool to evaluate long-term CFRD control(24). We speculate that, unlike the longer-term glycemic control reflected by HbA1c, in some of these patients the hyperglycemia seen during admission may represent an acute phase reactant, signaling acute inflammation and tissue damage that is more likely to respond to the intensive treatment received in the hospital. This would be consistent with a recent report that used continuous glucose monitoring (CGM) and described elevated overnight, fasting, and post-prandial glucose levels –as well as glucose area under the curve– in an adolescent with CFRD up to one week prior to being diagnosed with a pulmonary exacerbation(25). HbA1c has been shown to closely correlate with CGM levels in patients with CF(26), but that study did not include patients experiencing pulmonary exacerbations.
Strengths of this study include the detailed longitudinal data with several hospitalizations per patient with repeated measures of both meter glucose levels and FEV1 during each episode, all of which allowed us to evaluate patient-level and exacerbation-level characteristics associated with poor FEV1 recovery. At the same time, our study has several limitations. We focused on patients with CFRD because we hypothesized that they are the ones who will presumably benefit the most from acute glycemic control. We were unable to analyze data for patients with impaired fasting glucose (IFG), impaired glucose tolerance (IGT), or indeterminate status (INDET) due to small sample sizes; however, results for these groups would likely fall between NGT and CFRD, as decline in pulmonary function is known to precede the diagnosis of CFRD(5). We had a relatively small sample size for some of the subgroup analyzes. Moreover, there may have been patient-level characteristics and management decisions made that were not captured or accounted for in our analysis. Given the observational nature of the study, we cannot know if better glycemic control per se led to improved FEV1 recovery (i.e., if the association is causal), or if it simply acts as a surrogate/biomarker for worse disease; however, we adjusted for several clinical covariates and results remained unchanged. In our center, we generally avoid discharging patients on home IV antibiotics if there are concerns about adherence, and we usually monitor lung function weekly while on home IV treatments, but this may not be the practice in other centers. Finally, our study included a single treatment center and thus we could not adjust for center-level characteristics; results will need to be replicated before they can be generalized to other CF populations.
In summary, poor inpatient glycemic control in CFRD is associated with worse acute FEV1 recovery during exacerbations, particularly in patients who complete IV antibiotic treatment at home. We speculate that CFRD patients with poor glycemic control may benefit the most from hospital treatment, but that some may deteriorate faster if sent home early on. If replicated, these findings may have significant management implications for patients with CFRD.
Supplementary Material
HIGHLIGHTS.
In children with cystic fibrosis related diabetes, poor acute glycemic control during hospitalizations for pulmonary exacerbations was associated with lower FEV1 recovery.
The association was strongest and most consistent among children who completed IV antibiotic treatment at home.
In our analysis, hemoglobin A1c was not associated with FEV1 recovery at any point (discharge, end of IV antibiotics, or clinic follow-up).
If replicated, these results may have management implications for the management of acute exacerbations in patients with CFRD.
Funding:
Dr. Hughan’s contribution was partly funded by the CFF EnVision grant HUGHAN16GEO. Dr. Forno’s contribution was partly funded by U.S. National Institutes of Health (NIH) grant HL125666. The funding agencies had no role in study design, data collection or interpretation, writing of the report, or in the decision to submit the manuscript for publication.
Footnotes
Publisher's Disclaimer: This is a PDF file of an unedited manuscript that has been accepted for publication. As a service to our customers we are providing this early version of the manuscript. The manuscript will undergo copyediting, typesetting, and review of the resulting proof before it is published in its final form. Please note that during the production process errors may be discovered which could affect the content, and all legal disclaimers that apply to the journal pertain.
Competing interests: The authors have no competing interests to declare.
REFERENCES
- 1.O’Sullivan BP, Freedman SD. Cystic fibrosis. Lancet. 2009;373(9678):1891–904. [DOI] [PubMed] [Google Scholar]
- 2.Foundation CF. Cystic fibrosis foundation patient registry: 2017 annual data report 2018. 08/01/2019. Available from: https://www.cff.org/Research/Researcher-Resources/Patient-Registry/2017-Patient-Registry-Annual-Data-Report.pdf.
- 3.Sanders DB, Bittner RC, Rosenfeld M, Redding GJ, Goss CH. Pulmonary exacerbations are associated with subsequent FEV1 decline in both adults and children with cystic fibrosis. Pediatr Pulmonol. 2011;46(4):393–400. [DOI] [PubMed] [Google Scholar]
- 4.Moran A, Brunzell C, Cohen RC, Katz M, Marshall BC, Onady G, et al. Clinical care guidelines for cystic fibrosis-related diabetes: a position statement of the American Diabetes Association and a clinical practice guideline of the Cystic Fibrosis Foundation, endorsed by the Pediatric Endocrine Society. Diabetes Care. 2010;33(12):2697–708. [DOI] [PMC free article] [PubMed] [Google Scholar]
- 5.Moran A, Dunitz J, Nathan B, Saeed A, Holme B, Thomas W. Cystic fibrosis-related diabetes: current trends in prevalence, incidence, and mortality. Diabetes Care. 2009;32(9):1626–31. [DOI] [PMC free article] [PubMed] [Google Scholar]
- 6.Moheet A, Moran A. CF-related diabetes: Containing the metabolic miscreant of cystic fibrosis. Pediatr Pulmonol. 2017;52(S48):S37–S43. [DOI] [PubMed] [Google Scholar]
- 7.Kayani K, Mohammed R, Mohiaddin H. Cystic Fibrosis-Related Diabetes. Front Endocrinol (Lausanne). 2018;9:20. [DOI] [PMC free article] [PubMed] [Google Scholar]
- 8.Huang WQ, Guo JH, Zhang XH, Yu MK, Chung YW, Ruan YC, et al. Glucose-Sensitive CFTR Suppresses Glucagon Secretion by Potentiating KATP Channels in Pancreatic Islet alpha Cells. Endocrinology. 2017;158(10):3188–99. [DOI] [PubMed] [Google Scholar]
- 9.Moran A Cystic fibrosis-related diabetes: an approach to diagnosis and management. Pediatr Diabetes. 2000;1(1):41–8. [DOI] [PubMed] [Google Scholar]
- 10.Sequeiros IM, Jarad N. Factors associated with a shorter time until the next pulmonary exacerbation in adult patients with cystic fibrosis. Chron Respir Dis. 2012;9(1):9–16. [DOI] [PubMed] [Google Scholar]
- 11.Lewis C, Blackman SM, Nelson A, Oberdorfer E, Wells D, Dunitz J, et al. Diabetes-related mortality in adults with cystic fibrosis. Role of genotype and sex. Am J Respir Crit Care Med. 2015;191(2):194–200. [DOI] [PMC free article] [PubMed] [Google Scholar]
- 12.Parkins MD, Rendall JC, Elborn JS. Incidence and risk factors for pulmonary exacerbation treatment failures in patients with cystic fibrosis chronically infected with Pseudomonas aeruginosa. Chest. 2012;141(2):485–93. [DOI] [PubMed] [Google Scholar]
- 13.Hunt WR, Zughaier SM, Guentert DE, Shenep MA, Koval M, McCarty NA, et al. Hyperglycemia impedes lung bacterial clearance in a murine model of cystic fibrosis-related diabetes. Am J Physiol Lung Cell Mol Physiol. 2014;306(1):L43–9. [DOI] [PMC free article] [PubMed] [Google Scholar]
- 14.Schultz A, Stick S. Early pulmonary inflammation and lung damage in children with cystic fibrosis. Respirology. 2015;20(4):569–78. [DOI] [PubMed] [Google Scholar]
- 15.Hunt WR, Helfman BR, McCarty NA, Hansen JM. Advanced glycation end products are elevated in cystic fibrosis-related diabetes and correlate with worse lung function. J Cyst Fibros. 2016;15(5):681–8. [DOI] [PubMed] [Google Scholar]
- 16.Miller MR, Hankinson J, Brusasco V, Burgos F, Casaburi R, Coates A, et al. Standardisation of spirometry. Eur Respir J. 2005;26(2):319–38. [DOI] [PubMed] [Google Scholar]
- 17.Quanjer PH, Stanojevic S, Cole TJ, Baur X, Hall GL, Culver BH, et al. Multi-ethnic reference values for spirometry for the 3–95-yr age range: the global lung function 2012 equations. Eur Respir J. 2012;40(6):1324–43. [DOI] [PMC free article] [PubMed] [Google Scholar]
- 18.Allison DB, Paultre F, Maggio C, Mezzitis N, Pi-Sunyer FX. The use of areas under curves in diabetes research. Diabetes Care. 1995;18(2):245–50. [DOI] [PubMed] [Google Scholar]
- 19.Frost F, Dyce P, Nazareth D, Malone V, Walshaw MJ. Continuous glucose monitoring guided insulin therapy is associated with improved clinical outcomes in cystic fibrosis-related diabetes. J Cyst Fibros. 2018;17(6):798–803. [DOI] [PubMed] [Google Scholar]
- 20.Leclercq A, Gauthier B, Rosner V, Weiss L, Moreau F, Constantinescu AA, et al. Early assessment of glucose abnormalities during continuous glucose monitoring associated with lung function impairment in cystic fibrosis patients. J Cyst Fibros. 2014;13(4):478–84. [DOI] [PubMed] [Google Scholar]
- 21.Baker EH, Clark N, Brennan AL, Fisher DA, Gyi KM, Hodson ME, et al. Hyperglycemia and cystic fibrosis alter respiratory fluid glucose concentrations estimated by breath condensate analysis. J Appl Physiol (1985). 2007;102(5):1969–75. [DOI] [PubMed] [Google Scholar]
- 22.Brennan AL, Gyi KM, Wood DM, Johnson J, Holliman R, Baines DL, et al. Airway glucose concentrations and effect on growth of respiratory pathogens in cystic fibrosis. J Cyst Fibros. 2007;6(2):101–9. [DOI] [PubMed] [Google Scholar]
- 23.Garnett JP, Gray MA, Tarran R, Brodlie M, Ward C, Baker EH, et al. Elevated paracellular glucose flux across cystic fibrosis airway epithelial monolayers is an important factor for Pseudomonas aeruginosa growth. PLoS One. 2013;8(10):e76283. [DOI] [PMC free article] [PubMed] [Google Scholar]
- 24.Lam GY, Sissons S, Smith MP, Brown NE, Leung WM, Estey MP. How reliable is your HbA1c test? Revisiting the use of HbA1c in cystic fibrosis-related diabetes (CFRD) screening. J Cyst Fibros. 2019. [DOI] [PubMed] [Google Scholar]
- 25.Inman TB, Proudfoot JA, Lim M, Demeterco-Berggren C. Continuous glucose monitoring in a cystic fibrosis patient to predict pulmonary exacerbation? J Cyst Fibros. 2017;16(5):628–30. [DOI] [PubMed] [Google Scholar]
- 26.Chan CL, Hope E, Thurston J, Vigers T, Pyle L, Zeitler PS, et al. Hemoglobin A1c Accurately Predicts Continuous Glucose Monitoring-Derived Average Glucose in Youth and Young Adults With Cystic Fibrosis. Diabetes Care. 2018;41(7):1406–13. [DOI] [PMC free article] [PubMed] [Google Scholar]
Associated Data
This section collects any data citations, data availability statements, or supplementary materials included in this article.