Abstract
Recently, researchers have discovered the direct impact of the tumor mechanical environment on the growth, drug uptake and prognosis of tumors. While estimating the mechanical parameters (solid stress, fluid pressure, stiffness) can aid in the treatment planning and monitoring, most of these parameters cannot be quantified noninvasively. Shear wave elastography (SWE) has shown promise as a means of noninvasively measuring the stiffness of soft tissue. However, stiffness is still not a recognized imaging biomarker. While SWE has been shown to be capable of measuring tumor stiffness in humans, much important research is done in small animal preclinical models, where tumors are often too small for the resolution of traditional SWE tools. Single-track location SWE (STL-SWE) has previously been shown to overcome the fundamental resolution limit of SWE imposed by ultrasound speckle, which may make it suitable for preclinical imaging. Using STL-SWE, in this work, we demonstrate, for the first time, that the stiffness changes occurring inside metastatic murine pancreatic tumors can be monitored over long time scales (up to 9 weeks). To prevent the respiration motion from degrading the STL-SWE estimates, we developed a real-time software-based respiration gating scheme that we implemented on a Verasonics ultrasound imaging system. By imaging the liver of three healthy mice and performing correlation analysis, we confirmed that the respiration-gated STL-SWE data was free from motion corruption. By performing coregistered power-doppler imaging, we found that the local variability in liver shear wave speed (SWS) measurements increased from 5.4% to 9.9% due to blood flow. We performed a longitudinal study using a murine model of pancreatic cancer liver metastasis to assess the temporal changes (over nine weeks) in SWS in two groups: a controlled group receiving no treatment (n=8), and an experimental group (n=6) treated with Gemcitabine, a chemotherapy agent. We independently evaluated tumor burden using bioluminescence imaging (BLI). The initial and endpoint SWS measurements were statistically different (p<0.05). Additionally, when the liver SWS exceeded 2.5 ± 0.3 and 2.73 ± 0.34 m/s in untreated and treated mice, respectively, the death of the mice was imminent within approximately 10 days. The time taken for the SWS to exceed the thresholds was 17 days (on average) longer in Gemcitabine treated mice compared to the untreated ones. The survival statistics corroborated the effectiveness of Gemcitabine. Spearman correlation analysis revealed a monotonic relationship between SWE measurements (SWS) and BLI measurements (radiance) for tumors whose radiance exceeded 1 × 10⁷photons/s/cm2/sr. Longitudinal measurements on the liver of four healthy mice revealed a maximum coefficient of variation of 11.4%. The results of this investigation demonstrate that with appropriate gating, researchers can use STL-SWE for small animal imaging and perform longitudinal studies using preclinical cancer models.
Keywords: Shear wave elastography, Preclinical imaging, bioluminescence imaging, liver metastasis, respiration gating
I. Introduction
Recent studies have uncovered the direct impact of tumor mechanical properties (solid stress, interstitial fluid pressure, stiffness) on the growth, malignancy, and drug resistance of tumors [1], [2], [3], [4], [5]. While they are potential biomarkers for use in treatment planning, most of these parameters cannot be estimated non-invasively in-vivo. To date, stiffness is the only mechanical parameter that may be quantitatively mapped in tumors by using a technique known as shear wave elastography (SWE). However, establishing stiffness as a quantitative imaging biomarker is challenging. One key question that needs to be answered is how stiffness in tumors of different cancers evolve naturally or in response to different therapies. In order to validate stiffness as a cancer biomarker, extensive experiments on established preclinical models addressing this questions are required.
Although SWE is currently clinically available, it is challenging to use in pre-clincal small animal models of cancer. SWE [6], [7], [8] visualizes the shear modulus distribution within soft tissues by using acoustic radiation force to generate shear waves and ultrasound to track the propagating waves. Combining the estimated shear wave speed (SWS) with tissue density provide local measures of shear modulus. Although many clinical ultrasound systems provide SWE [9], transducers used in preclinical ultrasound imaging systems do not produce enough acoustic radiation force to generate shear waves. Currently, no commercially available preclinical system is capable of providing stiffness maps. Consequently, researchers use commercially available clinical SWE systems to perform in vivo animal studies [10], [11], [12], [13]. A major obstacle to using commercial systems to do preclinical imaging is the limited spatial resolution of the type of SWE they use [14].
Single-track location shear wave elastography (STL-SWE) [15] reduces speckle-bias that degrades the resolution of conventional SWE estimators. SWS is typically estimated by comparing the arrival time of shear waves at multiple points. However, differences in ultrasound speckle patterns introduce errors when estimating the arrival times [16]. A larger observation window or spatial averaging can reduce this problem, but these would lower the resolution of the resulting SWS maps [14]. An alternative is to employ STL-SWE, which tracks waves with a fixed set of speckles, thus reducing the uncertainty when estimating shear wave arrival times. Consequently, STL-SWE has the capability to image at higher resolution [14] which may make it a suitable modality for small animal imaging. However, a potential challenge of using STL-SWE in small animals is physiological motion. With some modifications to overcome the challenges of the preclinical imaging environment, STL-SWE may be able to accurately measure tumor stiffness in both the preclinical and clinical settings. Therefore, we could potentially use preclinical research to explore the use of stiffness as a clinical biomarker for precision medicine. Without adapting SWE to the preclinical environment, it would be expensive and time-consuming to study SWE for tumor tracking in a clinical environment alone.
In this work, we demonstrate that STL-SWE can be used to monitor changes in the stiffness of tumors occurring longitudinally (on the timescale of months). We developed a novel real-time respiration gating sequence to circumvent the physiological motion induced artifacts. The goal of this paper is two-fold. First, we describe a gating technique that we developed to adopt STL-SWE as an animal imaging modality. Second, using this technique, we assessed how shear modulus of murine liver metastasis of pancreatic ductal adenocarcinoma (PDAC) changes over time naturally and in response to chemotherapy. To our knowledge, this is the first reported study to show a correlation between stiffness and survival.
II. Methods
Background
Shear wave elastography (SWE) [8], [6], [7] is typically performed by transmitting long (approximately 200–600 microsecond) acoustic bursts to generate acoustic radiation force. The shear waves generated from these “push” pulses are tracked using diagnostic ultrasound pulses. By analyzing the propagation of these shear waves, a spatial map of shear wave speed (SWS) is constructed which is directly related to tissue shear modulus (μ = where μ is shear modulus, ρ is density and cs is SWS). The local SWS is estimated from the shear wave arrival time difference between two or multiple spatial locations. However, the speckle in the ultrasound tracking process causes biased estimates of these arrival time especially when the distance between observation locations are on the order of ultrasound speckle size [14], [16]. Although this bias is stationary at a given location, it can be minimized by averaging SWS values over an region-of-interest (ROI) or by using a larger observation kernel. However, doing so deteriorates the SWS image resolution. STL-SWE minimizes this problem by exchanging the push and tracking locations [15]. In this method, multiple push locations are serially excited and the shear waves from multiple push beams are tracked at a single location. Use of a fixed set of speckle effectively cancels out the effect of speckle size and overcomes the speckle-induced variation. Recently we [17] and others [18], [14], [19] have demonstrated that track beams simultaneously acquired by parallel beamforming can be used for estimation averaging since they effectively generate multiple synthetic datasets. Using coherently compounded plane wave imaging (CPW) [20], we recently demonstrated that the SWS variance provided by STL-SWEI can be significantly reduced [17]. We called this technique as plane wave based STL-SWE (pSTL-SWE). Although pSTL-SWE is well-suited for small animal imaging because it is a speckle-bias free low variance estimator, it is more susceptible to physiological motion (primarily respiration in the abdomen) due to longer total acquisition time compared to conventional SWE techniques. In this work, we developed a software-based automated respiration gating technique and integrated it in the pSTL-SWE pulse sequence to perform elastography on small animals.
Motion-gated pSTL-SWE
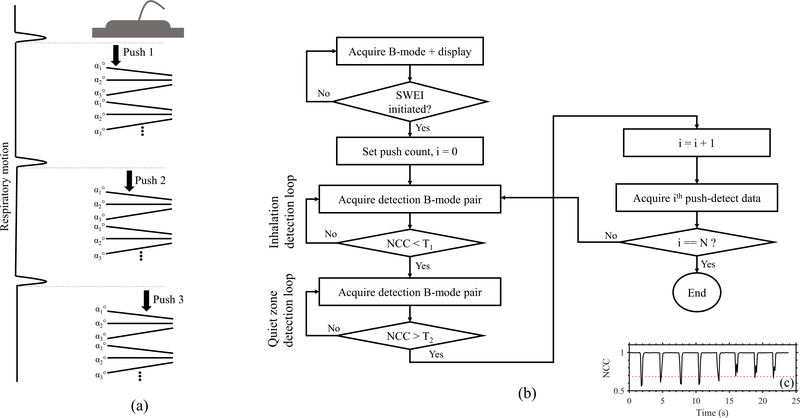
To mitigate motion artifacts when imaging free-breathing anesthetized mice, we implemented a respiration-gated plane wave single track location SWE (pSTL-SWE) [17] on a commercially available research ultrasound system (Vantage 256, Verasonics Inc., Kirkland, WA, USA). The pSTL-SWEI beam sequence consisted of multiple push beams at equal lateral intervals each followed by compounded plane wave imaging as illustrated in Fig. 1a. We acquired each push-detect ensemble of pSTL-SWEI within the quiet zone of a respiration cycle. We accomplished this by computing the normalized cross-correlation coefficient (NCC) in real-time from pairs of plane wave sonograms (Fig. 1b). The beginning of a respiration cycles occurs when the NCC is lower than a pre-defined threshold (T1) and quiet zone occurs when the NCC exceeds another pre-defined threshold (T2). We determined the optimum value of the thresholds (T1 and T2) by plotting the NCC over 25 seconds (Fig 1c). T1 represented the smallest decrease of NCC due to respiration motion over all observed cycles and T2 represented the mean value of NCC within the quiet zones. Detection of a quiet zone triggered the acquisition of a single push-detect ensemble. The default values for T1 and T2 were 0.9 and 0.99, respectively. Using these default values, we were able to trigger the ultrasound system in most cases. However, to enhance the robustness of the system, we computed the thresholds for each mouse as previously described (see Fig. 1(c)).
Fig. 1:
(a) Illustrating a respiration-gated pSTL-SWE sequence. Each push-detect ensemble, consisting of a push beam followed by a compounded plane wave tracking, is initiated following the inhalation and exhalation of the animal. From one push-detect to the next, the push line is laterally translated. (b) Flowchart illustrates the repiration triggering technique implemented on the Verasonics. (c) Representative repiration profile used to calibrate for the motion triggerring threshold parameters. The lowest amplitude reduction of NCC (dotted red line) was used as the threshold for detecting the beginning of a respiration cycle (T1). The mean NCC during the quiet zones was used as the threshold for detecting quiet zones (T2).
Animal study
Liver metastasis model
We purchased six to eight week old female C57BL/6J mice (n = 22) from Jackson Laboratory and maintained them in a pathogen-free facility under an animal studies protocol (UCAR-2016–024) approved by the Institutional Animal Care and Use Committee (IACUC) at University of Rochester Medical Center. We used an established murine model of PDAC liver metastasis [21], [22]. To create cancer model, we injected 4×10⁵ luciferase expressing murine pancreatic tumor cells (KCKO-luc) in the spleen of each animal. Briefly, in this model, we injected primary cancer cells into a manually occluded part of the spleen (hemispleen). After allowing the cells to diffuse in to the liver via hepatic veins, we surgically removed the occluded part of the spleen. We divided the animals into two groups comprising 11 animals each: the control group received no treatment; whereas those in the experimental group received 50mg/kg of Gemcitabine [23], administered by retro-orbital injection, twice per week for 6 weeks.
SWE imaging protocol
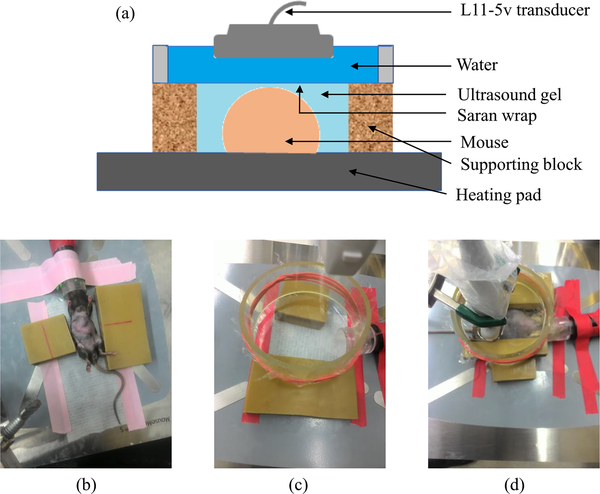
The livers of all 22 mice were imaged twice a week from day 10 post-injection to up to day 55 post-injection. Among these 22 mice, a subgroup of 10 mice (5 from each group) were used to study the survival. In this subgroup, we performed SWE beyond 55 days up to the demise of the animals. All animals were anesthetized with 3% isoflurane (Fluriso, VetOne, Boise, ID) and placed on a heated surgical bed before imaging in supine position (Fig. 2). We removed the abdominal hair of each mouse with Nair (Church and Dwight Co. Inc., Ewing, NJ) before applying ultrasound coupling gel to the shaved region. We performed all imaging through an acoustically transparent water-filled container (9 cm diameter by 3.5 mm height). To identify the anatomical region-of-interest (ROI), we performed real time compounded plane wave (CPW) imaging [20] (25 angles, −6° to 6°) integrated within the motion-gated pSTL-SWE sequence. We acquired elastograms (pSTL-SWE) from three transverse cross-sections within liver. We also acquired two additional pSTL-SWE data sets from the primary site (spleen and pancreas) of animals when a palpable tumor was detected in this region. Among the 12 mice that we imaged up to day 55, only seven (two untreated and five treated) were alive on day 55, and they were euthanized on day 56.
Fig. 2:
(a) Graphical illustration of the imaging system. (b)-(d) The system with a mouse, without a mouse, and during imaging, respectively.
Bioluminescence imaging (BLI)
To quantify temporal changes in tumor burden in both groups independent of elastography, we used a commercial system (IVIS Spectrum, PerkinElmer Inc., Waltham. MA) to acquire bioluminescence images twice a week for six weeks. All animals were anesthetized with 3% isoflurane before subcutaneous injections of 75mg/kg D-luciferin. Twelve minutes after the D-Luciferin injection, we performed BLI. We used the Living Image software (PerkinElmer Inc., Waltham. MA) to measure the average radiance (in photons/sec/cm2/sr). In all mice, we performed BLI up to 55 days post-injection.
Data analysis
Among the 22 mice, 15 mice died within the SWE imaging period. Among these 15 mice, one untreated mouse died after only two timepoint measurements. We analyzed the temporal change of SWS in liver on the remaining 14 mice (8 treated, 6 treated). For of each of these 14 mice, a SWS threshold (SWSthreshold) was determined as the midpoint between the initial (mean of first SWS measurements) and endpoint (mean of last three SWS measurements) measurements. In order to reduce the temporal variability of measurements, we applied a three-point running average mean to the temporal SWS measurements. Then, for each mouse, we determined the earliest timepoint when SWS exceeds the SWSthreshold. We also determined the time the animals were alive after the liver SWS exceeded SWSthreshold.
We also evaluated the correlation between the BLI and SWE measurements. Three mice from the treated group produced low radiance (<1×10⁵photons/s/cm2/sr), indicating insufficient cell injection and were excluded from all quantitative analysis in this work. For the remaining 19 mice, SWS and radiance measurements that were taken at similar timepoints were correlated using a Spearman rank test.
SWE data acquisition and processing
pSTL-SWE imaging
We used a 128 element linear array transducer (L11–5v, Verasonics, USA) to acquire pSTL-SWE data. The beam sequence (Fig 1a) consisted of 41 laterally spaced (0.3 mm apart) push beams covering a lateral distance of 1.2 cm. To acquire data from the entire depth of the abdominal cavity, we used the rapid multi-focal zone approach described in [8]. Specifically, each push consisted of four focal zones [8] located at scan depths of 10, 15, 20, and 25 mm. The push pulse duration at each focal zone was 150μs (total push time = 600μs). After each push beam (5 MHz), we used compounded plane wave imaging (10 MHz acquired from transmission angles of −1°, 0°, and 1°) to track the propagating shear waves [20]. Table S1 (in supplementary section) provides more details of the imaging parameters used in this study.
SWS reconstruction
We estimated shear wave motion from each push-detect data using 2D auto-correlation [24] and temporally filtered the wave signals using a second-order Butterworth band-pass filter (cutoffs between 50 Hz and 1 kHz). Push beams that were 0.9 mm (ΔP) apart were paired together. We analyzed shear waves from each pair of push beams at a single tracking location. Cross-correlation between the wave profiles provided an estimate of arrival time (ΔT) and consequently, the SWS (ΔP/ΔT). The SWS corresponding to each push pair was also estimated at different tracking locations. Weighted average (weight factor: square of normalized cross-correlation coefficient of wave pairs) of SWS estimates from multiple track locations provided the final SWS [17]. We excluded (a) track lines located outside the abdominal cavity, (b) track lines within 1.5 mm of the push beams, and (c) track locations whose peak NCC (between wave pairs) was less than 0.7 from the averaging set.
Assessing the effect of respiration motion on SWE
To evaluate the impact of respiration rate on elastographic imaging quality, we performed pSTL-SWE on three healthy mice with isoflurane concentrations of 2%, 3%, and 4%. For each isoflurane concentration, we acquired pSTL-SWE data with and without respiration gating. In the absence of external motion, a shear wave tracking frame (in B-mode form) from a given push-detect ensemble is highly correlated with frames from other push-detect ensembles (Supplementary section II). We used this property of shear wave tracking frames to detect the presence of external motion in acquired pSTL-SWE data. Specifically, we used a three-step procedure. First, we constructed cine-loops using the first tracking frames (in B-mode form) from each of the push-detect ensembles. Second, we selected a reference frame (often the first one) from the cine loop. Third, we computed NCC profiles by cross-correlating the reference frame and the remaining frames in the cine-loop. The presence of discontinuity in the NCC profile (See supplementary section II) indicated the push-detect ensembles corrupted with respiration motion. This NCC profile is different from the one used in the threshold selection process of respiration gating (Fig. 1c ) which was computed from shear wave-free B-modes.
Assessing the effect of vascular flow and perfusion on SWE
To evaluate the effect of vascular motion and perfusion on SWS maps, we assessed the temporal variability of SWS in regions with discernible vascular flow. We performed three pSTL-SWE acquisitions from the same liver cross-sections. To visualize the presence and/or absence of blood flow, we acquired power Doppler (PD) data before each SWE acquisition. We compute the PD signals from stacks of 200 IQ frames using CPW imaging (7 angles, 12 kHz PRF and 500 Hz post-compounded frame rate). To distinguish blood from tissue, we applied the singular value decomposition (SVD) method [25] to the IQ data stack. The spatial similarity matrix determined the optimum cutoff for truncating the SVD as described in [26]. For each mouse, we manually identified two regions within the liver for analyzing SWS variation: one without prominent vascular structures and one containing a strong PD signal.
Assessing the variance in longitudinal measurements using healthy controls
We evaluated the variability among longitudinal measurements using four healthy mice. We imaged the liver of these mice longitudinally at 6 timepoints spanning 22 days. For each mouse, we computed the mean SWS in the liver and finally, the temporal coefficient of variation (ratio of standard deviation to mean) of SWS.
III. Results
Respiration gating reduces artifacts incurred when performing pSTL-SWE on free-breathing mice
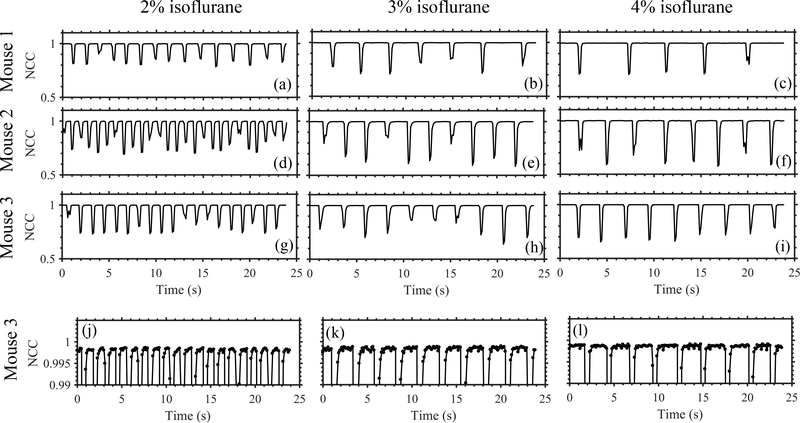
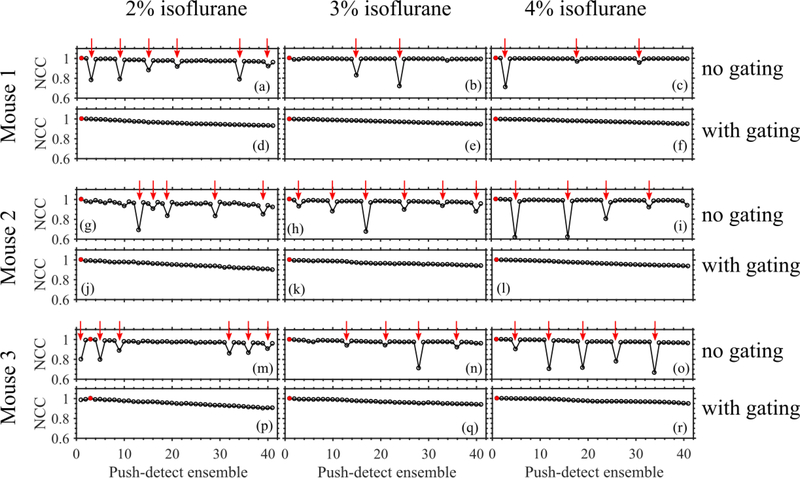
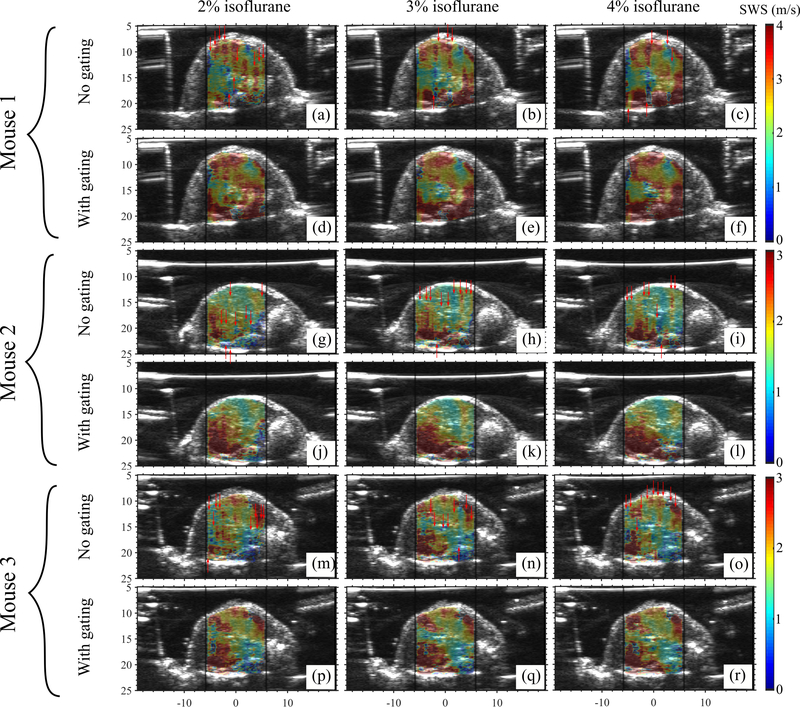
Figure 3 shows the representative temporal variation of NCC of consecutive B-mode frames obtained when we anesthetized animals with different amounts of isoflurane. Isoflurane concentration influenced respiration rate, which in turn governed the duration of the quiet zone. Figure 4 shows NCC profiles of pSTL-SWE ensembles acquired with and without respiration gating. Performing pSTL-SWE without gating produced unstable profiles (Fig. 4(a,b,c,g,h,i,m,n,o))–abrupt jumps were visible at distinct push-detect events. Profiles obtained when performing pSTL-SWE with gating were stable, but the magnitude of the NCC decreased smoothly with increasing push-detect events (Fig. 4(d,e,f,j,k,l,p,q,r)), owing only to shear wave motion. Figure 5 shows the corresponding SWS maps obtained with and without respiration gating. Vertical stripes were discernible in SWS elastograms acquired without gating (see Fig. 5(a,b,c,g,h,i,m,n,o)), corresponding to push-detect events with discontinuities in NCC profiles.
Fig. 3:
Respiration rate analysis on three mice at different anesthetic levels using B-mode cross-correlation. Motion due to inhalation and exhalation appeared as reductions in temporal NCC profiles. Increasing the anesthetic level decreased the respiration rate and increased the duration of quiet zones in respiration cycles. Plots (g)-(i) are reproduced in (j)-(l), respectively, with a smaller y-axis range to visualize the variation in NCC within the quiet zones.
Fig. 4:
Illustrating the presence of motion in the SWE data from three free-breathing mice. The NCC profile was computed by performing cross-correlation between the first tracking frame (in B-mode form) of a motion-free push-detect ensemble (marked with a red circle) and the first frames of the remaining push-detect ensembles. The gated acquisitions exhibited smooth decay in the NCC profiles while the gating-free acquisitons exhibited reductions in temporal NCC. The push-detect ensembles with low NCC were identified (marked with red arrows) and used to isolate the corresponding motion-corrupted columns in the SWS maps (in Figure 5).
Fig. 5:
Elastograms of the livers of three mice obtained using pSTL-SWE without repiration gating and with respiration gating. Images in (a)-(r) correspond to the SWE acquisitions shown in Figure 4 (a)-(r), respectively. Images were obtained using 2%, 3%, and 4% isoflurane. For each mouse, the images were acquired from a fixed cross-section within the liver. The columns in the elastograms that were reconstructed from the motion-corrupted push-detect events (from Figure 4) are indicated with red vertical arrows.
Vascular motion increased the measurement variability from 5.38% to 9.93%
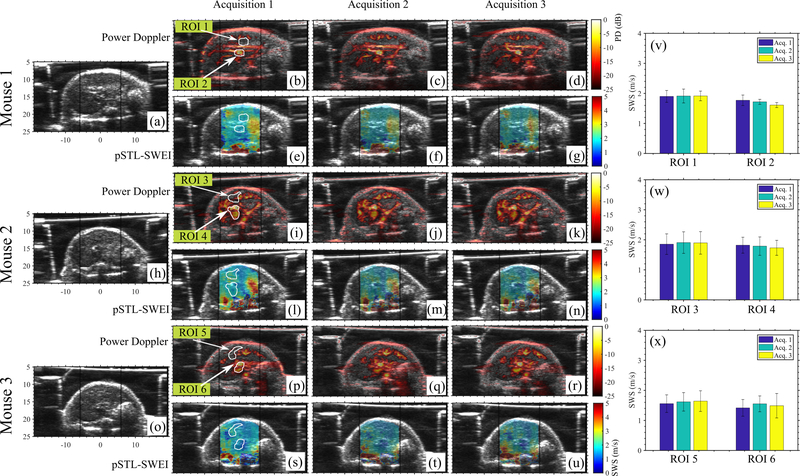
Figure 6 shows representative examples of SWS maps (Fig. 6 e–g, l–n, s–u, respectively) and Power Doppler images (Fig. 6 b–d, i–k, p–r, respectively) obtained from three mice. PD images revealed vasculature within the liver; however, this had no visual impact on the spatial variation of SWS. Additionally, we quantified the local difference among temporal SWS measurements near large vessels where we expected strong cardiac motion, and vessel-free regions within the liver (Fig. 6 v–x). Specifically, maximum SWS variation among temporal measurements within vessel-free and vascular-regions was 5.38% and 9.93%, respectively.
Fig. 6:
Shows the results of repeated acquisitions from three mice. B-modes, power doppler images and pSTL-SWE elastograms are shown for three mice in (a)-(u). To evaluate temporal variability, two ROIs were selected for each mouse: one within a relatively vessel-free region and one containing strong PD signal. The white arrows indicate the ROIs. The mean SWS within these ROIs over three acquisitions are shown in (v)-(x) for Mouse 1–3, respectively.
The pSTL-SWE can detect longitudinal changes in SWS of murine metastatic liver
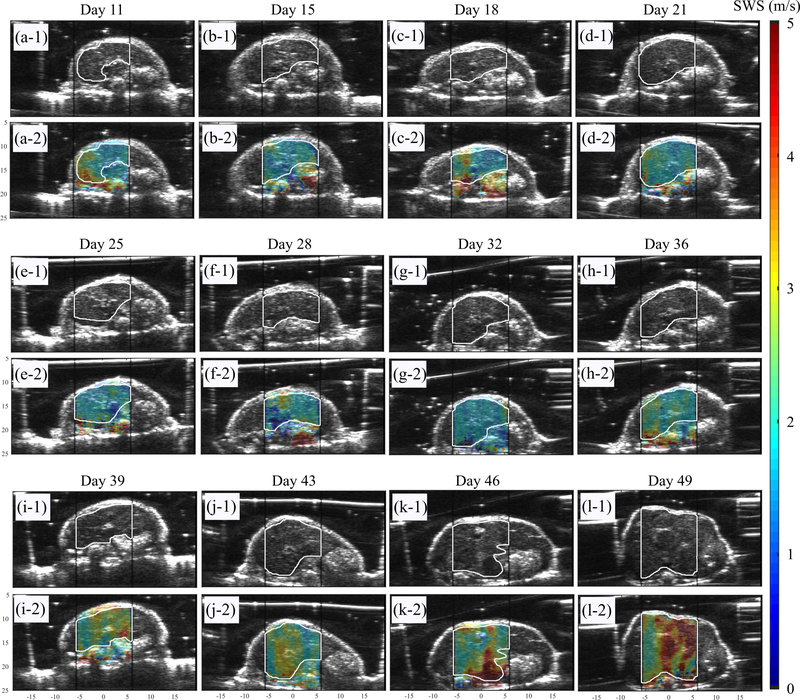
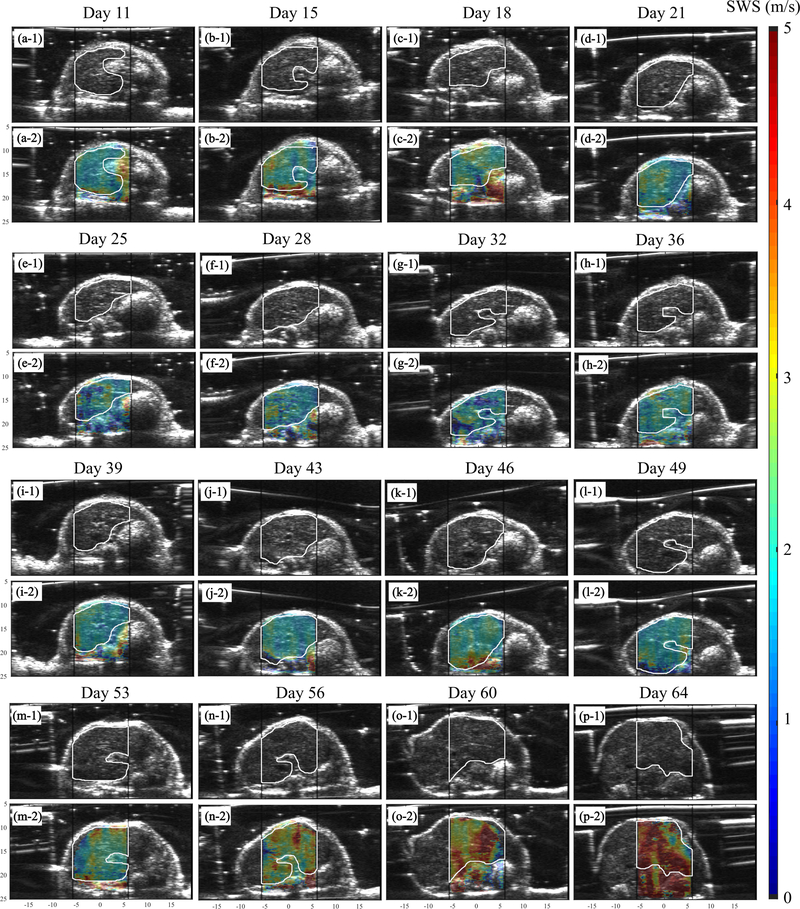
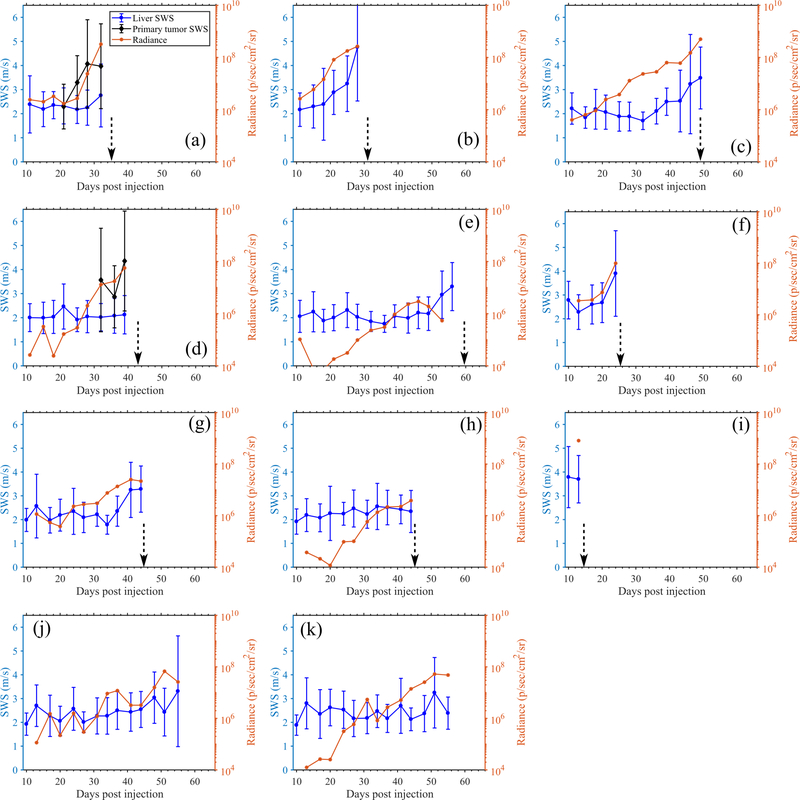
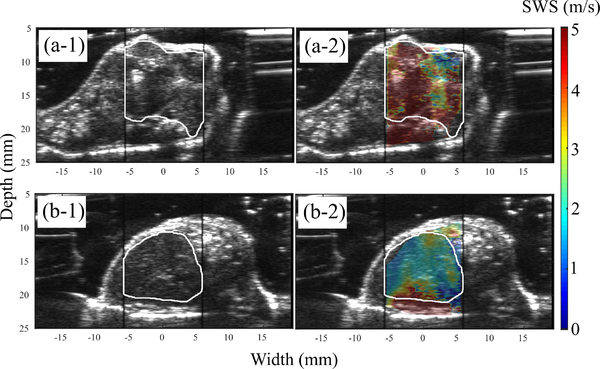
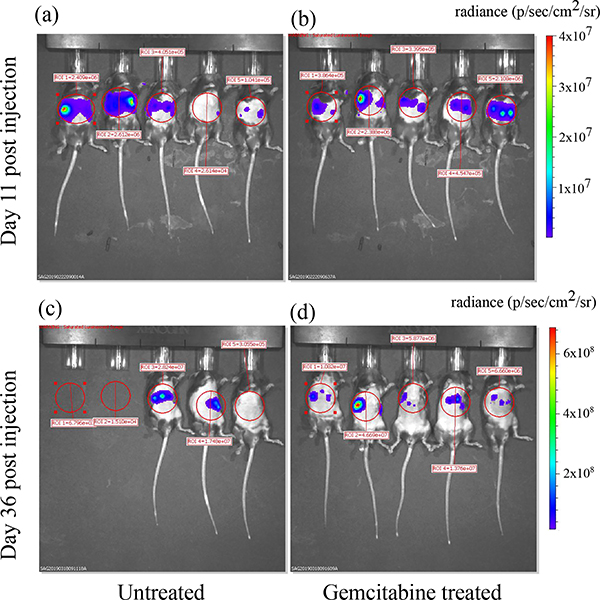
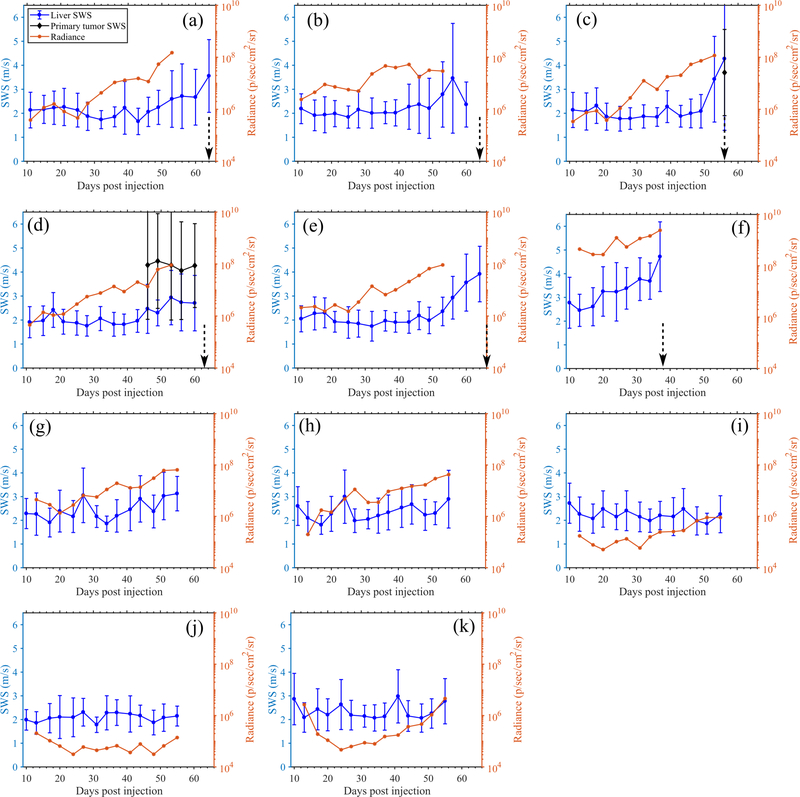
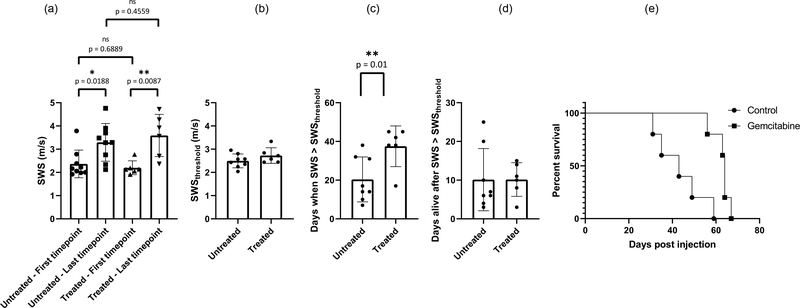
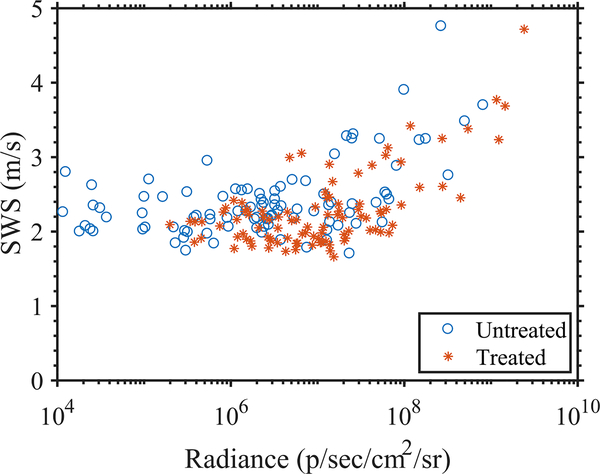
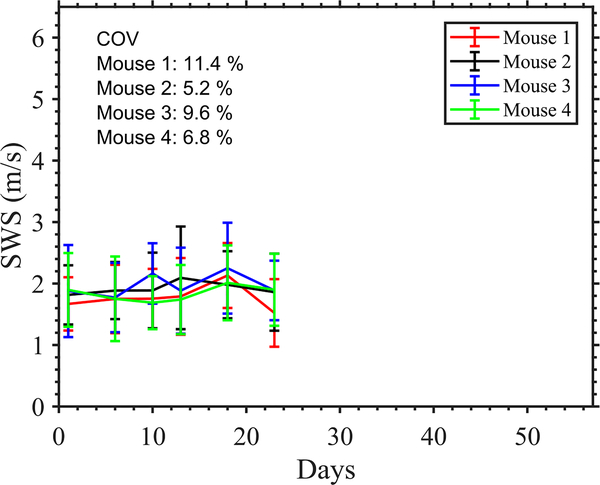
To evaluate the performance of preclinical pSTL-SWE, we used a murine model of pancreatic cancer liver metastases to assess the temporal changes in SWS and tumor burden in two groups of mice: untreated and those undergoing chemotherapy. Fig 7 and 8 shows representative images (sonograms and SWS maps) obtained from the control and the experimental group, respectively. The stomach is discernible in the sonograms as a hyperechoic region and in the SWS map as a heterogeneous structure. Reverberation from the imaging bed and spinal architectures produced noisy SWS estimates in posterior regions of the liver. In general, SWS estimates were similar for the earlier time-points (days 11–36 in Fig 7 and 11-49 in Fig 8) then increased rapidly. For some animals, tumors were visible in the primary site (spleen and pancreas). Figure 9 shows representative images (sonograms and SWS maps) obtained from an animal with a primary tumor. Figure 10 shows representative radiance images obtained 11 and 36 days post-injection from both groups of animals. Figures 11 and 12 show plots of SWS and radiance plotted as functions of time (days post-injection) for the controlled and experimental groups, respectively. For most animals in the control group, radiance increased with time, whereas SWS remain relatively constant for most time-points, then increased rapidly. The experimental group displayed a similar trend; however, SWS and radiance increased more slowly. SWS measured at the first and last time-points were significantly different (p<0.05, see Fig. 13a). To quantitatively evaluate the temporal trend of liver SWS, we estimated a SWS threshold (SWSthreshold) for each mouse as the midpoint between the initial (mean of first three) and endpoint (mean of last three) SWS measurements. We found that SWSthreshold was 2.5 ± 0.3 m/s and 2.73 ± 0.34 m/s for control and treated mice, respectively (Fig. 13b). The liver SWS of the mice exceeded SWSthreshold in 20.4 ± 11.6 and 37.5 ± 10.5 days for control and treated groups, respectively (statistically significant difference, p<0.05) (Fig. 13c). After the liver SWS exceeded SWSthreshold, the mice were alive for 10.1 ± 8 and 10.2 ± 4.4 days in control and treated groups, respectively (Fig. 13d). The survival curve also confirmed that the treated mice survived longer than the untreated ones (Fig. 13e). BLI and SWS measurements were correlated only in mice with high tumor burden (Fig. 14). Quantitatively, Spearman correlation analysis (Table I) shows revealed a monotonic relationship exist between SWS and radiance only for tumors whose radiance exceeded 1×10⁷photons/s/cm2/sr). The variance of longitudinal measurements was evaluated on four healthy mice. The coefficient of variation ranged from 5.2% to 11.4% (Fig. 15).
Fig. 7:
B-mode and overlaid SWS maps for an untreated mouse at all observed time points up to demise. The black vertical lines indicate the push beam transmission region that was used to facilitate the selection of the ROI during the imaging session. The white lines that were manually traced from the B-mode images indicate the liver region used in the statistical analysis.
Fig. 8:
B-mode and overlaid SWS maps for a mouse treated with Gemcitabine at all observed time points up to demise. The black vertical lines indicate the push beam transmission region that was used to facilitate the selection of the ROI during the imaging session. The white lines that were manually traced from the B-mode images indicate the liver region used in the statistical analysis.
Fig. 11:
Quantitative longitudinal measurements obtained from the untreated mice using pSTL-SWEI and BLI. Results show the SWS of the liver, SWS of primary tumors ((a) and (d) only) and radiance measured in the abdomen. In SWS measurements, the errorbar indicate the spatial standard deviation of SWS. The dotted vertical arrows indicate the time of death.
Fig. 9:
(a) B-mode and overlaid elastogram of a primary tumor. (b) the correponding B-mode and elastogram obtained from the liver of the same mouse.
Fig. 10:
Radiance maps obtained from BLI overlaid on the photographs of the animals at two time points. Images were generated the by the Living Image software (ParkinElmer Inc., Waltham, MA) used to operate the IVIS Spectrum system. The red circles indicate the ROIs used to calculate the mean radiance.
Fig. 12:
Quantitative longitudinal measurements obtained from the Gemcitabine treated mice using pSTL-SWEI and BLI. Results show the SWS of the liver, SWS of primary tumors ((c) and (d) only) and radiance measured in the abdomen. In SWS measurements, the errorbar indicate the spatial standard deviation of SWS. The dotted vertical arrows indicate the time of death. Mice corresponding to (i)-(k) were excluded from statistical analysis due to insufficient cell injection.
Fig. 13:
(a) SWS measured at the first timepoint (pre-treatment) and immediately before death for untreated and Gemcitabine treated mice. (b) shows the SWSthreshold computed as the mean of initial (mean of first three) and endpoint (mean of last three) SWS measurements for untreated and treated mice. (c) shows the time taken for the SWS measurements to exceed SWSthreshold values. (d) shows the duration over which the mice from both groups were alive once the SWS measurements exceeded SWSthreshold. (e) Survival statistics (n=10) shows that Gemcitabine prolonged the life of the mice.
Fig. 14:
Scatterplot showing the paired SWS and radiance measaurements obtained using pSTL-SWEI and BLI aggregated from all time points in 19 mice.
TABLE I:
Spearman correlation coefficient between SWS and radiance. Analysis was performed on (a) paired SWS and radiance measurements on all time points and (b) only on measurements with high tumor burden (radiance > 1×10⁷photons/s/cm2/sr)
| Untreated mice | Treated mice | |
|---|---|---|
| (a) All measurements | 0.6141 | 0.2334 |
| (b) Measurements with high tumor burden | 0.8147 | 0.5413 |
Fig. 15:
Longitudinal SWS measurements in healthy livers of four mice. Coefficient of variation (COV) of the measurements are indicated in the plot.
IV. Discussion
This paper describes a pSTL-SWE system for imaging the mechanical properties of free-breathing anesthetized rodents in vivo. To minimize the impact of respiration motion, we implemented an automatic respiration-gating sequence on a Verasonics system. To validate the technique, we performed studies on animals anesthetized with different concentrations of isoflurane. Using a murine pancreatic cancer metastatic model and the respiration-gated pSTL-SWE imaging system, we assessed the temporal variation of SWS in two groups of animals: a controlled untreated group, and a chemotherapy (Gemcitabine) treated group. Respiration produced vertical stripe artifacts in pSTL-SWE elastograms, which respiration-gating minimized (Fig. 5). For abdominal imaging (liver or pancreas), cardiac motion increases variability of SWS measurements from 5.4% to 9.9% (Fig. 6). When SWS measurements exceeded 2.5 m/s and 2.73 m/s in treated and untreated mice, respectively, death was imminent within approximately 10 days (Fig. 13). On tumors with high burden, there was a monotonic relationship between radiance and SWS, as indicated by the Spearman rank correlation (Table I). Chemotherapy did not cure the animals of liver metastases, but rather it slowed down the disease progression that, in turn, caused the animals to live longer (Fig. 13(d)).
Respiration motion is a problem in STL-SWE because it introduces errors in SWS estimates. High-pass [27] and polynomial filters [28] can remove unwanted motion incurred during in vivo acoustic radiation force impulse imaging (ARFI) and MTL-SWE. However, filters are not a viable approach for minimizing motion artifacts incurred during STL-SWE because STL-SWE requires a priori information of push-location, and tissue motion creates uncertainty in the estimation of push location. Breath-hold imaging can minimize motion artifacts in human [29], [30]; however, breath-hold animal imaging requires specialized equipment [31]. Researchers have developed dedicated systems to reduce respiration motion [32]. Payen et al. used a similar system to trigger their harmonic motion imaging system [33]. Figure 5 demonstrates that software gating can reduce motion artifacts incurred when performing STL-SWE imaging in free-breathing anesthetized animals. Although cardiac motion can pose a problem, this is not an issue for abdominal imaging (Fig. 6). By using cross-correlation analysis (Fig. 4), we confirmed that the gated data from pSTL-SWE were free of respiration motion. To assess how motion impacts the bias and variance of SWS, we performed phantom studies (see supplementary section). The results of this study revealed that, for elastically homogeneous materials, motion influenced the bias when estimating SWS with STL-SWE negligibly, but impacted variance profoundly.
Motion estimation algorithms in ultrasound often rely on the evaluation of NCC as a spatial map [34]. However, for real-time respiration gating, we are only interested in the detection of the presence or absence of motion rather than the magnitude and direction of motion. Consequently, we only evaluated the global NCC of a pair of images at zero-lag. This resulted in a fast detection of motion which was crucial to real-time implementation. Bottenus et al. previously demonstrated that the temporal cross-correlation coefficient (in aperture domain) correlates well with the periodic tissue motion [35]. Additionally, we detected global tissue motion rather than local motion because respiration motion was largely global in mice abdomen, likely due to proximity to the lung. However, for organs where motion is localized, local correlation may be adopted. In a few cases, involuntary and continuous aperiodic motion of intestines posed a challenge to the respiration gating. This issue occurred particularly while imaging in the lower abdomen. Such motion caused reduced and widely variable rest state correlation of images (the T2 threshold) and resulted in missed triggering for certain respiration beats. We solved this problem by using prolonged exposure to anesthesia (imaging started after 5–8 minutes of anesthesia) which reversibly arrested the intestinal motion. Another concern while implementing the triggering was any potential transient behavior of B-mode correlations. However, we did not observe any transient drop of correlation below T1 outside the inhalation-exhalation zone, which could potentially lead to false triggering.
STL-SWE is better suited for small animal imaging than MTL-SWE. Rouze et al. demonstrated that resolution of shear wave elastograms is highly dependent on the kernel size used for processing [36]. Speckle bias, determined by speckle size, prevents MTL-SWE from employing very small kernels [14]. Although high frequency preclinical transducers have smaller speckle size, they are not designed for radiation force applications. Thus, researchers have often used separate transducers for generating and tracking shear waves [37], [38] in rodents. STL-SWE can utilize sub-millimeter kernels with clinically available transducers [14], which was confirmed in this study.
Researchers have used elastography to measure stiffness changes in murine cancers models [39], [40], [10], [13], [41]; however, to our knowledge, this is the first reported study to use elastography to assess the temporal changes in pancreatic cancer liver metastases [42]. Gemcitabine, FOLFIRINOX (a chemotherapy cocktail consisting of 5-fluorouracil, irinotecan, leucovorin, and oxaliplatin), and Erlotinib have extended the life expectancy of metastastic pancreatic cancer patients [43], albeit marginally or with severe side effects. The pancreatic cancer microenvironment (high stromal density, high total tissue pressure, leaky vasculature, and elevated levels of hyaluronic acid) inhibits the delivery of chemotherapy agents [44], [45], [46]. Recently, we demonstrated that the collagen density and hyaluronic acid affect tissue stiffness [12]. We also demonstrated a direct correlation between tumor stiffness and drug delivery [5]. In the present work, we demonstrated for the first time using imaging, that there is a high correlation between low SWS and survival in mice with pancreatic cancer liver metastasis. Specifically, when liver SWS increased beyond 2.5 ± 0.3 m/s and 2.73 ± 0.34 m/s, death of the mice was imminent within 10.1 ± 8 and 10.2 ± 4.4 days for untreated and Gemcitabine treated mice, respectively. We plan to conduct studies to further investigate if this is also true for humans.
Bioluminescence imaging is a standard research tool used to assess tumor burden [47]. The results of this investigation revealed that BLI is more sensitive to changes in the tumor than SWE–in most cases, radiance increases almost linearly as the tumor progresses which was not the case for SWS. In tumors with high burden, there was a monotonic relationship between radiance and SWS as indicated by Spearman rank correlation (Table I). We anticipated that BLI would be more sensitive to changes with tumors than SWE because it is a molecular imaging technique whereas SWE is not. While the BLI informs about cancer cell count, the SWE provides structural information about the tumor microenvironment. Thus, the information provided by SWE is complimentary to BLI and may improve the pre-clinical assessment of tumor models. Additionally, the insights obtained by SWE can be directly translated to human imaging, which is not the case for BLI. It is, however, not known whether the delayed onset of SWS increase corresponds to a delayed mechanical change in the liver, or is simply due to the limited ability of SWE to detect smaller temporal changes in SWS. It is possible that the temporal variation in SWS measurements (up to 11.4% coefficient of variation in healthy livers) may obfuscate the smaller or more subtle changes in SWS. Improvement in pulse-sequencing techniques such as stronger push pulses may improve the SWS variance [48]. Additionally, refinement of acquisition and data analysis protocols, such as longitudinally registered local analysis [49], may help improve the temporal variance in SWS measurements. We plan to conduct a future study to understand the sources of variance in temporal SWS measurements. Furthermore, we expect that the use of optical modalities with cellular sensitivity for shear wave tracking [50] may improve the sensitivity of SWE to changes within tumor. To reduce the temporal variance, we have applied a three-point mean filter to the longitudinal SWS measurements (Fig. 13(a–d), while the plots in Fig. 11 and 12 show unfiltered data). However, the filter was not causal.
The current study has two main limitations. One potential limitation is the mismatch in spatial registration between different timepoint measurements. Throughout the study, we attempted to minimize this error by utilizing the real-time B-mode guidance and spatial landmarks within the liver. However, there is no guarantee that we imaged exactly the same cross-sections over multiple timepoints. To further minimize this problem, we plan to use either a stereotactic rodent holder [51] or a matrix array [52] in future studies. Another limitation is that we performed no histological analysis, therefore we were unable to assess how well temporal changes in histological features correlate with temporal changes in SWS. To address this issues, we are currently conducting an in vivo study to assess how SWS correlates with histological and immunofluorescence analyses of the tumor microenvironment. Additionally, a limitation of the animal model used is that it does not accurately represent the disease process occurring in humans (i.e., the model typically only produces the secondary tumors (metastatic)). Researchers have tried to develop models that produce both primary and secondary pancreatic cancer, but the diseases process is unpredictable in mice. Consequently, in this study we used a simplified and controllable pancreatic cancer liver metastasis model [22], [21]. Specifically, we injected the primary pancreatic cancer cells into the spleen which diffuse into the liver via the blood stream and thus generally do not produce tumors in the pancreas. To overcome this limitation we plan to perform studies with genetically engineered mice that more closely replicate the molecular phenotype of human pancreatic cancer.
V. Conclusions
This work demonstrates that with appropriate gating techniques, researchers can use pSTL-SWE in preclinical imaging. Specifically, we demonstrated that the proposed method (respiration gated-pSTL-SWE) can assess changes in shear modulus of long time scales (months). We also demonstrated for the first time using imaging, that there is a high correlation between low SWS and animal survival for pancreatic liver metastases.
Supplementary Material
Acknowledgments
This work was supported by National Institute of Health grant R56 EB024320.
Contributor Information
Rifat Ahmed, Electrical and Computer Engineering, University of Rochester, NY, USA.
Jian Ye, Department of Surgery, University of Rochester Medical Center, NY, USA.
Scott A. Gerber, Department of Surgery, University of Rochester Medical Center, NY, USA
David C. Linehan, Department of Surgery, University of Rochester Medical Center, NY, USA
Marvin M. Doyley, Electrical and Computer Engineering, University of Rochester, NY, USA.
References
- [1].Nia HT, Munn LL, and Jain RK, “Mapping physical tumor microenvironment and drug delivery,” Clinical Cancer Research, vol. 25, no. 7, pp. 2024–2026, January 2019. [DOI] [PMC free article] [PubMed] [Google Scholar]
- [2].Nia HT, Liu H, Seano G, Datta M, Jones D, Rahbari N, Incio J, Chauhan VP, Jung K, Martin JD, Askoxylakis V, Padera TP, Fukumura D, Boucher Y, Hornicek FJ, Grodzinsky AJ, Baish JW, Munn LL, and Jain RK, “Solid stress and elastic energy as measures of tumour mechanopathology,” Nature Biomedical Engineering, vol. 1, no. 1, November 2016. [DOI] [PMC free article] [PubMed] [Google Scholar]
- [3].Provenzano PP, Cuevas C, Chang AE, Goel VK, Hoff DDV, and Hingorani SR, “Enzymatic targeting of the stroma ablates physical barriers to treatment of pancreatic ductal adenocarcinoma,” Cancer Cell, vol. 21, no. 3, pp. 418–429, March 2012. [DOI] [PMC free article] [PubMed] [Google Scholar]
- [4].Stylianopoulos T, Martin JD, Chauhan VP, Jain SR, Diop-Frimpong B, Bardeesy N, Smith BL, Ferrone CR, Hornicek FJ, Boucher Y, Munn LL, and Jain RK, “Causes, consequences, and remedies for growth-induced solid stress in murine and human tumors,” Proceedings of the National Academy of Sciences, vol. 109, no. 38, pp. 15 101–15 108, August 2012. [DOI] [PMC free article] [PubMed] [Google Scholar]
- [5].Wang H, Mislati R, Ahmed R, Vincent P, Nwabunwanne SF, Gunn JR, Pogue BW, and Doyley MM, “Elastography can map the local inverse relationship between shear modulus and drug delivery within the pancreatic ductal adenocarcinoma microenvironment,” Clinical Cancer Research, vol. nil, no. nil, p. clincanres.2684.2018, 2018. [Online]. Available: 10.1158/1078-0432.ccr-18-2684 [DOI] [PMC free article] [PubMed] [Google Scholar]
- [6].Sarvazyan AP, Rudenko OV, Swanson SD, Fowlkes, and Emelianov SY, “Shear wave elasticity imaging: a new ultrasonic technology of medical diagnostics,” Ultrasound in Medicine & Biology, vol. 24, no. 9, pp. 1419–1435, 1998. [Online]. Available: 10.1016/s0301-5629(98)00110-0 [DOI] [PubMed] [Google Scholar]
- [7].Nightingale K, McAleavey S, and Trahey G, “Shear-wave generation using acoustic radiation force: in vivo and ex vivo results,” Ultrasound in medicine biology, vol. 29, no. 12, pp. 1715–1723, 2003. [DOI] [PubMed] [Google Scholar]
- [8].Bercoff J, Tanter M, and Fink M, “Supersonic shear imaging: a new technique for soft tissue elasticity mapping,” IEEE transactions on ultrasonics, ferroelectrics, and frequency control, vol. 51, no. 4, pp. 396–409, 2004. [DOI] [PubMed] [Google Scholar]
- [9].Shiina T, Nightingale KR, Palmeri ML, Hall TJ, Bamber JC, Barr RG, Castera L, Choi BI, Chou Y-H, Cosgrove D, Dietrich CF, Ding H, Amy D, Farrokh A, Ferraioli G, Filice C, Friedrich-Rust M, Nakashima K, Schafer F, Sporea I, Suzuki S, Wilson S, and Kudo M, “Wfumb guidelines and recommendations for clinical use of ultrasound elastography: Part 1: Basic principles and terminology,” Ultrasound in Medicine & Biology, vol. 41, no. 5, pp. 1126–1147, 2015. [Online]. Available: 10.1016/j.ultrasmedbio.2015.03.009 [DOI] [PubMed] [Google Scholar]
- [10].Chang JM, Park IA, Lee SH, Kim WH, Bae MS, Koo HR, Yi A, Kim SJ, Cho N, and Moon WK, “Stiffness of tumours measured by shear-wave elastography correlated with subtypes of breast cancer,” European Radiology, vol. 23, no. 9, pp. 2450–2458, May 2013. [DOI] [PubMed] [Google Scholar]
- [11].Therville N, Arcucci S, Vertut A, Ramos-Delgado F, Mota DFD, Dufresne M, Basset C, and Guillermet-Guibert J, “Experimental pancreatic cancer develops in soft pancreas: novel leads for an individualized diagnosis by ultrafast elasticity imaging,” Theranostics, vol. 9, no. 22, pp. 6369–6379, 2019. [DOI] [PMC free article] [PubMed] [Google Scholar]
- [12].Wang H, Nieskoski MD, Marra K, Gunn JR, Trembly SB, Pogue BW, and Doyley MM, “Elastographic assessment of xenograft pancreatic tumors,” Ultrasound in Medicine Biology, September 2017. [Online]. Available: 10.1016/j.ultrasmedbio.2017.08.008 [DOI] [PMC free article] [PubMed] [Google Scholar]
- [13].Seguin J, Mignet N, Ossa HL, Tanter M, and Gennisson J-L, “Evaluation of antivascular combretastatin a4 p efficacy using supersonic shear imaging technique of ectopic colon carcinoma CT26,” Ultrasound in Medicine & Biology, vol. 43, no. 10, pp. 2352–2361, October 2017. [DOI] [PubMed] [Google Scholar]
- [14].Hollender PJ, Rosenzweig SJ, Nightingale KR, and Trahey GE, “Single-and multiple-track-location shear wave and acoustic radiation force impulse imaging: matched comparison of contrast, contrast-to-noise ratio and resolution,” Ultrasound in medicine biology, vol. 41, no. 4, pp. 1043–1057, 2015. [DOI] [PMC free article] [PubMed] [Google Scholar]
- [15].Elegbe EC and McAleavey SA, “Single tracking location methods suppress speckle noise in shear wave velocity estimation,” Ultrasonic imaging, vol. 35, no. 2, pp. 109–125, 2013. [DOI] [PMC free article] [PubMed] [Google Scholar]
- [16].McAleavey SA, Osapoetra LO, and Langdon J, “Shear wave arrival time estimates correlate with local speckle pattern,” IEEE transactions on ultrasonics, ferroelectrics, and frequency control, vol. 62, no. 12, pp. 2054–2067, 2015. [DOI] [PMC free article] [PubMed] [Google Scholar]
- [17].Ahmed R, Gerber SA, McAleavey SA, Schifitto G, and Doyley MM, “Plane wave imaging improves single track location shear wave elasticity imaging,” IEEE Transactions on Ultrasonics, Ferroelectrics, and Frequency Control, vol. nil, no. nil, pp. 1–1, 2018. [Online]. Available: 10.1109/tuffc.2018.2842468 [DOI] [PMC free article] [PubMed] [Google Scholar]
- [18].Hollender P, Lipman SL, and Trahey GE, “Three-dimensional single-track-location shear wave elasticity imaging,” IEEE Transactions on Ultrasonics, Ferroelectrics, and Frequency Control, vol. 64, no. 12, pp. 1784–1794, 2017. [Online]. Available: 10.1109/tuffc.2017.2749566 [DOI] [PMC free article] [PubMed] [Google Scholar]
- [19].Hollender P, Kuo L, Chen V, Eyerly S, Wolf P, and Trahey G, “Scanned 3-d intracardiac arfi and swei for imaging radio-frequency ablation lesions,” IEEE Transactions on Ultrasonics, Ferroelectrics, and Frequency Control, vol. 64, no. 7, pp. 1034–1044, 2017. [Online]. Available: 10.1109/tuffc.2017.2692558 [DOI] [PMC free article] [PubMed] [Google Scholar]
- [20].Montaldo G, Tanter M, Bercoff J, Benech N, and Fink M, “Coherent plane-wave compounding for very high frame rate ultrasonography and transient elastography,” IEEE Transactions on Ultrasonics, Ferroelectrics and Frequency Control, vol. 56, no. 3, p. 489–506, March 2009. [Online]. Available: 10.1109/TUFFC.2009.1067 [DOI] [PubMed] [Google Scholar]
- [21].Mills BN, Connolly KA, Ye J, Murphy JD, Uccello TP, Han BJ, Zhao T, Drage MG, Murthy A, Qiu H, Patel A, Figueroa NM, Johnston CJ, Prieto PA, Egilmez NK, Belt BA, Lord EM, Linehan DC, and Gerber SA, “Stereotactic body radiation and interleukin-12 combination therapy eradicates pancreatic tumors by repolarizing the immune microenvironment,” Cell Reports, vol. 29, no. 2, pp. 406–421.e5, October 2019. [DOI] [PMC free article] [PubMed] [Google Scholar]
- [22].Soares KC, Foley K, Olino K, Leubner A, Mayo SC, Jain A, Jaffee E, Schulick RD, Yoshimura K, Edil B, and Zheng L, “A preclinical murine model of hepatic metastases,” Journal of Visualized Experiments, no. 91, September 2014. [DOI] [PMC free article] [PubMed] [Google Scholar]
- [23].Miura S, Yoshimura Y, Endo M, Satoh H, Machida H, and Sasaki T, “Comparison of 1-(2-deoxy-2-fluoro-4-thio—d-arabinofuranosyl)cytosine with gemcitabine in its antitumor activity,” Cancer Letters, vol. 144, no. 2, pp. 177–182, October 1999. [DOI] [PubMed] [Google Scholar]
- [24].Loupas T, Powers J, and Gill RW, “An axial velocity estimator for ultrasound blood flow imaging, based on a full evaluation of the doppler equation by means of a two-dimensional autocorrelation approach,” IEEE Transactions on Ultrasonics, Ferroelectrics, and Frequency Control, vol. 42, no. 4, pp. 672–688, 1995. [Google Scholar]
- [25].Demene C, Deffieux T, Pernot M, Osmanski B-F, Biran V, Gennisson J-L, Sieu L-A, Bergel A, Franqui S, Correas J-M, Cohen I, Baud O, and Tanter M, “Spatiotemporal clutter filtering of ultrafast ultrasound data highly increases doppler and fUltrasound sensitivity,” IEEE Transactions on Medical Imaging, vol. 34, no. 11, pp. 2271–2285, November 2015. [DOI] [PubMed] [Google Scholar]
- [26].Baranger J, Arnal B, Perren F, Baud O, Tanter M, and Demene C, “Adaptive spatiotemporal SVD clutter filtering for ultrafast doppler imaging using similarity of spatial singular vectors,” IEEE Transactions on Medical Imaging, vol. 37, no. 7, pp. 1574–1586, July 2018. [DOI] [PubMed] [Google Scholar]
- [27].Deng Y, Rouze NC, Palmeri ML, and Nightingale KR, “Ultrasonic shear wave elasticity imaging sequencing and data processing using a verasonics research scanner,” IEEE transactions on ultrasonics, ferroelectrics, and frequency control, vol. 64, no. 1, pp. 164–176, 2017. [DOI] [PMC free article] [PubMed] [Google Scholar]
- [28].Giannantonio DM, Dumont DM, Trahey GE, and Byram BC, “Comparison of physiological motion filters for in vivo cardiac ARFI,” Ultrasonic Imaging, vol. 33, no. 2, pp. 89–108, April 2011. [DOI] [PMC free article] [PubMed] [Google Scholar]
- [29].Hollender P, Palmeri M, and Trahey G, “Single track location shear wave elasticity imaging of the liver with reduced propagation windows,” in Ultrasonics Symposium (IUS), 2016 IEEE International. IEEE, Conference Proceedings, pp. 1–4. [Google Scholar]
- [30].Deng Y, Palmeri ML, Rouze NC, Haystead CM, and Nightingale KR, “Evaluating the benefit of elevated acoustic output in harmonic motion estimation in ultrasonic shear wave elasticity imaging,” Ultrasound in Medicine & Biology, vol. 44, no. 2, pp. 303–310, 2018. [Online]. Available: 10.1016/j.ultrasmedbio.2017.10.003 [DOI] [PMC free article] [PubMed] [Google Scholar]
- [31].Rivera B, Bushman MJ, Beaver RG, Cody DD, and Price RE, “Breath-hold device for laboratory rodents undergoing imaging procedures,” Journal of the American Association for Laboratory Animal Science, vol. 45, no. 4, pp. 54–59, July 2006. [PubMed] [Google Scholar]
- [32].Kubo HD and Hill BC, “Respiration gated radiotherapy treatment: a technical study,” Physics in Medicine and Biology, vol. 41, no. 1, pp. 83–91, January 1996. [DOI] [PubMed] [Google Scholar]
- [33].Payen T, Palermo CF, Sastra SA, Chen H, Han Y, Olive KP, and Konofagou EE, “Elasticity mapping of murine abdominal organsin vivousing harmonic motion imaging (HMI),” Physics in Medicine and Biology, vol. 61, no. 15, pp. 5741–5754, July 2016. [DOI] [PMC free article] [PubMed] [Google Scholar]
- [34].Chaturvedi P, Insana M, and Hall T, “2-d companding for noise reduction in strain imaging,” IEEE Transactions on Ultrasonics, Ferroelectrics and Frequency Control, vol. 45, no. 1, pp. 179–191, January 1998. [DOI] [PubMed] [Google Scholar]
- [35].Bottenus N, Long W, Long J, and Trahey G, “A real-time lag-one coherence tool for adaptive imaging,” in 2018 IEEE International Ultrasonics Symposium (IUS) IEEE, oct 2018. [Google Scholar]
- [36].Rouze N, Wang M, Palmeri M, and Nightingale K, “Parameters affecting the resolution and accuracy of 2-d quantitative shear wave images,” IEEE Transactions on Ultrasonics, Ferroelectrics and Frequency Control, vol. 59, no. 8, p. 1729–1740, August 2012. [Online]. Available: 10.1109/TUFFc.2012.2377 [DOI] [PMC free article] [PubMed] [Google Scholar]
- [37].Chen H, Hou GY, Han Y, Payen T, Palermo CF, Olive KP, and Konofagou EE, “Harmonic motion imaging for abdominal tumor detection and high-intensity focused ultrasound ablation monitoring: an in vivo feasibility study in a transgenic mouse model of pancreatic cancer,” IEEE Transactions on Ultrasonics, Ferroelectrics, and Frequency Control, vol. 62, no. 9, pp. 1662–1673, September 2015. [DOI] [PMC free article] [PubMed] [Google Scholar]
- [38].Nabavizadeh A, Payen T, Saharkhiz N, McGarry M, Olive KP, and Konofagou EE, “Technical note: In vivo young’s modulus mapping of pancreatic ductal adenocarcinoma during HIFU ablation using harmonic motion elastography ( HME ),” Medical Physics, vol. 45, no. 11, pp. 5244–5250, October 2018. [DOI] [PMC free article] [PubMed] [Google Scholar]
- [39].Elyas E, Papaevangelou E, Alles EJ, Erler JT, Cox TR, Robinson SP, and Bamber JC, “Correlation of ultrasound shear wave elastography with pathological analysis in a xenografic tumour model,” Scientific Reports, vol. 7, no. 1, March 2017. [DOI] [PMC free article] [PubMed] [Google Scholar]
- [40].Riegler J, Labyed Y, Rosenzweig S, Javinal V, Castiglioni A, Dominguez CX, Long JE, Li Q, Sandoval W, Junttila MR, Turley SJ, Schartner J, and Carano RA, “Tumor elastography and its association with collagen and the tumor microenvironment,” Clinical Cancer Research, vol. 24, no. 18, pp. 4455–4467, May 2018. [DOI] [PubMed] [Google Scholar]
- [41].Dizeux A, Payen T, Guillou-Buffello DL, Comperat E, Gennisson J-L, Tanter M, Oelze M, and Bridal SL, “In vivo multiparametric ultrasound imaging of structural and functional tumor modifications during therapy,” Ultrasound in Medicine & Biology, vol. 43, no. 9, pp. 2000–2012, 2017. [Online]. Available: 10.1016/j.ultrasmedbio.2017.03.021 [DOI] [PubMed] [Google Scholar]
- [42].Yachida S, Jones S, Bozic I, Antal T, Leary R, Fu B, Kamiyama M, Hruban RH, Eshleman JR, Nowak MA, Velculescu VE, Kinzler KW, Vogelstein B, and Iacobuzio-Donahue CA, “Distant metastasis occurs late during the genetic evolution of pancreatic cancer,” Nature, vol. 467, no. 7319, pp. 1114–1117, October 2010. [DOI] [PMC free article] [PubMed] [Google Scholar]
- [43].Conroy T, Desseigne F, Ychou M, Bouché O, Guimbaud R, Bécouarn Y, Adenis A, Raoul J-L, Gourgou-Bourgade S, de la Fouchardière C, Bennouna J, Bachet J-B, Khemissa-Akouz F, Péré-Vergé D, Delbaldo C, Assenat E, Chauffert B, Michel P, Montoto-Grillot C, and Ducreux M, “FOLFIRINOX versus gemcitabine for metastatic pancreatic cancer,” New England Journal of Medicine, vol. 364, no. 19, pp. 1817–1825, May 2011. [DOI] [PubMed] [Google Scholar]
- [44].Fukumura D and Jain RK, “Tumor microvasculature and microenvironment: Targets for anti-angiogenesis and normalization,” Microvascular Research, vol. 74, no. 2–3, p. 72–84, September 2007. [Online]. Available: 10.1016/j.mvr.2007.05.003 [DOI] [PMC free article] [PubMed] [Google Scholar]
- [45].Tsuzuki Y, Fukumura D, Koike C, and Jain RK, “The orthotopic microenvironment promotes tumor growth and vegf121 expression in human pancreatic adenocarcinoma,” Gastroenterology, vol. 118, no. 4, p. A1415, April 2000. [Online]. Available: 10.1016/S0016-5085(00)81547-4 [DOI] [Google Scholar]
- [46].Gardian K, Janczewska S, and Durlik M, “Microenvironment elements involved in the development of pancreatic cancer tumor,” Gastroenterology Research and Practice, vol. 2012, p. 1–6, 2012. [Online]. Available: 10.1155/2012/585674 [DOI] [PMC free article] [PubMed] [Google Scholar]
- [47].Rehemtulla A, Stegman LD, Cardozo SJ, Gupta S, Hall DE, Contag CH, and Ross BD, “Rapid and quantitative assessment of cancer treatment response using in vivo bioluminescence imaging,” Neoplasia, vol. 2, no. 6, pp. 491–495, 2000. [DOI] [PMC free article] [PubMed] [Google Scholar]
- [48].Deffieux T, Gennisson J-L, Larrat B, Fink M, and Tanter M, “The variance of quantitative estimates in shear wave imaging: Theory and experiments,” IEEE Transactions on Ultrasonics, Ferroelectrics and Frequency Control, vol. 59, no. 11, p. nil, 2012. [Online]. Available: 10.1109/tuffc.2012.2472 [DOI] [PubMed] [Google Scholar]
- [49].Reuter M, Schmansky NJ, Rosas HD, and Fischl B, “Withinsubject template estimation for unbiased longitudinal image analysis,” NeuroImage, vol. 61, no. 4, pp. 1402–1418, July 2012. [DOI] [PMC free article] [PubMed] [Google Scholar]
- [50].Grasland-Mongrain P, Zorgani A, Nakagawa S, Bernard S, Paim LG, Fitzharris G, Catheline S, and Cloutier G, “Ultrafast imaging of cell elasticity with optical microelastography,” Proceedings of the National Academy of Sciences, vol. 115, no. 5, p. 861–866, January 2018. [Online]. Available: 10.1073/pnas.1713395115 [DOI] [PMC free article] [PubMed] [Google Scholar]
- [51].Zhang M, Huang M, Le C, Zanzonico PB, Claus F, Kolbert KS, Martin K, Ling CC, Koutcher JA, and Humm JL, “Accuracy and reproducibility of tumor positioning during prolonged and multi-modality animal imaging studies,” Physics in Medicine and Biology, vol. 53, no. 20, p. 5867–5882, September 2008. [Online]. Available: 10.1088/0031-9155/53/20/021 [DOI] [PMC free article] [PubMed] [Google Scholar]
- [52].luc Gennisson J, Provost J, Deffieux T, Papadacci C, Imbault M, Pernot M, and Tanter M, “4-d ultrafast shear-wave imaging,” IEEE Transactions on Ultrasonics, Ferroelectrics, and Frequency Control, vol. 62, no. 6, pp. 1059–1065, 2015. [Online]. Available: 10.1109/tuffc.2014.006936 [DOI] [PubMed] [Google Scholar]
Associated Data
This section collects any data citations, data availability statements, or supplementary materials included in this article.


