

ABSTRACT
Background
Postpartum weight trajectories and its implications on later cardiometabolic health are not entirely understood.
Objectives
Our objectives were: 1) to characterize maternal weight trajectories from 1 to 24 mo postpartum, 2) to determine the association of prepregnancy BMI, gestational weight gain (GWG), and pregnancy behaviors with the trajectories, and 3) to evaluate the association of weight trajectories with BMI, waist circumference (WC), lipid profile, glucose, insulin resistance, blood pressure, and inflammatory markers at 3 y postpartum.
Methods
We studied 1359 mothers from the prospective cohort Project Viva. Using weights at 1, 6, 12, and 24 mo postpartum, we characterized weight trajectories using a latent class growth model. For objectives 2 and 3, we used multinomial logistic regression and multiple linear regression models, respectively.
Results
Around 85% of women fell into a trajectory of sustained weight loss (1–12 mo) + maintenance (12–24 mo) (reference), 5.7% followed a trajectory characterized by fast weight loss + slight gain, and 9.7% fell into a trajectory of little weight loss + slight gain. Prepregnancy overweight and obesity increased the odds of falling into the fast weight loss + slight gain trajectory, compared with the reference. Prepregnancy overweight [OR 1.57 (95% CI: 1.01, 2.46)] and a higher total GWG rate [3.69 (2.90, 4.68)] increased the odds of falling into the little weight loss + slight gain trajectory, whereas a higher Prudent dietary pattern score was protective [0.73 (0.54, 0.98)]. Women in this trajectory had higher BMI, WC, weight gain from prepregnancy, low-density lipoprotein cholesterol, and inflammatory markers at 3 y postpartum.
Conclusions
Women following a trajectory of little weight loss + slight gain during the first 2 y postpartum had an adverse cardiometabolic profile 3 y after delivery. Targeting diet and GWG during pregnancy and facilitating postpartum weight loss could improve women's long-term health.
Keywords: postpartum weight trajectories, postpartum weight change, Project Viva, pre-pregnancy BMI, gestational weight gain, diet, adiposity, cardiovascular risk factors
Introduction
In the USA, obesity affects over a third of reproductive-aged women (1). Obesity prevention efforts among this group of women have the potential not only to improve women's long-term health but also to redirect intergenerational cycles of obesity (2, 3). Therefore, identifying risk factors for excess weight among young women is a priority. Pregnancy is increasingly recognized as a risk factor for obesity (4–6), possibly through weight retention or gain after delivery (7, 8). These potentially modifiable targets need to be better understood to reduce the obesity burden.
In recent years, evidence has accumulated on the association between excessive gestational weight gain (GWG) and weight status, adiposity, and cardiometabolic risk factors in the years after delivery (9–12). Weight retention and weight gain in the first ∼2 y postpartum have been suggested to mediate the associations between excessive GWG and long-term adiposity outcomes (7, 8). Different studies have tested the effect of prenatal weight management interventions on GWG (13–16). Some of these have been successful in reducing GWG but not weight at 1 y postpartum (13–15). Therefore, it has been suggested that the postpartum period, which is the preconception period of a next pregnancy, might be an optimal moment to intervene to optimize maternal weight and overall health (17, 18). It is essential to gain a deeper understanding of the natural course of weight change after delivery, the characteristics associated with weight change, and its potential health effects.
Most studies have defined weight change after pregnancy using the difference between a single postpartum weight and prepregnancy weight. This approach does not allow capturing the course of weight change and does not differentiate the contribution of weight retained from pregnancy compared with weight gained after delivery. To date, few studies have characterized trajectories of postpartum weight change using repeated weight assessments (8, 19–21). Two of these studies modeled data-driven postpartum weight trajectories and assessed their association with prepregnancy BMI (19) and modifiable factors such as GWG (19) and diet quality (21). To the best of our knowledge, no studies have evaluated the effect of behavioral factors such as walking and television (TV) viewing on postpartum weight trajectories, nor assessed the associations of these trajectories with later cardiometabolic health. The objective of this study was to characterize maternal weight trajectories from 1 to 24 mo postpartum using a latent class growth model (LCGM) and to determine their association with prepregnancy BMI, GWG, diet, walking, and TV viewing during pregnancy. We also evaluated the association of postpartum weight trajectories with anthropometric and metabolic outcomes 3 y after delivery.
Methods
Study population
This study was a secondary analysis of 2100 mothers participating in Project Viva, a prospective prebirth cohort. Project Viva recruited women between 1999 and 2002 from Atrius Harvard Vanguard Medical Associates, a multispecialty practice in eastern Massachusetts, at around 10 weeks of gestation. Twenty-eight of the 2100 mothers participated in Project Viva during 2 different singleton pregnancies (2128 live births in total). As the focus of this study was on maternal outcomes, we considered only the earliest pregnancy that was eligible for the analysis. Details of recruitment and eligibility of Project Viva have been previously described (22).
This analysis was restricted to 1359 women with a live birth, who were ≥18 y at enrollment, and who had information to characterize their postpartum weight trajectory (prepregnancy weight and ≥2 weights available from 1 to 24 mo postpartum). The frequency of missing weights from 1 to 24 mo postpartum is described in Supplemental Table 1. In developing the weight trajectories, we excluded weight observations affected by a proximal pregnancy. For example, if a woman reported a pregnancy at 12 mo, her weights at 12 and 24 mo were excluded, but her weights at 1 and 6 mo were included in the analysis. Of the 1359 women with a postpartum weight trajectory, 1077 had information on outcomes at 3 y. We further excluded women who were pregnant at 3 y (n = 83) or who had <6 mo from the end of their last pregnancy (n = 111), which left 883 eligible participants. Women included in the weight trajectory analysis (n = 1359) were older at enrollment (32.6 compared with 30.4 y), more likely to be of white race/ethnicity (72% compared with 56%), have at least college education (71% compared with 52%), be married or cohabitating (94% compared with 86%), and have a household income >$70,000/y (62% compared with 49%), compared with women who were excluded (n = 741) (P < 0.0001 for all). Also, the included subset had a lower proportion of smokers during pregnancy (11% compared with 16%, P < 0.002). For women included in the 3-y outcome analysis (n = 883) compared with those not included (n = 1217), the characteristics mentioned above also differed significantly and to a similar extent.
All participants provided written informed consent at enrollment and again at 3 y postpartum. The Institutional Review Board of Harvard Pilgrim Health Care approved all study protocols.
Postpartum weight trajectories
To model postpartum weight trajectories, we used weights: 1) obtained from clinical records at 1 mo (n = 1181, 100% from clinical records), 2) collected at a study visit at 6 mo (n = 907, 95% research measures, 5% from clinical records), and 3) self-reported by study participants via mailed questionnaires at 12 (n = 959) and 24 mo (n = 1194, 100% self-reported).
Predictors of postpartum weight trajectories
Prepregnancy BMI
Prepregnancy BMI (kg/m2) was calculated from self-reported prepregnancy weight and height, and categorized as underweight, normal weight, overweight, or obesity (23). Due to the small number of underweight participants (n = 44), we combined the categories of underweight and normal weight.
GWG
We used serial clinical weights obtained from prenatal records with a median of 13 (3–28) repeated measurements per woman. Total GWG rate (kg/wk) was calculated as the difference between the last pregnancy weight (clinically measured within 4 wk before delivery) and self-reported prepregnancy weight, divided by gestation length in weeks. We calculated GWG at the first (prepregnancy to 91 d), second (91 to 182 d), and third trimesters (182 d to delivery) and divided each by the number of intervening weeks in each period to obtain trimester-specific GWG rates. To estimate weights at days 91 and 182, we performed linear interpolation between the 2 closest weight measures (11).
Diet
Diet was assessed in the second trimester of pregnancy (∼26–28 wk) using a semiquantitative FFQ, which queried food consumption over the past 3 mo. The FFQ was modified for use in pregnancy from the FFQ used in the Nurses’ Health Study and biochemically calibrated in a pilot study of pregnant women (24). Continuous scores that reflected adherence to Western and Prudent dietary patterns were derived through principal component analysis, as previously described (25). Daily servings of sugar-sweetened beverages (SSBs) and calories consumed per day were also estimated.
Physical and sedentary activities
Physical activity during pregnancy (∼26–28 wk) was assessed using a questionnaire modified from the Physical Activity Scale for the Elderly (26). The modifications from the original instrument have been previously reported (26). Briefly, the referent period in the modified instrument was the past 3 mo (second trimester). Women reported their average weekly activity instead of reporting both days per week and hours per day over the previous week. The modified version did not ask about light-to-moderate activities such as weight lifting or strength training, modifications that were considered appropriate for pregnancy (26). Women reported time of TV viewing, walking (walking for fun or exercise, walking to work, but not walking at work), light-to-moderate activities (including bowling, yoga, stretching classes, excluding walking), and vigorous activities (jogging, swimming, cycling, aerobic dance, skiing) over the past 3 mo (h/wk). For this analysis, we focused on walking and TV viewing (h/d), which were strong predictors of postpartum weight retention in a previous study (27).
Adiposity and cardiometabolic outcomes at 3 y postpartum
At the 3-y in-person postpartum visit, trained research assistants measured women's weight to the nearest 0.1 kg (electronic scale model 881; Seca Corp.), WC to the nearest 0.1 cm using a Lufkin woven tape, and systolic blood pressure (SBP) and diastolic blood pressure, 5 times, 1 min apart, with a Dinamap Pro 100 (Critikon Inc.). We calculated BMI at 3 y and weight change from prepregnancy. Phlebotomists collected blood samples from which fasting glucose, insulin, total cholesterol, high-density lipoprotein cholesterol, low-density lipoprotein cholesterol, and triglycerides were assayed. IL-6 and C-reactive protein (CRP) were assayed from fasting and nonfasting blood specimens. Detailed information on the assays has been described previously (28). We determined insulin resistance using the HOMA-IR: [fasting insulin (uU/mL) × fasting glucose (mmol/L)/22.5].
Covariates
At enrollment, women reported sociodemographic information, including age, race/ethnicity, education level, marital status, household income, and parity. They also provided information on smoking habits, and partner's weight and height, from which we calculated BMI. Information on glucose tolerance status and hypertensive disorders of pregnancy was obtained from medical records, as previously reported (28).
Statistical analysis
Postpartum weight trajectories
Weight trajectories were characterized using LCGM, which is a method that allows the identification of clusters of individuals following a similar pattern of change over time in a given variable. Briefly, it assumes that individuals in the sample do not need to come from a single underlying population, but rather from multiple, latent (i.e. unobserved) subgroups. Each identified subgroup has its own specific parameters (e.g. intercept, linear and polynomial functions) which are unobserved (29). Instead of using raw postpartum weights to develop the trajectories, we used the difference between weight at each time point (1, 6, 12, and 24 mo) and prepregnancy weight. To account for the possible bias of including weight assessed using different methods, we added the source of weight (i.e. measured by the research assistant, at the clinic, or self-reported) as a time-varying covariate in the model. This analysis was conducted using the traj plug-in (30) in Stata 15. To assess model fit, we used the Bayesian Information Criterion and the Log-Bayes factor to compare competitive models with different numbers or shapes of trajectories. We also considered the significance of the linear and polynomial terms, group membership probability (>5%), and average posterior probability (>0.70) to identify the optimal number of latent trajectories (29). We coded distinct trajectories as a categorical variable and named them based on their visual appearance.
Predictors of postpartum weight trajectories
We evaluated the associations of prepregnancy BMI, GWG, walking, TV viewing, and diet with weight trajectories using multinomial logistic regression. All the models were adjusted for age, race/ethnicity, education, marital status, income, parity, and partner's BMI. We modeled total and trimester-specific GWG rates scaled to 1-SD increments, and additionally adjusted these models for prepregnancy BMI, smoking during pregnancy, and GWG rate during the previous trimesters (only for second and third trimester estimates). The estimates of dietary patterns, SSBs, walking, and TV viewing were additionally adjusted for first trimester GWG rate, energy intake in the second trimester of pregnancy (kcal), and smoking during pregnancy. The Prudent and Western dietary pattern scores, as well as walking and TV viewing, were included in the same model and adjusted by the covariates mentioned above. SSBs were evaluated in a separate model because they represent a component of the Western dietary pattern.
Associations of postpartum weight trajectories with health outcomes
To evaluate the associations between trajectories of postpartum weight and outcomes at 3 y postpartum, we fitted multiple linear regression models. Before modeling, we natural log (ln)-transformed variables with a skewed distribution (HOMA-IR, CRP, IL-6, triglycerides). The models were adjusted for sociodemographic characteristics, prepregnancy BMI, total GWG rate, and hypertensive disorders of pregnancy. The models for glucose and HOMA-IR were additionally adjusted for gestational glucose tolerance status.
To account for missing data, we performed multiple imputation to impute missing covariates. We used SAS (Proc MI) to impute 50 values for each missing observation and combined multivariable modeling estimates by using Proc MI ANALYZE in SAS version 9.4 (SAS Institute). An alternative analysis, including only participants with all covariate data (complete cases), yielded similar results (data not shown).
We conducted all the analyses in Stata 15 (StataCorp LP) and SAS version 9.4 (SAS Institute).
Results
Women had a mean of 32.6 y at enrollment, they were predominantly white (72%), college educated (71%), married or cohabitating (94%), high income (62%), nulliparous (47%), and normal weight before pregnancy (64%) (Table 1).
TABLE 1.
Participant characteristics by trajectory of postpartum weight change among 1359 women from Project Viva1
| Trajectory 1: | Trajectory 2: | Trajectory 3: | |||
|---|---|---|---|---|---|
| All | Fast weight loss + slight gain | Sustained weight loss + maintenance | Little weight loss + slight gain | ||
| n = 1359 | n = 77 (5.7%) | n = 1150 (84.6%) | n = 132 (9.7%) | P value2 | |
| Maternal characteristics | |||||
| Age, y | 32.6 ± 4.93 | 33.1 ± 4.5 | 32.7 ± 4.7 | 31.0 ± 6.0 | <0.001 |
| Race/ethnicity | <0.0001 | ||||
| White | 975 (72) | 53 (69) | 854 (74) | 68 (52) | |
| Black | 181 (13) | 15 (19) | 133 (12) | 33 (25) | |
| Other | 203 (15) | 9 (12) | 163 (14) | 31 (23) | |
| College graduate | <0.0001 | ||||
| No | 389 (29) | 30 (39) | 296 (26) | 63 (48) | |
| Yes | 970 (71) | 47 (61) | 854 (74) | 69 (52) | |
| Married or cohabitating | <0.0001 | ||||
| No | 82 (6) | 2 (3) | 57 (5) | 23 (17) | |
| Yes | 1277 (94) | 75 (97) | 1093 (95) | 109 (83) | |
| Nulliparous | 0.04 | ||||
| No | 716 (53) | 46 (60) | 613 (53) | 57 (43) | |
| Yes | 643 (47) | 31 (40) | 537 (47) | 75 (57) | |
| Prepregnancy BMI category, kg/m2 | <0.0001 | ||||
| <25 | 872 (64) | 12 (16) | 791 (69) | 69 (52) | |
| 25 to < 30 | 299 (22) | 23 (30) | 239 (21) | 37 (28) | |
| ≥30 | 188 (14) | 42 (55) | 120 (10) | 26 (20) | |
| Smoking status | 0.44 | ||||
| Never | 941 (69) | 51 (66) | 803 (70) | 87 (66) | |
| Former | 272 (20) | 16 (21) | 231 (20) | 25 (19) | |
| Smoked during pregnancy | 146 (11) | 10 (13) | 116 (10) | 20 (15) | |
| Gestational glucose tolerance | 0.001 | ||||
| Normal | 1122 (83) | 57 (74) | 953 (83) | 112 (85) | |
| Isolated hyperglycemia | 122 (9) | 6 (8) | 105 (9) | 11 (8) | |
| Impaired glucose tolerance | 44 (3) | 2 (3) | 35 (3) | 7 (5) | |
| Gestational diabetes | 71 (5) | 12 (15) | 57 (5) | 2 (2) | |
| Hypertensive disorders of pregnancy | 0.001 | ||||
| Normal | 1193 (88) | 67 (87) | 1023 (89) | 103 (78) | |
| Chronic hypertension | 20 (1) | 2 (3) | 15 (1) | 3 (2) | |
| Gestational hypertension | 98 (7) | 1 (1) | 79 (7) | 18 (14) | |
| Pre-eclampsia | 48 (4) | 7 (9) | 33 (3) | 8 (6) | |
| Prudent dietary pattern, z-score | −0.1 [−0.7, 0.5]4 | −0.2 [−0.9, 0.3] | −0.1 [−0.6, 0.6] | −0.4 [−1.0, 0.0] | <0.0001 |
| Western dietary pattern, z-score | −0.1 [−0.7, 0.5] | −0.0 [−0.5, 0.6] | −0.1 [−0.7, 0.5] | −0.0 [−0.7, 0.6] | 0.04 |
| SSBs,5 servings | 0.3 [0.1, 0.8] | 0.4 [0.1, 0.9] | 0.3 [0.1, 0.7] | 0.4 [0.1, 1.1] | 0.01 |
| Walking, h/d | 0.6 [0.3, 0.9] | 0.6 [0.3, 0.7] | 0.6 [0.3, 0.9] | 0.6 [0.3, 0.9] | 0.36 |
| TV viewing, h/d | 1.4 [0.7, 2.1] | 2.0 [1.4, 2.9] | 1.4 [0.7, 2.1] | 1.4 [0.9, 2.6] | <0.0001 |
| Gestational weight gain, kg/wk | |||||
| Total | 0.4 ± 0.1 | 0.2 ± 0.2 | 0.4 ± 0.1 | 0.5 ± 0.1 | <0.0001 |
| First trimester | 0.2 ± 0.2 | 0.0 ± 0.2 | 0.2 ± 0.2 | 0.4 ± 0.3 | <0.0001 |
| Second trimester | 0.5 ± 0.2 | 0.3 ± 0.2 | 0.5 ± 0.2 | 0.6 ± 0.2 | <0.0001 |
| Third trimester | 0.5 ± 0.2 | 0.3 ± 0.3 | 0.5 ± 0.2 | 0.6 ± 0.3 | <0.0001 |
| Family characteristics | |||||
| Household income >$70,000/y | <0.0001 | ||||
| No | 511 (38) | 33 (43) | 407 (35) | 72 (54) | |
| Yes | 848 (62) | 44 (57) | 743 (65) | 60 (46) | |
| Father's BMI category, kg/m2 | <0.001 | ||||
| <25 | 505 (37) | 13 (17) | 456 (40) | 37 (28) | |
| 25 to < 30 | 654 (48) | 48 (62) | 536 (47) | 69 (52) | |
| ≥30 | 200 (15) | 16 (21) | 158 (14) | 26 (20) | |
All values are frequencies and percentages unless otherwise indicated. Percentages may not add up to 100% due to rounding.
P value for differences across the 3 trajectories obtained from multinomial logistic regression.
Mean ± SD (all such values).
Median [IQR] (all such values).
One serving of SSBs is equivalent to 355 mL.
SSB, sugar-sweetened beverage; TV, television.
Postpartum weight trajectories
Figure 1 shows the postpartum weight trajectories identified using LCGM. Trajectory 1 comprised 5.7% of women who, on average, reached their prepregnancy weight by 1 mo postpartum. Women in this trajectory experienced fast weight loss from 1 to 12 mo and a slight weight gain from 12 to 24 mo (henceforth named fast weight loss + slight gain). Trajectory 2 included the majority of women (84.6%) who experienced sustained weight loss throughout 12 mo postpartum, almost reaching their prepregnancy weight by this time point. Women in this trajectory maintained their weight stable from 12 to 24 mo (henceforth named sustained weight loss + maintenance). Trajectory 3 included 9.7% of women who lost little weight from 1 to 12 mo and gained weight from 12 to 24 mo (henceforth named little weight loss + slight gain). The final model achieved a good fit, as shown in Supplemental Table 2.
FIGURE 1.
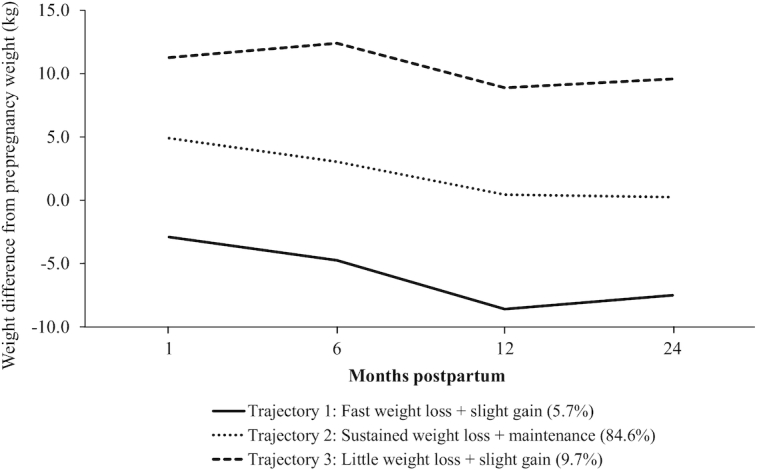
Weight trajectories from 1 to 24 mo postpartum among 1359 women from Project Viva. The graph displays the difference from weight at each time point and prepregnancy weight in kg.
All the maternal and family characteristics differed significantly (P < 0.05) by trajectories of postpartum weight change, except for smoking status and walking during pregnancy (Table 1). The trajectory characterized by sustained weight loss + maintenance included women who were predominantly white (74%), college-educated (74%), high income (65%), and with normal prepregnancy BMI (69%). Most women in the little weight loss + slight gain trajectory were nulliparous (57%) and did not have a high income (54%). They were also younger at enrollment, had high total and trimester-specific GWG rates, and a low Prudent dietary pattern z-score. Women in the fast weight loss + slight gain trajectory were older at enrollment, multiparous (60%), overweight or obese before pregnancy (85%), and had a low mean GWG rate (total and trimester specific).
Predictors of postpartum weight trajectories
Women with prepregnancy overweight or obesity, compared with normal weight, had higher odds of falling into the fast weight loss + slight gain trajectory [overweight: OR: 6.18 (95% CI: 3.01, 12.69); obesity: 21.93 (10.78, 44.62)], compared with the reference trajectory of sustained weight loss + maintenance (Table 2, Model 2). Women with overweight or obesity were also more likely to be in the little weight loss + slight gain trajectory [overweight: 1.57 (1.01, 2.46); obesity: 1.62 (0.94, 2.78)], although CIs for women with obesity included the null value.
TABLE 2.
Associations of prepregnancy BMI category with trajectories of postpartum weight change among 1359 women from Project Viva1
| Unadjusted | Model 12 | Model 23 | ||||
|---|---|---|---|---|---|---|
| Trajectory 1: fast weight loss + slight gain | Trajectory 3: little weight loss + slight gain | Trajectory 1: fast weight loss + slight gain | Trajectory 3: little weight loss + slight gain | Trajectory 1: fast weight loss + slight gain | Trajectory 3: little weight loss + slight gain | |
| OR (95% CI) | OR (95% CI) | OR (95% CI) | ||||
| Normal weight | 1.0 (reference) | 1.0 (reference) | 1.0 (reference) | 1.0 (reference) | 1.0 (reference) | 1.0 (reference) |
| Overweight | 6.38 (3.13, 13.01) | 1.78 (1.17, 2.73) | 6.38 (3.12, 13.03) | 1.64 (1.06, 2.53) | 6.18 (3.01, 12.69) | 1.57 (1.01, 2.46) |
| Obesity | 23.10 (11.82, 45.12) | 2.49 (1.52, 4.06) | 23.44 (11.86, 46.30) | 2.09 (1.26, 3.48) | 21.93 (10.78, 44.62) | 1.62 (0.94, 2.78) |
Estimates are OR and 95% CIs obtained from multinomial logistic regression. Reference group: sustained weight loss + maintenance (trajectory 2).
Adjusted for age, race/ethnicity.
Model 1 additionally adjusted for education, marital status, household income, parity, and partner's BMI.
A 1-SD increment in total GWG rate was associated with lower odds of falling into the fast weight loss + slight gain trajectory [OR: 0.37 (95% CI: 0.27, 0.51)] and higher odds of the little weight loss + slight gain trajectory [3.69 (2.90, 4.68)], compared with the reference (Figure 2). The results for trimester-specific GWG rates were in the same direction as the total GWG estimates, although they were slightly weaker.
FIGURE 2.

Associations of total and trimester-specific GWG rates (kg/wk) with trajectories of postpartum weight change among women from Project Viva. The graph displays OR and corresponding 95% CI obtained from multinomial logistic regression. Reference group: sustained weight loss + maintenance (trajectory 2). Adjusted for age at enrollment, race/ethnicity, education, marital status, income, parity, partner's BMI, prepregnancy BMI, and smoking during pregnancy. Estimates for the second and third trimesters were additionally adjusted by the rate of GWG from the previous trimester(s). GWG, gestational weight gain.
Each additional h/d of TV viewing during pregnancy was associated with higher odds of falling into the fast weight loss + slight gain trajectory [OR: 1.24 (95% CI: 1.00, 1.55)]; however, this result was borderline significant (Figure 3). Diet-related characteristics and walking were not associated with this trajectory. On the other hand, a 1-unit increase in the Prudent dietary pattern score was associated with lower odds of falling into the little weight loss + slight gain trajectory [0.73 (0.54, 0.98)]. The associations of walking, TV viewing, and the remaining diet-related characteristics with the little weight loss + slight gain trajectory were in the expected direction but included the null value.
FIGURE 3.

Associations of dietary patterns, SSBs, walking, and TV viewing with trajectories of postpartum weight change among women from Project Viva. The graph displays OR and corresponding 95% CI obtained from multinomial logistic regression. Reference group: sustained weight loss + maintenance (trajectory 2). Adjusted for age, race/ethnicity, education, marital status, income, parity, partner's BMI, prepregnancy BMI, first-trimester GWG rate, second-trimester energy intake (kcal), and smoking during pregnancy. NOTE: Prudent, Western, walking, and TV were included in the same model, and additionally adjusted by the mentioned covariates. SSBs were modeled separately and adjusted by covariates. One serving of SSBs is equivalent to 355 mL. GWG, gestational weight gain; SSB, sugar-sweetened beverage; TV, television.
Associations of postpartum weight trajectories with health outcomes
The associations between the postpartum weight trajectories and anthropometric outcomes were in the expected direction. After accounting for maternal and family characteristics, prepregnancy BMI, and total GWG rate (Table 3, Model 2), women in the fast weight loss + slight gain trajectory, compared with the reference trajectory, had lower BMI [−2.95 (95% CI: −3.63, −2.26)], lower WC [−5.60 cm (−7.84, −3.36)], and greater weight loss from prepregnancy [−7.84 kg (−9.62, −6.06)] 3 y after delivery. Women in the little weight loss + slight gain trajectory had higher BMI [2.61 (2.09, 3.13)], higher WC [7.88 cm (6.17, 9.60)], and weight gain from prepregnancy [7.07 kg (5.71, 8.43)]. The associations with the adiposity indicators persisted after adjustment for hypertensive disorders of pregnancy (Model 3).
TABLE 3.
Associations of trajectories of postpartum weight change with cardiometabolic outcomes 3 y after delivery among women from Project Viva1
| Model 12 | Model 23 | Model 34 | ||||||
|---|---|---|---|---|---|---|---|---|
| Trajectory 1: | Trajectory 3: | Trajectory 1: | Trajectory 3: | Trajectory 1: | Trajectory 3: | |||
| Fast weight loss + slight gain | Little weight loss + slight gain | Fast weight loss + slight gain | Little weight loss + slight gain | Fast weight loss + slight gain | Little weight loss + slight gain | |||
| Outcome | n 5 | Mean ± SD | β (95% CI) | β (95% CI) | β (95% CI) | |||
| Adiposity | ||||||||
| BMI, kg/m2 | 855 | 26.1 ± 5.6 | 5.04 (3.57, 6.50) | 4.54 (3.37, 5.70) | −2.95 (−3.63, −2.26) | 2.61 (2.09, 3.13) | −2.83 (−3.52, −2.14) | 2.59 (2.07, 3.11) |
| WC, cm | 871 | 86.6 ± 13.0 | 10.27 (6.97, 13.56) | 11.23 (8.62, 13.84) | −5.60 (−7.84, −3.36) | 7.88 (6.17, 9.60) | −5.19 (−7.45, −2.93) | 7.78 (6.07, 9.49) |
| Weight change, kg6 | 865 | 2.5 ± 6.5 | −9.0 (−10.60, −7.40) | 7.81 (6.55, 9.08) | −7.84 (−9.62, −6.06) | 7.07 (5.71, 8.43) | −7.51 (−9.30, −5.72) | 7.01 (5.66, 8.36) |
| Biochemical | ||||||||
| Total-c, mg/dL | 164 | 178 ± 30 | −11.80 (−32.40, 8.75) | 14.79 (−1.83, 1.41) | −14.50 (−36.80, 7.75) | 15.61 (−1.50, 32.73) | −12.90 (−35.60, 9.91) | 16.50 (−0.79, 33.78) |
| LDL-c, mg/dL | 164 | 107 ± 28 | −6.37 (−25.30, 12.56) | 16.02 (0.73, 31.31) | −10.20 (−30.70, 10.24) | 16.72 (1.01,32.43) | −9.12 (−30.0, 11.72) | 17.20 (1.37, 33.02) |
| HDL-c, mg/dL | 164 | 53.9 ± 12.0 | −4.11 (−12.30, 4.03) | 1.82 (−4.75, 8.40) | 1.71 (−6.69, 10.12) | 0.71 (−5.75, 7.17) | 0.47 (−8.04, 8.98) | 1.05 (−5.41, 7.51) |
| Triglycerides,7 mg/dL | 164 | 85.6 ± 47.0 | −0.07 (−0.39, 0.24) | −0.17 (−0.43, 0.08) | −0.32 (−0.65, 0.01) | −0.10 (−0.35, 0.16) | −0.26 (−0.59, 0.08) | −0.09 (−0.35, 0.16) |
| Glucose, mg/dL | 164 | 74.7 ± 15.0 | −1.44 (−11.70, 8.86) | −3.08 (−11.4, 5.24) | −3.84 (−14.9, 7.25) | −2.87 (−11.4, 5.65) | −6.18 (−17.4, 5.08) | −3.36 (−11.9, 5.20) |
| HOMA-IR7 | 164 | 1.9 ± 2.1 | 0.06 (−0.41, 0.53) | −0.07 (−0.45, 0.30) | −0.44 (−0.89, 0.00) | −0.01 (−0.35, 0.33) | −0.49 (−0.95, −0.04) | −0.05 (−0.39, 0.30) |
| CRP,7 mg/L | 523 | 2.3 ± 5.5 | 0.41 (−0.07, 0.88) | 0.75 (0.37, 1.13) | −0.45 (−0.93, 0.03) | 0.56 (0.18, 0.94) | −0.44 (−0.93, 0.04) | 0.56 (0.17, 0.94) |
| IL-6,7 pg/mL | 523 | 1.7 ± 3.4 | 0.02 (−0.26, 0.31) | 0.37 (0.14, 0.61) | −0.33 (−0.63, −0.02) | 0.33 (0.09, 0.58) | −0.34 (−0.65, −0.03) | 0.34 (0.09, 0.58) |
| Clinical | ||||||||
| SBP, mmHg | 874 | 109 ± 11.0 | 2.89 (−0.32, 6.10) | 3.64 (1.09, 6.18) | −3.74 (−7.11, −0.37) | 1.99 (−0.59, 4.58) | −2.75 (−6.03, 0.54) | 1.68 (−0.82, 4.19) |
| DBP, mmHg | 874 | 66.9 ± 8.4 | 2.30 (−0.08, 4.69) | 0.94 (−0.95, 2.83) | −0.95 (−3.54, 1.65) | 0.18 (−1.81, 2.17) | −0.46 (−3.04, 2.12) | 0.02 (−1.95, 1.98) |
Estimates are β-coefficients and 95% CIs obtained from multiple linear regression models. Reference group: sustained weight loss + maintenance (trajectory 2).
Adjusted for age, race/ethnicity, education, marital status, household income, and parity.
Model 1 additionally adjusted for prepregnancy BMI (continuous) and total GWG rate.
Model 2 additionally adjusted for hypertensive disorders of pregnancy (plus gestational glucose tolerance status for glucose and HOMA-IR).
Reflects the sample included in models 1 to 3 because of multiple imputation of missing covariates.
Weight change from prepregnancy.
Variables log-transformed before use in regression models.
CRP, C-reactive protein; DBP, diastolic blood pressure; SBP, systolic blood pressure; Total-c, total cholesterol; WC; waist circumference.
Few associations with biochemical and clinical outcomes were observed. Women who were in the fast weight loss + slight gain trajectory, had lower HOMA-IR [−0.44 units (−0.89, 0.00)] and IL-6 [−0.33 units (−0.63, −0.02)], as well as lower SBP [−3.74 mmHg (−7.11, −0.37)] (Model 2). After accounting for the presence of hypertensive disorders of pregnancy, the estimates for SBP were attenuated to include the null value (Model 3). On the other hand, women who were in the little weight loss + slight gain trajectory, compared with the reference trajectory, had higher low-density lipoprotein cholesterol [16.72 mg/dL (1.01, 32.43)], CRP [0.56 units (0.18, 0.94)], and IL-6 [0.33 units (0.09, 0.58)]. These results persisted after full adjustment for prenatal characteristics (Model 3).
Discussion
Using data from Project Viva, we characterized 3 distinct weight trajectories during the first 2 y after delivery, which were associated with prepregnancy BMI, GWG, and lifestyle behaviors during pregnancy. Women in the trajectory characterized by little weight loss + slight gain were heavier and had more central adiposity, inflammation, and low-density lipoprotein cholesterol at 3 y postpartum. The opposite was observed among women who reached their prepregnancy weight shortly after delivery (i.e. fast weight loss + slight gain), who were lighter, and had less central adiposity, lower insulin resistance, and inflammation.
In this study, we took advantage of the availability of repeated weights in Project Viva to characterize the trajectory of postpartum weight, using a data-driven approach. Schmitt et al. conducted a meta-analysis of studies evaluating postpartum weight retention at different times after pregnancy. They found that, on average, weight decreased continuously during the first year and increased afterward (31). This finding is consistent with what we observed in our sample, in which most women lost weight throughout 12 mo and either maintained or regained weight from 12 to 24 mo. We further showed that a subset of women lost little weight after delivery and gained weight from 12 to 24 mo. Abebe et al. used a latent growth mixture model to characterize postpartum weight in 49,528 Norwegian women (19). In this study, they found 3 trajectories using weights at 0.5, 1.5, and 3 y. Two trajectories were characterized by high weight retention at 0.5 y, with either subsequent weight loss or continued weight gain through 3 y. Women in these trajectories did not reach their prepregnancy weight at any time point (19). These could be comparable to our sustained weight loss + maintenance and little weight loss + slight gain trajectories, with the difference that, in our study, women in the former trajectory group almost reached their prepregnancy weight by 12 mo (+0.4 kg). In the study of Abebe et al. the third trajectory comprised women who almost reached their prepregnancy weight by 0.5 y (+0.35 kg), but rather than continuing to lose weight, they gained weight at a low level through the subsequent ∼2 y (19). Contrary to this trend, in our study, 5.7% of women reached their prepregnancy weight by 1 mo and, despite a slight regain in weight from 12 to 24 mo, managed to keep their weight off at 24 mo. The method used by Abebe et al. to characterize weight trajectories accounts for random variability within each trajectory subgroup (19). In contrast, in LCGM, all individuals within a subgroup are assumed to be similar. This might be 1 of the reasons why our findings differ, along with the different times at which weights were assessed in both studies. Another explanation for the discrepancy may be that women included in both studies were different in terms of prepregnancy BMI and GWG. Among the Norwegian women, 71% were normal weight/underweight before pregnancy, and 40% had excessive GWG in contrast to 64% and 57%, respectively, in the present analysis.
In the study of Abebe et al., women with overweight and obesity before pregnancy had increased odds of experiencing a trajectory characterized by high weight retention at 0.5 y, followed by weight gain (19). Consistent with this, we found that women with prepregnancy overweight or obesity had higher odds of assignment to the little weight loss + slight gain trajectory. However, in our study, they were also more likely to fall into the fast weight loss + slight gain trajectory. The GWG experienced by women with prepregnancy overweight and obesity in our study may, to some extent, explain these contradictory findings. Women who fell into the little weight loss + slight gain trajectory had a mean total GWG of 22.2 kg and 19.1 kg for overweight and obese women, respectively, in both cases above the Institute of Medicine recommendations (32). In contrast, women who were categorized into the fast weight loss + slight gain had a lower mean GWG of 11.7 kg (overweight) and 6.1 kg (obese) (data not shown), which would make them more likely to reach their prepregnancy weight after delivery.
A higher total and trimester-specific GWG increased women's odds of falling into the little weight loss + slight gain trajectory and, in agreement with this, decreased their risk of assignment to the fast weight loss + slight gain trajectory. Consistent with our findings, in the study by Abebe et al., women with excessive GWG had a higher risk of being in the trajectory characterized by high initial weight retention, followed by continued weight gain (19). In a meta-analysis, excessive GWG, compared with adequate GWG, was associated with a higher risk of retaining ≥5 kg [OR: 2.08 (95% CI: 1.60, 2.70)] (33). Different studies support a positive association between GWG and weight retention, although most of them have focused only on retention at 1 y (34–36).
Women whose diet during pregnancy was more consistent with a Prudent dietary pattern had lower odds of assignment to the little weight loss + slight gain trajectory. Interestingly, we observed an increased risk of this trajectory in women with a higher intake of SSBs, more hours of TV viewing, and a higher Western dietary pattern score, but the results included the null value. To the best of our knowledge, this is the first study that has evaluated the association of different behavioral factors with weight trajectories after delivery. Although our results might not be directly comparable, previous studies have reported associations between behaviors (TV viewing, walking, energy intake from trans fat, excessive intake of saturated fat, and total energy intake) and weight retention assessed using a single postpartum weight (27, 37, 38) or postpartum weight gain (21, 39). An unexpected finding is that TV viewing was associated, with borderline significance, to higher odds of falling into the fast weight loss + slight gain trajectory [OR: 1.24 (95% CI: 1.00, 1.55)]. We adjusted our models by several relevant confounders; however, we believe that residual confounding, especially by prepregnancy weight, may be responsible for this finding.
In Project Viva, we previously reported associations of GWG with weight-related outcomes 3 y after delivery, including higher weight gain from prepregnancy, WC, and SBP (11). In the present analysis, we extend these results by showing that women in the trajectory characterized by little weight loss + slight gain in the 2 y following delivery also had higher BMI, WC, and weight gain from prepregnancy even after adjustment for GWG. Women in this trajectory also had higher concentrations of inflammatory markers and low-density lipoprotein cholesterol. On the other hand, women in the fast weight loss + slight gain trajectory had lower insulin resistance and inflammatory markers, which was consistent with their lower postpartum BMI and WC. In agreement with this, a study by Berggren et al. conducted in US women showed that returning to the prepregnancy weight was associated with the improvement of metabolic markers after pregnancy (40).
Strengths and limitations
The use of repeated assessments of maternal weight allowed us to characterize the course of postpartum weight and to identify women following distinct weight trajectories. Furthermore, we were able to assess the contribution of weight retained from pregnancy and weight gained after delivery to the weight trajectories. Given the availability of prospectively collected information in Project Viva, we could identify key prenatal and perinatal predictors of postpartum weight change and evaluate the associations between weight trajectories and cardiometabolic outcomes years after delivery. An additional strength is that in our analyses, we maintained a clear temporal relation between the exposures and outcomes assessed. Since the trajectories of postpartum weight were confined to the postpartum period (1–24 mo), we did not include any predictor that was measured during this time. Following the described reasoning, we chose not to include breastfeeding as a predictor. Also, we studied behaviors (i.e. diet, physical activity, and TV viewing) that were assessed during pregnancy and not postpartum. However, there is evidence that dietary patterns assessed during pregnancy are a good representation of women's preconception and postpartum diets (41, 42).
Our study also has some limitations. First, in LCGM, each participant is assigned to a single latent class based on their posterior probabilities of membership, but the true class is unknown. Therefore, assigning people to the wrong class can introduce measurement error and attenuate the effect estimates (43). Second, prepregnancy weight was based on self-report, which is likely subject to bias. However, in this cohort, self-reported weight was highly correlated (r = 0.99) with clinically measured weight recorded 3 mo before pregnancy (27). Weights at 12 and 24 mo were also self-reported, but we accounted for the method of weight assessment in the LCGM. Third, generalizability may be limited since our sample was comprised of predominantly white, high income, and highly educated women who may not be comparable to reproductive-aged women in the USA. Fourth, for the assessment of physical activity, we used an instrument modified from a scale used in the elderly, which has not been validated in other pregnant populations. Fifth, the results on biochemical outcomes, especially glucose, insulin, and lipids, must be interpreted with caution because of the limited sample available for these analyses (n = 164). Sixth, in our study, we only included 65% (weight trajectory analysis) and 42% (outcome analysis) of women enrolled in Project Viva, which were different from those not included in terms of age, race/ethnicity, education, marital status, income, and smoking. This may have increased the possibility of selection bias; however, there was no evidence that exposure status (i.e. predictors in the weight trajectory analysis), was different between included and not included women. Finally, we cannot completely rule out the possibility of chance findings.
In conclusion, a trajectory characterized by little weight loss + slight gain after delivery is associated with increased adiposity and metabolic alterations in women at 3 y postpartum. If these alterations persist, they may put women at higher long-term risk of type 2 diabetes and coronary heart disease (44, 45). Targeting modifiable factors such as diet and weight gain during pregnancy could help to improve maternal weight outcomes after delivery. On the other hand, our findings emphasize the importance of the first 2 y postpartum as a window of opportunity to optimize maternal weight. Interventions to promote weight loss, especially in high-risk women, such as those with prepregnancy overweight/obesity and high GWG, may have the potential to improve their trajectory of weight change and long-term health.
Supplementary Material
Acknowledgments
We thank the participants and staff of Project Viva.
The authors’ responsibilities were as follows—DCS-C and EO: designed the study with input from WP and IMA; SLR-S and DCS-C: performed statistical analysis with input from IMA and EO; DCS-C and EO: interpreted the results; DCS-C: prepared the draft manuscript with input from EO, SLR-S, KMS, WP, IMA, BT-V, MMT-R, and RL-R; DCS-C: had primary responsibility for final content; and all authors read and approved the final manuscript.
Notes
This work was supported by grants from the US NIH (R01 HD034568, UH3 OD023286).
Author disclosures: The authors report no conflicts of interest.
Supplemental Tables 1 and 2 are available from the ‘‘Supplementary data’’ link in the online posting of the article and the same link in the online table of contents at https://academic.oup.com/jn.
Abbreviations used: CRP, C-reactive protein; GWG, gestational weight gain; LCGM, latent class growth model; SBP, systolic blood pressure; SSB, sugar-sweetened beverage; TV, television; WC, waist circumference.
Contributor Information
Diana C Soria-Contreras, Center for Nutrition and Health Research, National Institute of Public Health, Cuernavaca, Morelos, Mexico.
Sheryl L Rifas-Shiman, Division of Chronic Disease Research Across the Lifecourse, Department of Population Medicine, Harvard Medical School, and Harvard Pilgrim Health Care Institute, Boston, MA, USA.
Izzuddin M Aris, Division of Chronic Disease Research Across the Lifecourse, Department of Population Medicine, Harvard Medical School, and Harvard Pilgrim Health Care Institute, Boston, MA, USA; Department of Obstetrics and Gynecology, Yong Loo Lin School of Medicine, National University of Singapore, Singapore; Agency for Science, Technology and Research, Singapore Institute for Clinical Sciences, Singapore.
Wei Perng, Department of Epidemiology, Colorado School of Public Health, University of Colorado Denver, Anschutz Medical Campus, Aurora, CO, USA; Lifecourse Epidemiology of Adiposity and Diabetes (LEAD) Center, Colorado School of Public Health, University of Colorado Denver, Anschutz Medical Campus, Aurora, CO, USA.
Karen M Switkowski, Division of Chronic Disease Research Across the Lifecourse, Department of Population Medicine, Harvard Medical School, and Harvard Pilgrim Health Care Institute, Boston, MA, USA.
Martha M Téllez-Rojo, Center for Nutrition and Health Research, National Institute of Public Health, Cuernavaca, Morelos, Mexico.
Belem Trejo-Valdivia, Center for Nutrition and Health Research, National Institute of Public Health, Cuernavaca, Morelos, Mexico.
Ruy López-Ridaura, Center for Population Health Research, National Institute of Public Health, Cuernavaca, Morelos, Mexico.
Emily Oken, Division of Chronic Disease Research Across the Lifecourse, Department of Population Medicine, Harvard Medical School, and Harvard Pilgrim Health Care Institute, Boston, MA, USA; Department of Nutrition, Harvard T.H. Chan School of Public Health, Boston, MA, USA.
References
- 1. Hales CM, Carroll MD, Fryar CD, Ogden CL.. Prevalence of obesity among adults and youth: United States, 2015–2016. NCHS Data Brief. 2017;; 288:1–8. [PubMed] [Google Scholar]
- 2. Poston L, Caleyachetty R, Cnattingius S, Corvalan C, Uauy R, Herring S, Gillman MW. Preconceptional and maternal obesity: epidemiology and health consequences. Lancet Diabetes Endocrinol. 2016;4:1025–36. [DOI] [PubMed] [Google Scholar]
- 3. Gillman MW. Interrupting intergenerational cycles of maternal obesity. Nestle Nutr Inst Workshop Ser. 2016;85:59–69. [DOI] [PMC free article] [PubMed] [Google Scholar]
- 4. Cohen AK, Chaffee BW, Rehkopf DH, Coyle JR, Abrams B. Excessive gestational weight gain over multiple pregnancies and the prevalence of obesity at age 40. Int J Obes. 2014;38:714–8. [DOI] [PMC free article] [PubMed] [Google Scholar]
- 5. Hutchins F, Abrams B, Brooks M, Colvin A, Moore Simas T, Rosal M, Sternfeld B, Crawford S. The effect of gestational weight gain across reproductive history on maternal body mass index in midlife: the study of women's health across the nation. J Womens Health. 2020;29:148–57. [DOI] [PMC free article] [PubMed] [Google Scholar]
- 6. Davis EM, Babineau DC, Wang X, Zyzanski S, Abrams B, Bodnar LM, Horwitz RI. Short inter-pregnancy intervals, parity, excessive pregnancy weight gain and risk of maternal obesity. Matern Child Health J. 2014;18:554–62. [DOI] [PMC free article] [PubMed] [Google Scholar]
- 7. Kirkegaard H, Stovring H, Rasmussen K, Abrams B, Sorensen T, Nohr E. How do pregnancy-related weight changes and breastfeeding relate to maternal weight and BMI-adjusted waist circumference 7 y after delivery? Results from a path analysis. Am J Clin Nutr. 2014;99:312–9. [DOI] [PMC free article] [PubMed] [Google Scholar]
- 8. Soria-Contreras DC, Trejo-Valdivia B, Cantoral A, Pizano-Zárate ML, Baccarelli AA, Just AC, Colicino E, Deierlein AL, Wright RO, Oken E. Patterns of weight change one year after delivery are associated with cardiometabolic risk factors at six years postpartum in Mexican women. Nutrients. 2020;12:E170. [DOI] [PMC free article] [PubMed] [Google Scholar]
- 9. Widen EM, Whyatt RM, Hoepner LA, Ramirez-Carvey J, Oberfield SE, Hassoun A, Perera FP, Gallagher D, Rundle AG. Excessive gestational weight gain is associated with long-term body fat and weight retention at 7 y postpartum in African American and Dominican mothers with underweight, normal, and overweight prepregnancy BMI. Am J Clin Nutr. 2015;102:1460–7. [DOI] [PMC free article] [PubMed] [Google Scholar]
- 10. McClure CK, Catov JM, Ness R, Bodnar LM. Associations between gestational weight gain and BMI, abdominal adiposity, and traditional measures of cardiometabolic risk in mothers 8 y postpartum. Am J Clin Nutr. 2013;98:1218–25. [DOI] [PMC free article] [PubMed] [Google Scholar]
- 11. Walter JR, Perng W, Kleinman KP, Rifas-Shiman SL, Rich-Edwards JW, Oken E. Associations of trimester-specific gestational weight gain with maternal adiposity and systolic blood pressure at 3 and 7 years postpartum. Am J Obstet Gynecol. 2015;212:499.e1–12. [DOI] [PMC free article] [PubMed] [Google Scholar]
- 12. Fraser A, Tilling K, Macdonald C, Hughes R, Sattar N. Associations of gestational weight gain with maternal body mass index, waist circumference, and blood pressure measured 16 y after pregnancy: the Avon Longitudinal Study of Parents and Children. Am J Clin Nutr. 2011;93:1285–92. [DOI] [PMC free article] [PubMed] [Google Scholar]
- 13. Phelan S, Wing RR, Brannen A, McHugh A, Hagobian T, Schaffner A, Jelalian E, Hart CN, Scholl TO, Muñoz-Christian K. Does partial meal replacement during pregnancy reduce 12-month postpartum weight retention?. Obesity. 2019;27:226–36. [DOI] [PMC free article] [PubMed] [Google Scholar]
- 14. Herring SJ, Cruice JF, Bennett GG, Darden N, Wallen JJ, Rose MZ, Davey A, Foster GD. Intervening during and after pregnancy to prevent weight retention among African American women. Prev Med Reports. 2017;7:119–23. [DOI] [PMC free article] [PubMed] [Google Scholar]
- 15. Vesco KK, Leo MC, Karanja N, Gillman MW, McEvoy CT, King JC, Eckhardt CL, Smith KS, Perrin N, Stevens VJ. One-year postpartum outcomes following a weight management intervention in pregnant women with obesity. Obesity. 2016;24:2042–9. [DOI] [PMC free article] [PubMed] [Google Scholar]
- 16. Phelan S, Clifton RG, Haire-Joshu D, Redman LM, Van Horn L, Evans M, Joshipura K, Couch KA, Arteaga SS, Cahill AG. One-year postpartum anthropometric outcomes in mothers and children in the LIFE-Moms lifestyle intervention clinical trials. Int J Obes. 2020;44:57–68. [DOI] [PMC free article] [PubMed] [Google Scholar]
- 17. Hanson M, Barker M, Dodd JM, Kumanyika S, Norris S, Steegers E, Stephenson J, Thangaratinam S, Yang H. Interventions to prevent maternal obesity before conception, during pregnancy, and post partum. Lancet Diabetes Endocrinol. 2017;5:65–76. [DOI] [PubMed] [Google Scholar]
- 18. Ma RCW, Schmidt MI, Tam WH, McIntyre HD, Catalano PM. Clinical management of pregnancy in the obese mother: before conception, during pregnancy, and post partum. Lancet Diabetes Endocrinol. 2016;4:1037–49. [DOI] [PMC free article] [PubMed] [Google Scholar]
- 19. Abebe DS, Von Soest T, Von Holle A, Zerwas SC, Torgersen L, Bulik CM. Developmental trajectories of postpartum weight 3 years after birth: Norwegian Mother and Child Cohort study. Matern Child Health J. 2015;19:917–25. [DOI] [PMC free article] [PubMed] [Google Scholar]
- 20. Kew S, Ye C, Hanley AJ, Connelly PW, Sermer M, Zinman B, Retnakaran R. Cardiometabolic implications of postpartum weight changes in the first year after delivery. Dia Care. 2014;37:1998–2006. [DOI] [PubMed] [Google Scholar]
- 21. Skreden M, Hillesund ER, Wills AK, Brantsaeter AL, Bere E, Overby NC. Adherence to the New Nordic Diet during pregnancy and subsequent maternal weight development: a study conducted in the Norwegian Mother and Child Cohort Study (MoBa). Br J Nutr. 2018;119:1286–94. [DOI] [PubMed] [Google Scholar]
- 22. Oken E, Baccarelli AA, Gold DR, Kleinman KP, Litonjua AA, De Meo D, Rich-Edwards JW, Rifas-Shiman SL, Sagiv S, Taveras EM et al.. Cohort profile: Project Viva. Int J Epidemiol. 2015;44:37–48. [DOI] [PMC free article] [PubMed] [Google Scholar]
- 23. World Health Organization (WHO). Obesity: preventing and managing the global epidemic. Report of a WHO consultation. World Health Organ Tech Rep Ser. 2000. [PubMed] [Google Scholar]
- 24. Fawzi WW, Rifas-Shiman SL, Rich-Edwards JW, Willett WC, Gillman MW. Calibration of a semi-quantitative food frequency questionnaire in early pregnancy. Ann Epidemiol. 2004;14:754–62. [DOI] [PubMed] [Google Scholar]
- 25. Lange NE, Rifas-Shiman SL, Camargo CAJ, Gold DR, Gillman MW, Litonjua AA. Maternal dietary pattern during pregnancy is not associated with recurrent wheeze in children. J Allergy Clin Immunol. 2010;126:250–5. [DOI] [PMC free article] [PubMed] [Google Scholar]
- 26. Pereira MA, Rifas-Shiman SL, Kleinman KP, Rich-Edwards JW, Peterson KE, Gillman MW. Predictors of change in physical activity during and after pregnancy: Project Viva. Am J Prev Med. 2007;32:312–9. [DOI] [PMC free article] [PubMed] [Google Scholar]
- 27. Oken E, Taveras EM, Popoola FA, Rich-Edwards JW, Gillman MW. Television, walking, and diet: associations with postpartum weight retention. Am J Prev Med. 2007;32:305–11. [DOI] [PMC free article] [PubMed] [Google Scholar]
- 28. Perng W, Stuart J, Rifas-Shiman SL, Rich-Edwards JW, Stuebe A, Oken E. Preterm birth and long-term maternal cardiovascular health. Ann Epidemiol. 2015;25:40–5. [DOI] [PMC free article] [PubMed] [Google Scholar]
- 29. Andruff H, Carraro N, Thompson A, Gaudreau P. Latent class growth modelling: a tutorial. Tutorials in Quantitative Methods for Psychology. 2009;5:11–24. [Google Scholar]
- 30. Jones BL, Nagin DS. A note on a Stata plugin for estimating group-based trajectory models. Sociol Methods Res. 2013;42:608–13. [Google Scholar]
- 31. Schmitt NM, Nicholson WK, Schmitt J. The association of pregnancy and the development of obesity – results of a systematic review and meta-analysis on the natural history of postpartum weight retention. Int J Obes. 2007;31:1642–51. [DOI] [PubMed] [Google Scholar]
- 32. Institute of Medicine (US) and National Research Council (US) Committee to Reexamine IOM Pregnancy Weight Guidelines, Rasmussen KM, Yaktine AL. Weight gain during pregnancy: reexamining the guidelines. Washington (DC): National Academies Press (US); 2009. [PubMed] [Google Scholar]
- 33. Rong K, Yu K, Han X, Szeto IMY, Qin X, Wang J, Ning Y, Wang P, Ma D. Pre-pregnancy BMI, gestational weight gain and postpartum weight retention: a meta-analysis of observational studies. Public Health Nutr. 2015;18:2172–82. [DOI] [PMC free article] [PubMed] [Google Scholar]
- 34. Rode L, Kjærgaard H, Ottesen B, Damm P, Hegaard HK. Association between gestational weight gain according to body mass index and postpartum weight in a large cohort of Danish women. Matern Child Health J. 2012;16:406–13. [DOI] [PubMed] [Google Scholar]
- 35. Oken E, Kleinman KP, Belfort MB, Hammitt JK, Gillman MW. Associations of gestational weight gain with short- and longer-term maternal and child health outcomes. Am J Epidemiol. 2009;170:173–80. [DOI] [PMC free article] [PubMed] [Google Scholar]
- 36. Olson CM, Strawderman MS, Hinton PS, Pearson TA. Gestational weight gain and postpartum behaviors associated with weight change from early pregnancy to 1 y postpartum. Int J Obes Relat Metab Disord. 2003;27(1):117–27. [DOI] [PubMed] [Google Scholar]
- 37. Althuizen E, Van Poppel MN, De Vries JH, Seidell JC, Van Mechelen W. Postpartum behaviour as predictor of weight change from before pregnancy to one year postpartum. BMC Public Health. 2011;11:165. [DOI] [PMC free article] [PubMed] [Google Scholar]
- 38. Boghossian NS, Yeung EH, Lipsky LM, Poon AK, Albert PS. Dietary patterns in association with postpartum weight retention. Am J Clin Nutr. 2013;97:1338–45. [DOI] [PMC free article] [PubMed] [Google Scholar]
- 39. Kirkegaard H, Stovring H, Rasmussen KM, Abrams B, Sorensen T, Nohr EA. Maternal weight change from prepregnancy to 7 years postpartum – the influence of behavioral factors. Obesity. 2015;23:870–8. [DOI] [PubMed] [Google Scholar]
- 40. Berggren EK, Presley L, Amini SB, Hauguel-de Mouzon S, Catalano PM. Are the metabolic changes of pregnancy reversible in the first year postpartum?. Diabetologia. 2015;58:(7):1561–8. [DOI] [PMC free article] [PubMed] [Google Scholar]
- 41. Cucó G, Fernandez-Ballart J, Sala J, Viladrich C, Iranzo R, Vila J, Arija V. Dietary patterns and associated lifestyles in preconception, pregnancy and postpartum. Eur J Clin Nutr. 2006;60:364–71. [DOI] [PubMed] [Google Scholar]
- 42. Crozier SR, Robinson SM, Godfrey KM, Cooper C, Inskip HM. Women's dietary patterns change little from before to during pregnancy. J Nutr. 2009;139:1956–63. [DOI] [PMC free article] [PubMed] [Google Scholar]
- 43. Bray BC, Lanza ST, Tan X. Eliminating bias in classify-analyze approaches for latent class analysis. Struct Equ Modeling. 2015;22:1–11. [DOI] [PMC free article] [PubMed] [Google Scholar]
- 44. Willett WC, Manson JE, Stampfer MJ, Colditz GA, Rosner B, Speizer FE, Hennekens CH. Weight, weight change, and coronary heart disease in women. Risk within the “normal” weight range. JAMA. 1995;273:461–5. [DOI] [PubMed] [Google Scholar]
- 45. Colditz GA, Willett WC, Rotnitzky A, Manson JE. Weight gain as a risk factor for clinical diabetes mellitus in women. Ann Intern Med. 1995;122:481–6. [DOI] [PubMed] [Google Scholar]
Associated Data
This section collects any data citations, data availability statements, or supplementary materials included in this article.