

Abstract
The objective 1 of this study was to investigate trends in breast cancer (BC) prediction using machine learning (ML) publications by analysing country, first author, journal, institutional collaborations and co-occurrence of author keywords. The objective 2 was to provide a review of studies on BC prediction using ML and a blood analysis dataset (Breast Cancer Coimbra Dataset [BCCD]), and the objective 3 was to provide a brief review of studies based on BC prediction using ML and patients’ fine needle aspirate cytology data (Wisconsin Breast Cancer Dataset [WBCD]). The design of this study was as follows: for objective 1: bibliometric analysis, data source PubMed (2015-2019); for objective 2: systematic review, data source: Google and Google Scholar (2018-2019); for objective 3: systematic review, data source: Google Scholar (2016-2019). The inclusion criteria for objective 1 were all publication results yielded from the searches. All English papers that had a ‘PDF’ option from the search results were included for objective 2. A sample of the ‘PDF’ English papers were included for objective 3. All 116 female patients from the BCCD, consisting of 64 positive BC patients and 52 controls were included in the study for objective 2. For the WBCD, all 699 female patients comprising of 458 with a benign BC tumour and 241 with a malignant BC tumour were included for objective 3. All 2928 publications were included for objective 1. The results showed that the United States of America (USA) produced the highest number of publications (n=803). In total, 2419 first authors contributed towards the publications. Breast Cancer Research and Treatment was the highest ranked journal. Institutional collaborations mainly occurred within the USA. The use of ML for BC screening and detection was the most researched topic. A total of 19 distinct papers were included for objectives 2 and 3. The findings from these studies were never presented to clinicians for validations. In conclusion, the use of ML for BC screening and detection is promising.
Significance for public health.
This is the first study to perform a snapshot of a bibliometric analysis on the topic of breast cancer (BC) prediction using machine learning (ML) by analysing publications from an online electronic database. This is also the first systematic review on studies that have focused on BC prediction using ML and a blood analysis dataset, specifically, the new publicly available Breast Cancer Coimbra Dataset (BCCD) which has the potential in identifying more efficient and cheap BC biomarkers and ML models. Additionally, we conducted a brief systematic review of studies focused on BC prediction using ML and a publicly available fine needle aspirate cytology dataset called the Wisconsin Breast Cancer Dataset (WBCD), which may also discover BC biomarkers. It is evident that the use of ML for BC screening, detection and identification of potential BC biomarkers is promising, however, these results need to be showcased to clinicians for validations.
Key words: Breast cancer, cancer screening, fine needle aspiration, blood tests, machine learning
Introduction
Breast cancer
Brief overview of breast cancer
Breast cancer (BC) is a global terminal disease that has always been known for its high prevalence in both incidence and mortality rates. Due to BC’s complex nature, there is still no cure, despite ongoing attempts worldwide.1 Similarly, the precise cause of BC remains unclear, although researchers have, to date, identified potential risk factors, such as: i) gender; ii) aging; iii) gene mutations; iv) family history; and v) unhealthy lifestyles.2 The management of the disease is dependent on treatment by clinicians. To this end, the early identification of BC (through BC screening and detection methods) is important so that the disease is identified during its initial stages when malignant cells are local to the breast(s) only. If not caught early, the malignant BC cells spread to other parts of the body and patients are often subjected to much more complex, invasive treatments. Patients with late diagnosis often have lower survival rates and may die soon after being diagnosed.
Traditional global breast cancer screening methods
Developing and developed countries utilize different mediums for BC screening, depending on resource availability. Developing countries commonly rely on breast self-examination (BSE) and clinical breast examination (CBE) for BC screening.3 On the other hand, developed countries often use mammography for the same purpose.4
Traditional global breast cancer detection methods
The triple assessment test is termed the ‘gold standard’ for BC detection and is traditionally used worldwide. A combination of three tests together form the triple assessment test: CBE, radiological imaging (mammography and/ or ultrasonography) and pathology (fine needle aspirate cytology [FNAC] or core needle biopsy).5 A patient is positively diagnosed with BC if at least one of these three tests indicate malignancy and the result is negative for BC if all three tests indicate a benign breast condition.5
Despite the use of the aforementioned methods in identifying BC, both global incidence and mortality rates remain high. A recent comprehensive global cancer study by the Global Burden of Disease Cancer Collaboration reported BC as third (1.7 million incidents and 535,000 deaths) in the global top ten highest cancer incidences in 2016.6 The majority of these BC incidents and deaths were among women.6 In addition, traditional methods of identifying diseases such as BC in medicine is based on a linear approach called regression.7,8 Regression assumes that the BC risk factors are linearly related.9 However, these risk factors are usually not linearly related and regression methods may therefore be unreliable. 9 The machine learning approach does not assume linearity and may form an alternative basis for more efficient BC identification methods.
Machine learning
What is machine learning?
Machine learning (ML) is used to program computers to identify patterns from data in different domains by the creation of mathematical models.10 Although ML has been in existence since the 1950s, the field is currently growing at an exponential rate worldwide.11 The reason for this rapid growth is due to a similar trend in the vast creation of data and massive computing power.11 At present, ML is widely employed in domains such as banking, education, government, agriculture and medicine. There are two main categories of ML: supervised learning and unsupervised learning.12 Under supervised learning, ‘classification’ is a prominent sub-category widely employed in the medical domain, and is the focus of the review portion of this paper.
Similitude of the machine learning classification process to the human life cycle
The ML classification process can be likened to the human life cycle. In this cycle, a male and female (parents) produce a child. Once the child is born, as he or she grows, the parents teach the child various things. For example, the child is pointed to an apple and learns, ‘this is a fruit’. When the child sees a different apple, if he or she is able to identify the apple as a fruit, the child would have learnt well. Otherwise, the child would fail to identify the new apple.
An overview of the machine learning classification process
Similarly, during the ML classification process, a model (child) is built using an algorithm (parents). There are many different algorithms, such as the famous Logistic Regression (LR). Models can be built using a single algorithm or a combination of algorithms (ensemble). Models are trained using a portion of data, called the ‘training set’, for example BC data (this can be likened to how the parents teach a child to identify apples). Then, the model is tested on unfamiliar data (‘test set’) for the same concept (the child is presented with a new apple to classify). If the model is able to accurately identify the concept, such as ‘BC tumour present’, then the model is said to be good and robust. Otherwise, the model is poor and will require more training.
Using machine learning for breast cancer prediction
Importance of BC prediction using ML for BC screening and detection
Patient data obtained from BC screening or detection methods may be used to create ML models for predicting BC. An example of this data are results from FNAC tests. However, finding a cheaper and more efficient set of BC data predictors such as results from patients’ routine anthropometric blood tests would be a better approach. If a model consistently performs well using this blood data, the model can be used to build an Artificial Intelligence (AI) tool. After rigorous testing, the tool may be presented to the Food and Drug Administration (FDA) for assessment. After the tool gains FDA approval, the tool may be used by clinicians in clinical settings to identify BC in patients. The clinicians would input a patient’s blood result data into the tool and the tool would output the likelihood of a patient having BC. This would be a more efficient process and a potential first-step for screening and detecting BC in patients compared to the fairly inefficient, invasive and expensive traditional methods that patients are first subjected to.
Research trends in the BC prediction using ML field
A considerable amount of literature has been published on applications of BC prediction using ML. However, it is difficult to keep track of the span of knowledge generated in terms of publication trends in this field. Bibliometric analysis is a tool generally used in the biomedical sciences to statistically analyse biomedical literature from online databases such as PubMed for assessment of research trends. For instance, bibliometric analyses have been published on cancer,13 tuberculosis14 and public health.15,16 However, to our knowledge, there has been no bibliometric analysis study focused specifically on the BC prediction using ML field. By conducting a bibliometric analysis, it is possible to examine trends in countries of publications, first authors, journals, institutional collaborations and co-occurrence of author keywords. This would provide insight and aid researchers in conducting future research within this field.
Context of this paper
The publicly available Wisconsin BC Dataset (WBCD), based on patients’ FNAC biopsy test results, is most popularly used by researchers in studies focused on BC prediction using ML, since this dataset became available online in the 1990s.17,18 Previous work by Yue et al.,19 which reviewed studies on BC prediction using ML over a number of years, up to 2017, focused on the WBCD and only four ML algorithms. Since it was resource intensive to perform FNAC biopsy tests on patients to obtain this data, a cheaper and more efficient method was required to obtain a set of patients’ BC data predictors.
Since Yue et al.’s work,19 the new BC Coimbra Dataset (BCCD), containing patients’ routine anthropometric blood analysis data to distinguish between patients who were positive or negative for BC, was uploaded online by Patrício et al.20 There has since been a growing number of studies published focused on using the BCCD and ML for BC prediction.
To investigate the five-year (2015-2019) global trend of publications (analysis of country, first author, journal, institutional collaborations and co-occurrence of author keywords) from the PubMed database focused on BC prediction using ML;
To review BC prediction studies focused on ML and the blood analysis BCCD since its inception, from 2018 to 2019; and
To provide a brief overview of ML and WBCD studies from 2016 to 2019. For years 2016 and 2017, we review studies not covered in Yue et al.’s19 work.
To the best of our knowledge, this is the first work on a bibliometric analysis of BC prediction using ML publications. To our knowledge, this is also the first work providing insight on studies that have explored the efficacy of using blood analysis data and ML for BC prediction. This is because the BCCD is so new. Some BC and ML concepts and terminologies are briefly tabulated in online supplementary Table 1.
Methods
Search strategy and study selection
This systematic review was conducted in accordance with the Preferred Reporting Items for Systematic Reviews and Meta- Analyses (PRISMA) 2009 Statement.21 The search strategies and study selection for the three objectives are provided below.
For objective 1
PubMed searches were performed in October 2019 using the following settings: all publications sorted by most recent and publication dates set to five years for the human species and all article types. An alternative to PubMed is the online Scopus22 or Web of Science23 databases. However, these were not chosen because of the costs associated with gaining access to these databases. In contrast, the bibliometric data in PubMed is freely accessible.
Analysis by country
For analysis of country, a list of countries throughout the world (n=195) was first created in Microsoft Excel® based on rankings by most populous (https://www.worldometers.info/ geography/how-many-countries-are-there-in-the-world/). An example of a country search query for China (affiliation filter) is provided in Supplementary Table 2. Five different synonyms for the term ‘Breast Cancer’ and 15 synonyms for the term ‘Machine Learning’ (inclusive of names of common ML algorithms) were used, joined with the ‘AND’ keyword. In total, PubMed would have therefore searched for a total of (1 x 5 x 15) = 75 combinations in the contents of its publications. The number of publications were then sorted, and the top ten countries with the most publications were selected.
Analysis by first author and journal
For analysis of first author and journal, respectively, the keywords for the database search are depicted in Supplementary Table 3. The keywords for this search are similar to that of Supplementary Table 2, but with the affiliation filter removed. A Comma-Separated Values (CSV) file was then generated from PubMed, with an export of the results yield from the above search. Analysis was performed by first loading the data from the CSV file into a similarly structured table created in a MySQL database, followed by programmatic computations based on the total number of publications by first author and journal, respectively. The results were sorted and the top ten first authors and journals were finally selected.
Analysis of institutional collaborations and co-occurrence of author keywords
For analysis of institutional collaborations and co-occurrence of author keywords, the MEDLINE file from PubMed was exported with the results yield from the database search shown in online Supplementary Table 3. The MEDLINE file was used as input into a computer program called VOSviewer (https://www.vosviewer.com/)24 to visually analyse the literature by institutional collaborations and co-occurrence of author keywords. The MEDLINE file was used because it is the only supported input file for PubMed in VOSviewer. In this study, network nodes in the visuals produced from VOSviewer represent institutions or author keywords.
For objective 2
A search was performed on Google with the text-word search terms “breast cancer Coimbra” in September 2019. This search strategy was employed because it provided access to papers published on patients’ blood analysis data for BC prediction using ML. The study by Patrício et al.20 was included as a primary study for this dataset. Thereafter, the “Cited by…” website link on the primary study was clicked. This took us to Google Scholar, where all papers that had referenced the primary study, were listed. We included all papers that had a downloadable ‘PDF’ option on the right-hand side, alongside the respective paper listing, during the time of the search. Only papers published in English were reviewed. In the attempt to include all English papers, there were two papers that were not freely available online and ZS purchased these and included them. These papers were by Hung et al.25 and Singh.26 Finally, although Polat’s and Senturk’s27 and Akben’s28 papers did not have a ‘PDF’ option, we consulted with a senior librarian who was able to provide us with access to these two papers and these were included in this study.
For objective 3
The text-word search terms “breast cancer prediction using machine learning and wisconsin breast cancer data” was used to search Google Scholar in September 2019. This search strategy was chosen because it provided access to papers published based on patients’ FNAC biopsy test result data for BC prediction using ML. For the years 2016 and 2017, the ‘Custom Range’ option was clicked on the left-hand side and the ‘from’ and ‘to’ textboxes for the respective year were completed. The ‘Search’ button was then clicked. For the years 2018 and 2019, the ‘Since <year>’ link was clicked, which is located above the ‘Custom range’ option. In both instances, the sort order was set to ‘Sort by relevance’. Starting from the top of the list of papers returned by Google Scholar for the search, if a paper had a downloadable ‘PDF’ option next to it, we read through the paper briefly to verify that the WBCD was the focus of the study and that ML classification was the paradigm used. Only papers published in English were reviewed. Furthermore, for 2016 and 2017 papers, we cross-checked against Yue et al.’s19 review and excluded any papers that were already mentioned there, so as to avoid duplication.
Finally, for both objectives 2 and 3, Google and/or Google Scholar were used for the search because of the higher likelihood of gaining access to the full papers in PDF format, as compared to, for example, PubMed.
Data source
For objective 2
Breast cancer Coimbra dataset
This publicly available anthropometric blood analysis data was created by Patrício et al.20 at the Faculty of Medicine of the University of Coimbra and uploaded online in 2018. The data comprises 116 patients, of which 64 (55%) were positively diagnosed with BC and 52 (45%) without BC (the controls). There are nine clinical independent features: Age (years), BMI (kg/m2), Glucose (mg/dL), Insulin (μU/mL), Homeostasis Model Assessment (HOMA), Leptin (ng/mL), Adiponectin (μg/mL), Resistin (ng/mL) and Chemokine Monocyte Chemoattractant Protein 1 (MCP-1) (pg/dL). The dependant feature has two classes: ‘BC tumour present’ (value equals ‘2’) and ‘BC tumour absent’ (value equals ‘1’). There are no missing data in the BCCD. The BCCD is available at: https://archive.ics.uci. edu/ml/datasets/Breast+Cancer+Coimbra and details of this dataset can be found in Patrício et al.20
For objective 3
Wisconsin breast cancer diagnosis dataset
The Wisconsin Breast Cancer Dataset (WBCD) consists of nuclear features of FNAC biopsy test result data taken from patients’ breasts, and was created by Dr William H. Wolberg18 at the University of Wisconsin Hospitals and made available online in 1992. The dataset contains records collected from 699 patients of which 458 (65.5%) were from patients who had a benign BC tumour and 241 (34.5%) cases were from patients with a malignant BC tumour. The nine independent features are: Clump Thickness, Uniformity of Cell Size, Uniformity of Cell Shape, Marginal Adhesion, Single Epithelial Cell Size, Bare Nuclei, Bland Chromatin, Normal Nucleoli and Mitoses. All nine features have values in the range between 1 to 10, where 1 represents a normal state and 10 represents a most abnormal state. The dependant Diagnosis feature has either a value of 4 or 2, where 4 denotes malignant BC tumour diagnosis and 2 denotes benign BC tumour diagnosis. From the 699 records, 16 records have missing values for the ‘Bare Nuclei’ feature. The WBCD is available at: https://archive.ics.uci.edu/ml/datasets/ Breast+Cancer+Wisconsin+%28Original%29.
Summary measures
For objectives 2 and 3
After a ML model is trained, it is tested using an unfamiliar portion of a dataset, called the ‘test set’. The Confusion Matrix (CM) table is used for evaluation of this model’s performance. In the case of both the BCCD and the WBCD, since there are two classes for these datasets, respectively, the CM forms a twoby- two table, showing total actual versus predicted values per class. True Positive (TP) and True Negative (TN) are the correct predictions made by a model. False Negative (FN) and False Positive (FP) are the incorrect predictions made by a model. The TP value is located in row 1, column 1 of the CM and FN is located in row 1, column 2 of the CM. The FP value is located in row 2, column 1 of the CM and TN is located in row 2, column 2 of the CM.
Using the CM, the following metrics are traditionally used to evaluate model performances in ML studies: i) accuracy; ii) precision; iii) recall or sensitivity; iv) specificity; v) F1 score; vi) Receiver Operating Characteristics (ROC) curve; and vii) Area Under the ROC Curve (AUC). Calculations for these are provided in eqs. (1)-(5).29,30
| eq. 1 |
| eq. 2 |
| eq. 3 |
| eq. 4 |
| eq. 5 |
The F1 score is known as the harmonic mean of recall and precision. 10 The ROC curve is a two-dimensional graph showing one minus specificity on the axis and sensitivity on the axis.10 The AUC is obtained from the whole area under the ROC curve and shows performances of both classes of a model. Finally, for all the aforementioned metrics, the highest value is one, meaning 100% or best performance and the lowest value is zero.
Patient and public involvement
Patients and the public were not directly involved in planning this study.
Results
Study selection
For objective 1
For the analysis by country, results were found for 86 of the 195 countries. The results were sorted from highest to lowest according to the total number of publications. The top ten countries were selected based on the highest total number of publications.
For the analysis by first author, journal, institutional collaborations and co-occurrence of author keywords, 2928 records were returned from the search, of which there were approximately 2419 distinct first authors and 670 distinct journals. The top ten first authors and journals were selected after computations of the total number of publications and sorting these from highest to lowest. The VOSviewer computer program found 10100 distinct institutions from the MEDLINE file. Of these 10100 institutions, institutional collaborations were found for nine and these were included in this category’s analysis. The VOSviewer computer program identified 4755 different author keywords in the MEDLINE file, of which 123 were found to have co-occurrence by author keywords and were included in this analysis.
For objective 2
The results presented following the PRISMA flow diagram (Figure 1)21 depicts the search process and study selection. Primary searches of Google and Google Scholar yielded 16 potentially relevant papers. Since there were no duplicates, the 16 papers were screened. After reading the titles and abstracts of these 16 papers, two papers were excluded for the following respective reasons: i) the study did not use the blood analysis BCCD and Patrício et al.’s20 study was instead referenced to explain a ML algorithm; and ii) Patrício et al.’s20 study was referenced for experimental results and not to actually create any ML classification models based on the BCCD. The full texts of the remaining 14 papers were reviewed and another three excluded for any of the following reasons: i) the study did not use ML classification and instead used semi-supervised ML; ii) Patrício et al.’s20 study was referenced under related work and the BCCD was not used for model creation; iii) models were created using statistics and not ML classification. Therefore, 11 eligible studies were ultimately included.20,25-28,30-35
For objective 3
For years 2016 to 2017, Google Scholar yielded 6130 potential papers. Starting from the first page of the results, we read through the title and abstract and also verified whether the WBCD and ML classification were the focus of the papers by going through the first 11 papers. From the 11 papers, five were excluded. From these five, three papers were excluded because the WBCD was not the focus of the paper; rather, a different Wisconsin BC dataset formed the basis of the research. The remaining two papers were already included in Yue et al.’s19 work. Therefore, six papers were included in this study: three for 2016 and another three for 2017.36-41
The 2018 search produced 5650 papers. Three sample papers were briefly read to verify selection. Two papers were excluded; one of the papers was based on unsupervised ML and the other was based on a different Wisconsin BC dataset. We included one of the papers from this search. In addition, the WBCD was also part of the focus of Li and Chen’s30 paper from the search for objective 2 above, and was automatically included here. This resulted in the inclusion of two papers for 2018.30,42 The 2019 search yield 2900 papers. We went through a sample of seven papers. From these seven, five were excluded because they were based on a different Wisconsin BC dataset. The 2019 selection therefore included two papers.34,43
Study characteristics
For objective 1
In order to determine the global trend of publications in terms of country, the PubMed database was searched to determine the number of publications that the 195 countries contributed towards. The top ten countries are reported in Figure 2. The top ten first authors and journals in the field of BC prediction using ML are shown in Figures 3 and 4. The VOSviewer software identified two clusters (the red and green cluster) for collaboration amongst the nine institutions as seen in Figure 5. This means that research collaborations occurred between any two institutions belonging to the same cluster. The institutions depicted per cluster in Figure 5 are listed in Supplementary Table 4. The VOSviewer software found 14 clusters (depicted by the different colours) for co-occurrence of the 123 author keywords shown in Figure 6. Co-occurrence of the keywords exists between any two keywords within the same cluster. The keywords per cluster from Figure 6 are listed in Supplementary Table 5.
Figure 1.
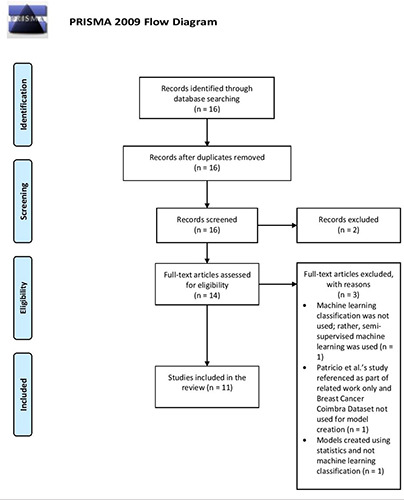
PRISMA 2009 flow diagram used for the screening and selection of breast cancer (BC) prediction studies focused on the use of machine learning and BC blood analysis data (the BC Coimbra Dataset [BCCD]). (http://prisma-statement.org/PRISMAStatement/FlowDiagram).
Figure 2.
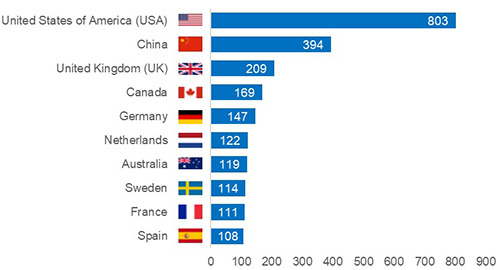
Top ten publishing countries for breast cancer prediction using machine learning publications, 2015-2019.
Figure 3.
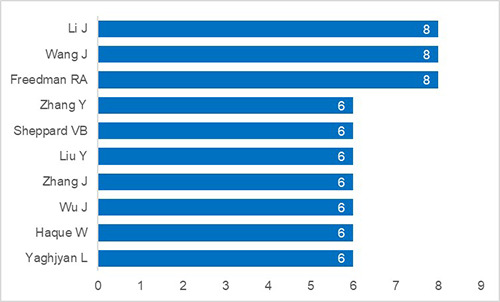
Top ten first authors for publications focused on breast cancer prediction using machine learning from 2015 to 2019.
For objectives 2 and 3
The accuracy summary measure was most often used (n = 15) by authors to report model results from the 19 distinct studies (Table 1). The top three studies with the highest model accuracy for the BCCD were: Hernández-Julio et al.34 (accuracy = 95.90%), Singh26 (accuracy = 92.11%) and Polat and Senturk27 (accuracy = 91.37%). The following studies achieved highest accuracy for the WBCD: Abdar and Makarenkov43 (accuracy = 100%), Elgedawy41 (accuracy = 99.42 %) and Hernández-Julio et al.34 (accuracy = 99.40%).
The AUC was the second most commonly used summary measure. Patrício et al.’s20 study had the best ranking AUC ([87, 91] 95% confidence interval) for the BCCD and the study by Bazazeh and Shubair37 had the highest AUC (99.90%) for the WBCD. Finally, only Hung et al.’s25 study reported the F1 score (82%) which was for the BCCD.
Discussion
Summary of evidence
For objective 1
Analysis by country
In total, 86 of the 195 countries were represented across the five-year analysis, with the top ten publishing countries depicted in Figure 2. The United States of America (USA) produced the most publications (n = 803), which amounts to roughly 27% of the 2928 total global publications produced during this period. China ranked second with 394 publications (approximately 13% of the 2928 publications). These top two country rankings in our study are unsurprising because a similar trend is noted in their Research and Development (R&D) expenditure. The USA invests the most ($476,452.0M in Purchasing Power Parity Dollars [PPP$]; 71.5% spent by the business sector) on R&D.44 China ranks second in R&D investment ($370,605.5M in PPP$; 77.3% spent by the business sector).44 In addition, nine of the top ten countries (all besides Sweden) are ranked in the top 15 R&D spenders.44 Specifically, strong spending from the business sector is a key factor in the success of R&D amongst these top countries.44
Among the top five publishing countries shown in Figure 2, only one (China) was a BRICS member country. BRICS is the association of five (Brazil, Russia, India, China and South Africa) emerging economies. China’s good performance is consistent with the finding from a previous study that found BC to be one of the priority diseases and popular research topics in China in recent years.45 This may be attributed to the Chinese healthcare reforms within the healthcare field which started in the 1980s and the country having gone through three reform periods.46 For more on Chinese healthcare reform, refer to Yip et al.47 and Chen.48
With the exception of China, the remaining nine of the top ten countries were developed countries. This is despite BC being a global burden.6 However, this finding is expected because developing countries spend comparatively less money on R&D due to limited resources.44
Analysis by first author
Approximately 2419 distinct first authors contributed towards the 2928 papers published within this five-year analysis. In addition, roughly 99% of all first authors produced five or less papers. The top ten first authors are shown in Figure 3.
Analysis by journal
The 2928 publications in the study period were published in 670 journals. From these 670 journals, the majority of the publications were primarily from specialty journals focused on cancer or BC, as seen in Figure 4. From the top ten, only PLoS One (ranked second) is a general journal. Breast Cancer Research and Treatment was the journal with the highest number of publications (n = 173; 6%), with an impact factor of 3.471. All top ten journals are peer reviewed and their average impact factor is 3.337.
Figure 4.
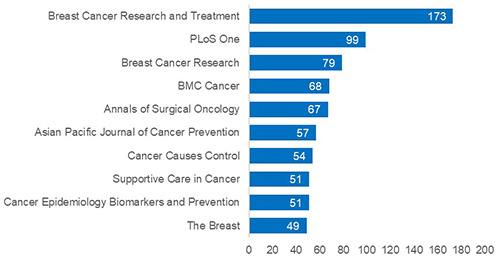
Top ten journals that breast cancer prediction using machine learning publications were most commonly published in during the period of 2015-2019.
Figure 5.
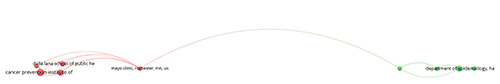
Institutional collaboration network of breast cancer prediction using machine learning-related publications, 2015-2019. The size of the nodes indicates the number of collaborative publications. The higher the number of collaborative publications, the larger the size of the node and vice versa. The distance between two nodes is inversely proportional to the number of collaborations between two institutions. This implies that shorter distances indicate more collaboration between the institutions. There are two clusters: the red and green clusters.
Analysis of institutional collaborations
The institutional collaborations network is shown in Figure 5 and listed in Supplementary Table 4. Research collaborations occurred between any two institutions within the same cluster. The Cancer Prevention Institute of California from the USA, the Memorial Sloan Kettering Cancer Centre from the USA and the Department of Epidemiology, Harvard T.H. Chan School of Public Health from the USA were the top three influential institutions in this study period. From the nine institutions, seven (77%) were from the USA. Internationally, the USA collaborates only with Canada and Germany. These three countries are also amongst the top five publishing countries (Figure 2). This shows that research in this field is lacking in developing countries since there was no developing country represented in the top ten publication countries (Figure 2). In addition, no developing country was listed in collaborative research with institutions from the developed countries (Supplementary Table 4). This finding is consistent with a previous finding, which noted that the history of general research collaborations between developed and developing countries is not illustrious. 49 In the future, regulations should be put into place to encourage international collaborations between developed and developing countries. This will allow for sharing of valuable expertise and resources with developing countries, which will also consequently increase the latter’s research output. Finally, China’s good performance could steer collaboration with the other BRICS members.
Figure 6.
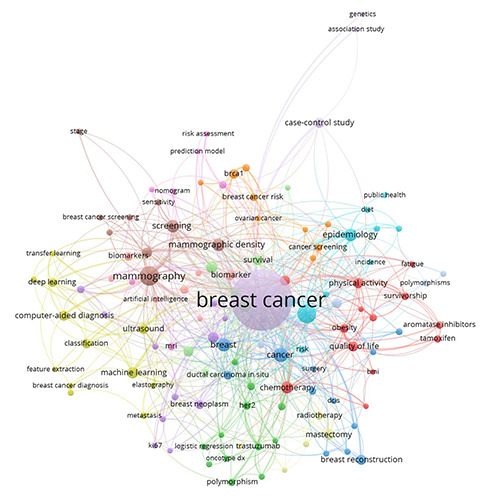
Author keywords co-occurrence network of breast cancer prediction using machine learning-related publications from 2015 to 2019. The size of the nodes depicts the frequency of the keywords, so, the larger the node, the higher the frequency and vice versa. The distance between two nodes is inversely proportional to the number of co-occurrence between the keywords. This means that shorter distances indicate greater co-occurrence between the keywords. There are 14 clusters, each represented by the 14 different colours in the figure.
Analysis of co-occurrence of author keywords
The author keyword analysis is shown in Figure 6 and listed in Supplementary Table 5. The analysis shows that the top ten most prominent topics in this field are: mammography, screening, epidemiology, prognosis, mammographic density, chemotherapy, Machine Learning, neoadjuvant chemotherapy, magnetic resonance imaging and risk factors. Broadly, this shows that authors are most interested in BC screening and detection methods and understanding the underlying determinants of the BC disease using the ML paradigm. We also manually identified ML-related keywords shown in bold in Supplementary Table 5. Most of the MLrelated keywords are confined in Cluster 4, indicating that these keywords appear frequently together. As expected, and generally known in the medical field, classification appears to be the most frequent ML-related paradigm used in the studies. In addition, Neural Networks, Deep Learning, Support Vector Machine and Logistic Regression (Cluster 2) are the common ML algorithms used in this field.
For objective 2
It is noteworthy to mention that the top two studies in terms of accuracy for BCCD, as seen in Table 1, adopted some form of feature selection for their ML models. This means that instead of using all the BCCD features, the authors first used some form of ML-related technique to identify the most important BCCD features and used this subset of features to build their models. Feature selection is important because it assists with improved ML model performance.50
Hernández-Julio et al.34 proposed a novel framework based on clusters and pivot tables using the MATLAB software. As shown in Table 1, these authors achieved the highest accuracy (95.90%) with the 10-fold Cross-Validation (CV) sampling strategy. This was achieved with the model they created using their framework and the following BCCD features: BMI, Glucose, Leptin, Resistin and MCP-1. Singh’s26 K-Nearest Neighbors (K-NN) model attained second position with an accuracy of 92.11% where 67% of the BCCD was used for training and 33% of the data was used for testing the model. In contrast to Hernández-Julio et al.’s34 finding, Singh26 identified and used a different subset of features from the BCCD (Glucose, Resistin and Age) to build the model. Similar to Hernández-Julio et al.,34 Singh26 also used MATLAB for modelbuilding. It is unclear whether Polat and Senturk27 used feature selection. Nevertheless, the authors obtained a hybrid Adaptive Boosting (AdaBoost) model together with 10-fold CV that achieved 91.37% accuracy.
These two different subsets of BCCD features found in the two studies above may have important real-world implications as they could potentially identify new and cheaper BC biomarkers. However, clinical validations would be required as complementary analyses. To accomplish this, the results from the studies need to be presented to clinicians; however, it is unfortunate that this step appears to be lacking in these studies.
In contrast to the findings from objective 1 above, it is interesting to note that the first author (Singh26), ranked in the top three BCCD studies for the accuracy measure (Table 1), was from a different BRICS country (India). However, this is consistent with the finding that India has research potential since the country appears in the top 15 R&D spenders (rank = 7th).44 India spends approximately $48,063.0M in PPP$ with 35.5% of their business sector contributing towards R&D.44
For objective 3
Abdar and Makarenkov’s43 ensemble model achieved the highest accuracy (100%) using the WBCD, as shown in Table 1. The WBCD was split into 50% for training and 50% for testing and the 16 missing rows were first removed. Although this model appears to have obtained excellent results, this may be unreliable since no CV approach was used to handle any bias in this small dataset. Elgedawy’s41 Random Forest (RF) model ranked second in accuracy (99.42%) for the WBCD. The data allocation was 75% for training and 25% for testing. This model used a subset of the WBCD features (Cell Size, Cell Shape, Clump Thickness and Bare Nuclei) which was first identified by the authors. As with Abdar’s and Makarenkov’s43 study, Elgedawy41 should have used some form of CV to handle the bias in the dataset. In contrast to Elgedawy,41 Hernández-Julio et al.34 identified the following important WBCD features: Uniformity of Cell Size, Marginal Adhesion, Single Epithelial Cell Size, Bare Nuclei and Normal Nucleoli. Using these features, Hernández-Julio et al.’s34 model ranked in third position with an accuracy of 99.40% by 10-fold CV which was created with the MATLAB software. The important features found in the two studies could potentially be BC biomarkers. However, similar to the findings in objective 2, none of these studies seemed to have any clinical validations. Finally, it is unsurprising that the authors (Abdar and Makarenkov43) with the highest WBCD accuracy was from Canada since Canada was also found to appear in the top ten publishing countries in the results for objective 1.
Comparison of breast cancer prediction results amongst the traditional breast cancer screening and or detection methods and the machine learning-based results from objectives 2 and 3
The different BC screening and detection methods that are used globally, have varied accuracy levels. The traditional BC screening method of BSE in developing countries has an estimated accuracy of between 20% and 30%.51 The CBE method is also commonly used to screen patients for BC in developing countries and this method has roughly 54% accuracy.52 In developed countries, the mammography approach used for screening BC in patients, achieves an estimated 89.3% accuracy.53 The triple assessment test that is currently used worldwide for BC detection, is known to provide an accuracy of approximately 99%.5 In contrast to the aforementioned methods, as seen in Table 1, in the best case scenario, the ML-based method was able to achieve 100% accuracy in the prediction of BC. This depicts the usefulness of the ML-based approach and shows that ML has potential in identifying BC in patients, to a degree where it could exceed the accuracy of the traditional approaches used for the same purpose.
Table 1.
Summary list of studies focused on BC prediction using ML classification with the BCCD and the WBCD. The contents of this table are ordered first by dataset, and then by summary measure, from highest to lowest. Boldface denotes the highest result per dataset and summary measure.
| Reference | Dataset | Country* | Sampling strategy | ML Algorithm | Summary measure (in %) |
|---|---|---|---|---|---|
| Hernández-Julio et al.34 | BCCD | Colombia | 10-fold CV | clusters + pivot table | 95.90 (Accuracy) |
| Singh26 | BCCD | India | 67-33 training-testing | K-NN | 92.11 (Accuracy) |
| Polat and Senturk27 | BCCD | Turkey | 10-fold CV | AdaBoost | 91.37 (Accuracy) |
| Akben28 | BCCD | Turkey | 10-fold CV | DT | 90.52 (Accuracy) |
| Islam and Poly35 | BCCD | Taiwan (China) | 10-fold CV | K-NN | 86.00 (Accuracy) |
| Araújo et al.33 | BCCD | Brazil | 70-30 training-testing 10-fold CV | NN | 80.67 (Accuracy) |
| Aslan et al.31 | BCCD | Turkey | 80-20 training-testing | ELM | 80.00 (Accuracy) |
| Livieris32 | BCCD | Greece | 10-fold CV | K-NN | 62.00 (Accuracy) |
| Patrício et al.20 | BCCD | Portugal | MCCV | SVM | 87.00, 91.00] (95% CI for AUC) |
| Li and Chen30 | BCCD | United Kingdom | 70-30 training-testing | RF | 78.50 (AUC) |
| Hung et al.25 | BCCD | Vietnam | 80-20 training-testing | DT | 82.00 (F1 score) |
| Abdar and Makarenkov43 | WBCD | Canada | 50-50 training-testing | CWV-BANN-SVM (an ensemble of ANN + SVM) | 100.00 (Accuracy) |
| Elgedawy41 | WBCD | Saudi Arabia | 75-25 training-testing | RF | 99.42 (Accuracy) |
| Hernández-Julio et al.34 | WBCD | Colombia | 10-fold CV | Clusters + pivot table | 99.40 (Accuracy) |
| Chaurasia et al.42 | WBCD | India | Stratified 10-fold CV | NB | 97.36 (Accuracy) |
| Asri et al.36 | WBCD | Morocco | 10-fold CV | SVM | 97.13 (Accuracy) |
| Alzubaidi et al.38 | WBCD | United Kingdom | LOOCV | SVM (quadratic-linear kernel) K-NN (Minkowsky and Euclidean distance measures) | 97.00 (Accuracy) 97.00 (Accuracy) |
| Islam et al.40 | WBCD | Bangladesh | 10-fold CV | SVM | 97.00 (Accuracy) |
| Chaurasia and Pal39 | WBCD | India | 10-fold CV | SMO (SVM) | 96.20 (Accuracy) |
| Bazazeh and Shubair37 | WBCD | United Arab Emirates | 10-fold CV | RF | 99.90 (AUC) |
| Li and Chen30 | WBCD | United Kingdom | 70-30 training-testing | RF | 98.90 (AUC) |
*Country is based on the first author’s affiliation. BC, breast cancer; ML, machine learning; WBCD, Wisconsin breast cancer dataset; BCCD, Breast Cancer Coimbra dataset; CV, cross-validation; SVM, support vector machine; RF, random forest; AUC, area under the receiver operating characteristics curve; LOOCV, leave-one-out cross-validation; K-NN, K-nearest neighbors; SMO, sequential minimal optimization; NB, naïve Bayes; MCCV, Monte Carlo cross validation; CI, confidence interval; AdaBoost, adaptive boosting; ELM, extreme learning machine; DT, decision tree; NN, Neural Network; CWV-BANN-SVM, confidence-weighted voting-boosting artificial neural network-support vector machine.
Limitations and future directions
For objective 1
The use of only PubMed as a source for retrieving publication data was a limitation. In future, researchers could work on a bibliometric study focused on BC prediction using ML by searching PubMed, Scopus and Web of Science online databases. Secondly, the five-year restriction in the search was a limitation. In the future, researchers could broaden this to a ten-year analysis. Thirdly, since some papers may not have assigned author keywords, some of the topics may be underrepresented in this study. Further analysis could include both author and Medical Subject Headings (MeSH) keywords.
For objective 2
The inclusion criteria were restricted to studies focused on ML classification only for the BCCD. In the future, reviews should include other ML paradigms used with the BCCD, such as semisupervised ML. In addition, any BCCD papers using ML published after this study could form the inclusion in future reviews.
For objective 3
The small sample size (n = 3 for 2016 and 2017; n = 2 for 2018 and 2019) was the main limitation for the WBCD papers, since the objective of this study was to only provide a brief overview of the WBCD. In future, this sample size could increase and also cover newly published papers showing good performance for the WBCD. Only ML classification studies were included in the present study. In future, researchers could expand this to also include WBCD studies focused on other ML approaches such as unsupervised ML.
Finally, we were not able to include papers that were not written in English and this may therefore have introduced a language bias. In the future, researchers could hire an interpreter to aid with interpretation of non-English papers and include these into future reviews.
Conclusions
A bibliometric analysis of BC prediction using ML publications was carried out for the past five years by searching PubMed. The USA was the most influential country, with the highest number of publications, and 2419 distinct first authors contributed towards the 2928 papers found in this period. Breast Cancer Research and Treatment was the highest ranked journal, with an impact factor of 3.471. Institutional collaborations appear to mainly occur within the USA. The Cancer Prevention Institute of California from the USA had the highest number of collaborative publications. No developing country was listed in both the top ten publishing countries and institutional collaborations. The most researched topics in this field are the utilization of ML for BC screening, detection and understanding the determinants of the disease. This paper reviewed studies published on using a blood analysis dataset, the BCCD, with ML for BC prediction. The top two authors used some form of feature selection in their ML models. Body Mass Index, Glucose, Leptin, Resistin and MCP-1 were found to be the best BCCD features in one study. Another study found Glucose, Resistin and Age to be the most optimal BCCD features. These two sets of blood tests may potentially identify new BC biomarkers; however, none of the authors presented their results to clinicians to perform clinical validations.
This paper also provided a brief overview of studies published on BC prediction using a FNAC biopsy WBCD dataset and ML. Although the highest ranked author achieved 100% model performance, these results were unreliable due to no approach being used to handle any bias in the dataset. Two of the top three ranked studies used feature selection in their models. One study found Cell Size, Cell Shape, Clump Thickness and Bare Nuclei to be the best WBCD features. Another study identified Uniformity of Cell Size, Marginal Adhesion, Single Epithelial Cell Size, Bare Nuclei and Normal Nucleoli as the most optimal WBCD features. However, similar to the BCCD finding, these results were not shown to clinicians to validate whether these may potentially be BC biomarkers.
Funding Statement
Funding: This study was funded by ZS.
References
- 1.Tinoco G, Warsch S, Glück S, et al. Treating breast cancer in the 21st century: emerging biological therapies. J Cance. 2013;4:117. [DOI] [PMC free article] [PubMed] [Google Scholar]
- 2.Sun Y-S, Zhao Z, Yang Z-N, et al. Risk factors and preventions of breast cancer. Int J Biol Sci 2017;13:1387-97. [DOI] [PMC free article] [PubMed] [Google Scholar]
- 3.Sankaranarayanan R. Screening for cancer in low- and middleincome countries. Ann Glob Health 2014;80:412-7. [DOI] [PubMed] [Google Scholar]
- 4.Ebell HM, Thai NT, Royalty JK. Cancer screening recommendations: an international comparison of high income countries. Public Health Rev 2018;39:7. [DOI] [PMC free article] [PubMed] [Google Scholar]
- 5.Nigam M, Nigam B. Triple assessment of breast – Gold standard in mass screening for breast cancer diagnosis. IOSR J Dental Med Sci 2013;7:1-7. [Google Scholar]
- 6.Global Burden of Disease Cancer Collaboration. Global, regional, and national cancer incidence, mortality, years of life lost, years lived with disability, and disability-adjusted lifeyears for 29 cancer groups, 1990 to 2016. JAMA Oncol 2018;4:1553-68. [DOI] [PMC free article] [PubMed] [Google Scholar]
- 7.Bagley SC, White H, Golomb BA. Logistic regression in the medical literature: Standards for use and reporting, with particular attention to one medical domain. J Clin Epidemiol 2001;54:979-85. [DOI] [PubMed] [Google Scholar]
- 8.Gareen IF, Gatsonis C. Primer on multiple regression models for diagnostic imaging research. Radiology 2003;229:305-10. [DOI] [PubMed] [Google Scholar]
- 9.Concato J, Feinstein AR, Holford TR. The risk of determining risk with multivariable models. Ann Intern Med 1993;118:201-10. [DOI] [PubMed] [Google Scholar]
- 10.Géron A. Hands-on machine learning with Scikit-Learn & TensorFlow. California: O'Reilly Media; 2017. [Google Scholar]
- 11.Singularity University. The exponential guide to artificial intelligence. Accessed September 2019. Available from: https://su.org/resources/exponential-guides/the-exponentialguide-to-artificial-intelligence/ [Google Scholar]
- 12.Burkov A. The hundred-page machine learning book. Canada: Andriy Burkov; 2019. [Google Scholar]
- 13.Glynn RW, Chin JZ, Kerin MJ, Sweeney KJ. Representation of cancer in the medical literature-a bibliometric analysis. PLoS One 2010;5:e13902. [DOI] [PMC free article] [PubMed] [Google Scholar]
- 14.Nafade V, Nash M, Huddart S, et al. A bibliometric analysis of tuberculosis research, 2007–2016. PloS One 2018;13:e0199706. [DOI] [PMC free article] [PubMed] [Google Scholar]
- 15.Soteriades ES, Falagas ME. A bibliometric analysis in the fields of preventive medicine, occupational and environmental medicine, epidemiology, and public health. BMC Public Health 2006;6:301. [DOI] [PMC free article] [PubMed] [Google Scholar]
- 16.Badenhorst A, Mansoori P, Chan KY. Assessing global, regional, national and sub–national capacity for public health research: a bibliometric analysis of the Web of Science(TM) in 1996–2010. J Glob Health 2016;6:010504. [DOI] [PMC free article] [PubMed] [Google Scholar]
- 17.Wolberg WH, Mangasarian OL. Breast Cancer Wisconsin (Original) Data Set. 1992. Accessed September 2019. Available from: https://archive.ics.uci.edu/ml/datasets/Breast+Cancer+Wisconsin+%28Original%29. [Google Scholar]
- 18.Wolberg WH, Mangasarian OL. Multisurface method of pattern separation for medical diagnosis applied to breast cytology. P Natl Acad Sci 1990;87:9193-6. [DOI] [PMC free article] [PubMed] [Google Scholar]
- 19.Yue W, Wang Z, Chen H, Payne A, Liu X. Machine learning with applications in breast cancer diagnosis and prognosis. Designs 2018;2:13. [Google Scholar]
- 20.Patrício M, Pereira J, Crisóstomo J, et al. Using resistin, glucose, age and BMI to predict the presence of breast cancer. BMC Cancer 2018;18:29. [DOI] [PMC free article] [PubMed] [Google Scholar]
- 21.Moher D, Liberati A, Tetzlaff J, Altman DG. Preferred reporting items for systematic reviews and meta-analyses: the PRISMA statement. Ann Intern Med 2009;151:264-9. [DOI] [PubMed] [Google Scholar]
- 22.Elsevier. Scopus database. Accessed November 2019. Available from: https://www.scopus.com/ [Google Scholar]
- 23.Clarivate Analytics. Web of Science database. Accessed November 2019. Available from: https://www.webofknowledge.com/ [Google Scholar]
- 24.Van Eck N, Waltman L. Software survey: VOSviewer, a computer program for bibliometric mapping. Scientometrics 2009;84:523-38. [DOI] [PMC free article] [PubMed] [Google Scholar]
- 25.Hung PD, Hanh TD, Diep VT. Breast cancer prediction using Spark MLlib and ML packages. Proceedings 5th Int Conf on Bioinformatics Research and Applications (ICBRA 2018), Hong Kong. [Google Scholar]
- 26.Singh BK. Determining relevant biomarkers for prediction of breast cancer using anthropometric and clinical features: A comparative investigation in machine learning paradigm. Biocybernet Biomed Engin 2019;39:393-409. [Google Scholar]
- 27.Polat K, Senturk U. A novel ML approach to prediction of breast cancer: Combining of mad normalization, KMC based feature weighting and AdaBoostM1 classifier. Proceedings 2nd Int Symp on Multidisciplinary Studies and Innovative Technologies (ISMSIT), 2018, Ankara, Turkey. [Google Scholar]
- 28.Akben SB. Determination of the blood, hormone and obesity value ranges that indicate the breast cancer, using data mining based expert system. IRBM 2019;40:355-60. [Google Scholar]
- 29.Nithya R, Santhi B. A data mining techniques for diagnosis of breast cancer disease. World Appl Sci J 2014;29:18-23. [Google Scholar]
- 30.Li Y, Chen Z. Performance evaluation of machine learning methods for breast cancer prediction. Appl Comput Math 2018;7:212-6. [Google Scholar]
- 31.Aslan MF, Celik Y, Sabanci K, Durdu A. Breast cancer diagnosis by different machine learning methods using blood analysis data. Int J Intell Syst Appl Engin 2018;6:289-93. [Google Scholar]
- 32.Livieris IE. Improving the classification efficiency of an ANN utilizing a new training methodology. Informatics 2018;6:1. [Google Scholar]
- 33.Araújo VJS, Guimarães AJ, Souza PVdC, et al. Using resistin, glucose, age and BMI and pruning fuzzy neural network for the construction of expert systems in the prediction of breast cancer. Mach Learn Knowl Extr 2019;1:466-82. [Google Scholar]
- 34.Hernández-Julio YF, Prieto-Guevara MJ, Nieto-Bernal W, et al. Framework for the development of data-driven Mamdanitype Fuzzy clinical decision support systems. Diagnostics (Basel) 2019;9:52. [DOI] [PMC free article] [PubMed] [Google Scholar]
- 35.Islam MM, Poly TN. Machine learning models of breast cancer risk prediction. BioRxiv 2019:723304. [Google Scholar]
- 36.Asri H, Mousannif H, Moatassime HA, Noel T. Using machine learning algorithms for breast cancer risk prediction and diagnosis. Proceedings 6th Int Symp on Frontiers in Ambient and Mobile Systems (FAMS); 2016. [Google Scholar]
- 37.Bazazeh D, Shubair R. Comparative study of machine learning algorithms for breast cancer detection and diagnosis. Proceedings IEEE 5th Int Conf on Electronic Devices, Systems, and Applications (ICEDSA), 2016. American University of Ras Al Khaimah, United Arab Emirates. [Google Scholar]
- 38.Alzubaidi A, Cosma G, Brown D, Pockley AG. Breast cancer diagnosis using a hybrid genetic algorithm for feature selection based on mutual information. Proceedings Inte Conf on Interactive Technologies and Games (ITAG), 2016; Nottingham, UK. [Google Scholar]
- 39.Chaurasia V, Pal S. A novel approach for breast cancer detection using data mining techniques. Intl J Innov Res Comp Commun Engin 2014;2. [Google Scholar]
- 40.Islam M, Iqbal H, Haque R, Hasan K. Prediction of breast cancer using support vector machine and K-nearest neighbors. Proceedings IEEE Region 10 Humanitarian Technology Conf (R10-HTC), 2017. Dhaka, Bangladesh. [Google Scholar]
- 41.Elgedawy MN. Prediction of breast cancer using random forest, support vector machines and naïve Bayes. Int J Engin Comp Sci 2017;6:19884-9. [Google Scholar]
- 42.Chaurasia V, Pal S, Tiwari BB. Prediction of benign and malignant breast cancer using data mining techniques. J Algorithm Comput Technol 2018;12:119-26. [Google Scholar]
- 43.Abdar M, Makarenkov V. CWV-BANN-SVM ensemble learning classifier for an accurate diagnosis of breast cancer. Measurement 2019;146:557-70. [Google Scholar]
- 44.UNESCO Institute for Statistics. How much does your country invest in R&D? Accessed November 2019. Available from: http://uis.unesco.org/apps/visualisations/research-and-development-spending/. [Google Scholar]
- 45.Chen K, Yao Q, Sun J, et al. International publication trends and collaboration performance of China in healthcare science and services research. Isr J Health Policy Res 2016;5:1. [DOI] [PMC free article] [PubMed] [Google Scholar]
- 46.Li L, Jiang Y, Chen Q. A review of China’s health care reform after the reform and open policy in 1978. Chin Health Econ 2008;27:5-9. [Google Scholar]
- 47.Yip WC-M, Hsiao WC, Chen W, et al. Early appraisal of China's huge and complex health-care reforms. Lancet 2012;379:833-42. [DOI] [PubMed] [Google Scholar]
- 48.Chen Z. Launch of the health-care reform plan in China. Lancet 2009;373:1322-4. [DOI] [PubMed] [Google Scholar]
- 49.National Academy of Sciences National Academy of Engineering Institute of Medicine. Culture matters: International research collaboration in a changing world: summary of a workshop. Washington, DC: National Academies Press; 2014 [PubMed] [Google Scholar]
- 50.Guyon I, Elisseeff A. An Introduction to variable and feature selection. J Machine Learn Res 2003;3:1157-82. [Google Scholar]
- 51.da Costa Vieira RA, Biller G, Uemura G, et al. Breast cancer screening in developing countries. Clinics 2017;72:244-53. [DOI] [PMC free article] [PubMed] [Google Scholar]
- 52.Barton MB, Harris R, Fletcher SW. Does this patient have breast cancer?: The screening clinical breast examination: should it be done? How? JAMA 1999;282:1270-80. [DOI] [PubMed] [Google Scholar]
- 53.Zeeshan M, Salam B, Khalid QSB, et al. Diagnostic accuracy of digital mammography in the detection of breast cancer. Cureus 2018;10:e2448. [DOI] [PMC free article] [PubMed] [Google Scholar]