

Abstract
Introduction. Aerodigestive squamous cell carcinomas (ASCC) constitute a major source of global cancer deaths. Patients typically present with advanced, incurable disease, so new means of detecting early disease are a research priority. Metabolite quantitation is amenable to point-of-care analysis and can be performed in ASCC surrogates such as breath and saliva. The purpose of this systematic review is to summarise progress of ASCC metabolomic studies, with an emphasis on the critical appraisal of methodological quality and reporting.
Method
A systematic online literature search was performed to identify studies reporting metabolic biomarkers of ASCC. This review was conducted in accordance with the recommendations of the Cochrane Library and MOOSE guidelines.
Results
Thirty studies comprising 2117 patients were included in the review. All publications represented phase-I biomarker discovery studies, and none validated their findings in an independent cohort. There was heterogeneity in study design and methodological and reporting quality. Sensitivities and specificities were higher in oesophageal and head and neck squamous cell carcinomas compared to those in lung squamous cell carcinoma. The metabolic phenotypes of these cancers were similar, as was the kinetics of metabolite groups when comparing blood, tissue, and breath/saliva concentrations. Deregulation of amino acid metabolism was the most frequently reported theme.
Conclusion
Metabolite analysis has shown promising diagnostic performance, especially for oesophageal and head and neck ASCC subtypes, which are phenotypically similar. However, shortcomings in study design have led to inconsistencies between studies. To support future studies and ultimately clinical adoption, these limitations are discussed.
1. Introduction
Squamous cell carcinomas of the aerodigestive tract (ASCC) constitute a major health burden globally, with an estimated 4.3 million new cases and 2.6 million deaths annually [1]. Poor survival that is associated with ASCC reflects their often delayed presentation to medical professionals, such that many patients are not suitable for curative therapy [2–5]. Whilst the ability to diagnose ASCC at an early stage is associated with improved long-term survival, current strategies have inadequate diagnostic performance and are not recommended in national guidelines. There remains an unmet clinical need to develop reliable noninvasive and cost-effective methods for the early detection of ASCC.
ASCC arise from nonkeratinising stratified squamous epithelium lining the upper digestive tract (lips to lower oesophagus) and respiratory tract. This convenient location renders ASCC suitable for noninvasive testing using breath and saliva. The use of proteomics and genomics has historically been at the forefront of diagnostic studies. However, these techniques provide monothematic information and are less suited to point-of-care technologies needed for large-scale application [6]. Metabolites may be more appealing as they are amenable to noninvasive sampling and translatable to point-of-care analytical tools [7]. For example, in upper gastrointestinal adenocarcinoma (the other major ASCC subtype), exhaled metabolites have demonstrated promise for detecting treatable disease stages [8–10]. However, progress in this field has been hampered by inadequate standardisation, inconsistent quality assurance, and evolving analytical technology [11–14].
The purpose of this systematic review is to summarise progress of ASCC metabolomic studies. The specific objectives are (i) to assess methodological quality, (ii) to summarise the discriminatory performance of the proposed metabolic biomarkers, and (iii) to describe emerging metabolic themes for these cancers.
2. Materials and Methods
2.1. Literature Search
This review set out to identify all studies that measured differences in metabolites between patients with ASCC and relevant controls. A systematic literature search was conducted in accordance with the recommendations of the Cochrane Library and MOOSE guidelines [15]. The following databases were searched: Medline (1946–present) via OvidSP, Ovid Embase (1947–18th January 2019), and Cochrane Library. Three strings using the following search terms were used: biomarkers; metabonomics; metabolic profiling; volatile organic compounds; magnetic resonance spectroscopy; mass spectrometry; and squamous cell carcinoma. All variations in spelling including a truncated search term using wild card characters and “related articles” function were used in combination with the Boolean operators AND OR. Full details of the search strategy were provided as a supplementary file. The reference lists of identified articles were also searched to identify other potentially relevant studies.
Two independent reviewers (YMG, PB) screened the titles and abstracts of all studies identified by the primary electronic search. The full texts of potentially relevant articles were retrieved to assess eligibility for inclusion. Included studies were those where metabolomic techniques to identify biomarkers of ASCC were performed in treatment-naïve human subjects. Studies were excluded if they reported on mixed cancer subtypes where results for ASCC could not be separately determined. Studies that did not report named biomarkers of ASCC, animal and in vitro studies, studies not published in the English language, and review articles and conference abstracts were also excluded. A third reviewer (SA) was consulted in the case of a disagreement.
2.2. Definitions
Metabolomics is defined as “the global and unbiased definition of the complement of small molecules in biofluids, tissues, organs, or organisms” [16]. Biomarkers were defined as a naturally occurring molecule, which were significantly different in a disease state. ASCC included tumours affecting squamous mucosa of the oral cavity, oropharynx, lung, and oesophagus.
2.3. Outcome Measures
The following data items were extracted from included publications: year of publication, country of origin, study design, recruitment time, total number of participants, tumour of origin, biomarker phase, tumour stage, analytical platform used, sample type, number of compounds identified, compounds noted to be increased/decreased in cancer, statistical analysis performed, prediction model used, sensitivity and specificity, and area under the receiver operating characteristic (ROC) curve derived from diagnostic models.
2.4. Statistical Analysis
Statistical analysis was performed using R (version 3.2.1, The R Project for Statistical Computing, http://www.r-project.org). Using the sensitivity, specificity, and area under the ROC curves derived from individual published models, bivariate meta-analyses were performed to create pooled point estimates of the hierarchal summary ROC curve of VOC analysis in accordance with previously validated methods [17].
2.5. Metabolite Analysis
All metabolites identified were classed in accordance to the Kyoto Encyclopedia of Genes and Genomes (KEGG) pathway, and statistical analysis was performed using the pathway analysis module in MetaboAnalyst version 4.0. Metabolites determined to be significantly increased or decreased in each study were selected. Data preprocessing included name check against the Human Metabolome Database (HMDB), data checks, and missing values. Parameters used to analyse this data were the hypergeometric test for overrepresentation analysis and the relative-betweenness centrality test for pathway topology analysis based on the KEGG pathway library [18–20]. Normalisation was performed using the weighted means of identified metabolite that were increased/decreased in squamous cell carcinoma (SCC) in each sample type. The mean proportion of each compound identified was analysed as the proportion of the total number of compounds identified per metabolite class per study, divided by the total number of compounds identified in total in each SCC site subtype, multiplied by the total number of studies; this compound was identified in Figure 1.
Figure 1.
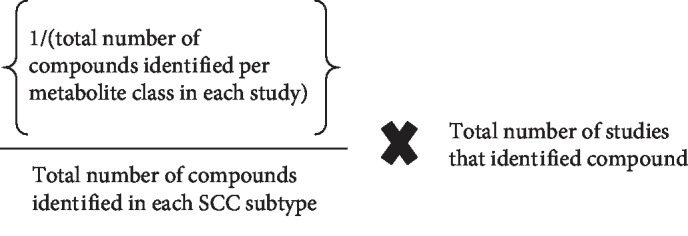
Equation for weighted means of each identified metabolite. Key: SCC: squamous cell carcinoma.
2.6. Quality Assessment
Study quality was assessed with three tools: first, Quality Assessment of Diagnostic Accuracy Studies-2 (QUADAS-2) checklist [21] to assess methodological bias. Second, the Standards for Reporting of Diagnostic Accuracy Studies (STARD) checklist [22, 23] was used to assess general reporting quality of a clinical diagnostic tool. Third, the Chemical Analysis Working Group- (CAWG-) Metabolomics Standard Initiative (MSI) criteria was used as this focused on the reporting quality of metadata of metabolomic studies [14]. The CAWG-MSI Metabolite Identification Levels were used to summarise studies' identification rigour: level 1 (most confident, at least two orthogonal analytical data types, e.g., retention time, isotope labelling), level 2 (one data type, spectral similarity to commercial library), level 3 (one data type related to a spectral or chemical property).
3. Results
A systematic literature search identified a total of 30 studies comprising of a total of 2117 subjects of which 1144 had a diagnosis of ASCC (Figure 2). Details of included studies were provided in Table 1. All studies were Phase I biomarker discovery studies. Of the 30 included studies, 18 were from Asia and the Far East [8, 9, 11–26], seven from Europe [27–33], three from North America [34–36], and two from the Middle East [37, 38]. ASCC tumour sites identified were the head and neck (n = 17), oesophageal (n = 8), and lung (n = 5). The majority of studies compared patients with cancer to normal controls and or benign conditions [16, 25, 26, 28, 29, 34, 38–43].
Figure 2.

PRISMA chart.
Table 1.
Study characteristics, statistical analysis, and prediction model performed.
| Author | Country | Sample type | SCC stage | Targeted/untargeted method | Analytical platform | Statistical analysis/prediction model | STARD score | QUADAS | CAWG-MSI metabolite ID level | CAWG-MSI score | Sn (%) | Sp (%) | AUC | |
|---|---|---|---|---|---|---|---|---|---|---|---|---|---|---|
| Risk of bias | Applicability | |||||||||||||
| Studies of oesophageal squamous cell carcinoma | ||||||||||||||
| Liu 2013 | China | Plasma | Late: 17 Control: 53 |
Untargeted | UPLC-ESI-TOF-MS | PCA, hierarchical cluster analysis | 37 | Low | Low | 2 | 13 | — | — | — |
| Wang L 2013 | China | Tissue | Early: 28 Late: 71 Control: 30 |
Untargeted | 1H-NMR | OPLS-DA | 35 | Low | High | 2 | 7 | — | — | — |
| Jin 2014 | China | Plasma | Early: 49 Late: 31 Control: 30 |
Untargeted | GC-MS | Model of 3 compounds based on OPLS-DA model | 33 | Low | Low | 2 | 16 | 90 | 96.67 | 0.964 |
| Ma 2014 | China | Plasma | Early: 51 Control: 60 |
Targeted | HPLC | Student t-test, PLS-DA | 32 | Low | Low | 2 | 10 | — | — | — |
| Wang J 2016 | China | Plasma | Early: 28 Late: 30 Control: 105 |
Untargeted | UHPLC-QTOF/MS | Model of 16 compounds based on random forest model | 37 | Low | Low | 1 | 19 | 85 | 90.5 | 0.929 |
| Xu 2016 | China | Urine | Late: 40 Control: 62 |
Untargeted | LC-MS/MS | Model of 7 compounds based on binary logistic regression and ROC curve | 25 | Unclear | Low | 2 | 19 | 90.2 | 96.0 | 0.961 |
| Cheng 2017 | China | Plasma | Patient: 40 Control: 27 |
Targeted | LC-MS/MS | Model of 4 compounds based on fivefold cross-validation test | 32 | Low | Low | 2 | 15 | 77.5 | 85.33 | 0.798 |
| Zhang 2017 | China | Plasma | Early: 17 Late: 23 Control: 40 |
Untargeted | 1H-NMR, UHPLC | Model of 9 compounds based on binary logistic regression and ROC curves | 33 | Low | Low | 2 | 14 | 97.4 | 95 | 0.988 |
|
| ||||||||||||||
| Studies of lung squamous cell carcinoma | ||||||||||||||
| Song 2010 | China | Breath | Early: 20 Late: 33 Control: 41 |
Untargeted | SPME GC-MS | Wilcoxon rank sum test, ROC | 29 | Low | Low | 2 | 11 | — | — | — |
| De Castro 2014 | Spain | Plasma | Patient: 30 Control: 35 |
Targeted | GC-MS | Model of 1 compound based on ROC curves | 30 | Unclear | Low | 1 | 13 | 77 | 66 | 0.7 |
| Handa 2014 | Germany | Breath | Early: 19 late: 31 Normal: 39 |
Untargeted | IMS | Model of 11 compounds based on decision tree algorithm | 27 | Unclear | Low | 3 | 6 | 97.4 | 60 | — |
| Rocha 2015 | Portugal | Tissue | Patient: 19 Control: 37 |
Untargeted | 1H-NMR | PLS-DA, Wilcoxon rank sum test | 25 | Unclear | Low | 2 | 7 | — | — | — |
| Sanchez-Rodriguez 2015 | Spain | Plasma | Late: 18 Control: 50 |
Targeted | GC-MS | Model of 1 compound based on ROC curves | 31 | Low | Low | 1 | 17 | 69 | 68 | 0.68 |
|
| ||||||||||||||
| Studies of head and neck squamous cell carcinoma | ||||||||||||||
| Mizukawa 1998 | Japan | Saliva | Patient: 18 Control: 18 |
Targeted | HPLC | Nil–peak detection only | 21 | Low | High | 1 | 7 | — | — | — |
| Somashekar 2011 | USA | Tissue | Patient: 22 Control: 22 |
Untargeted | HR-magic angle spinning proton NMR spectroscopy | PCA | 23 | Low | Low | 1 | 8 | — | — | — |
| Wei 2011 | China | Saliva | Early: 21 Late: 16 Control: 66 |
Untargeted | UPLC-QTOF-MS | Model of 5 compounds based on ROC curves | 31 | Low | Low | 3 | 13 | 86.5 | 82.4 | 0.89 |
| Yonezawa 2013 | Japan | Tissue, plasma | Early: 7 Late: 10 Control: 22 |
Untargeted | GC-MS | Student's t-test, Bartlett's test, Wilcoxon rank sum test | 27 | Low | Low | 2 | 17 | — | — | — |
| Gruber 2014 | Israel | Breath | Early: 9 Late: 11 Control: 40 |
Untargeted | GC-MS, sensors | Model of 3 compounds based on discriminant factor analysis | 30 | Low | Low | 3 | 10 | 77 | 90 | 0.83 |
| Wang Q (Clinica Chimica Acta) 2014 | China | Saliva | Early: 13 Late: 17 Control: 0 |
Targeted | UPLC-MS | Model of 4 compounds based on ROC curves | 30 | Unclear | Low | 1 | 24 | 92.3 | 91.7 | — |
| Wang Q (Scientific Reports) 2014 | China | Saliva | Early: 13 Late: 17 Control: 30 |
Untargeted | RPLC-MS, HILIC-MS | Model of 5 compounds based on ROC curve | 24 | Unclear | Low | 1 | 16 | 100 | 96.7 | 0.997 |
| Wang Q (Talanta) 2014 | China | Saliva | Early: 13 Late: 17 Control: 60 |
Targeted | UPLC-ESI-MS | Model of 2 compounds based on logistic regression model | 25 | Low | Unclear | 1 | 25 | 92.3 | 91.7 | 0.871 |
| Gupta 2015 | India | Plasma | Early: 28 Late: 72 Control: 175 |
Untargeted | H-NMR | Model of 2 compounds based on OPLS-DA | 33 | Unclear | Low | 2 | 10 | 90 | 94 | 0.979 |
| Szabo 2015 | Hungary | Breath | Cancer: 14 Control: 11 |
Targeted | OralChroma and GC-MS | Nil–peak detection only | 22 | Unclear | Low | 1 | 8 | — | — | — |
| Kekatpure 2016 | India | Urine | Early: 14 Late: 64 Control: 94 |
Untargeted | LC-triple quadrupole-MS/MS | Kruskal-Wallis, Fisher exact test, Cox proportional hazards model | 23 | Low | High | 2 | 13 | — | — | — |
| Mukherjee 2016 | USA | Tissue, saliva | Early: 2 Late: 5 Control: 7 |
Untargeted | LC-MS, LC-MS/MS, GC-MS | Kruskal-Wallis with adjustment for multiple testing | 36 | Low | Low | 3 | 15 | — | — | — |
| Shoffel-Havakuk 2016 | Israel | Saliva | Cancer: 6 Control: 4 |
Untargeted | GC-MS | Mann–Whitney U, Fisher exact test | 24 | Low | Low | 2 | 11 | — | — | — |
| Bouza 2017 | Spain | Breath | Early: 11 Late: 15 Control: 26 |
Untargeted | SPME, GC-MS | Kruskal-Wallis, Mann–Whitney, PLS-DA, SIMCA prediction | 25 | Unclear | Low | 2 | 10 | — | — | — |
| Hartwig 2017 | Germany | Breath | Early: 5 Late: 5 Control: 4 |
Untargeted | GC-MS | Jackknife/leave-one-out cross-validation | 34 | Unclear | Low | 3 | 6 | — | — | — |
| Kamarajan 2017 | USA | Tissue, saliva, plasma | Early: 17 Late: 30 Control: 19 |
Untargeted | UPLC-MS/MS, GC-MS | Anova, t-test, random forest classification, PCA | 31 | Low | Low | 2 | 20 | — | — | — |
| Ohshima 2017 | Japan | Saliva | Early: 14 Late: 8 Control: 21 |
Untargeted | CE-TOF-MS | Hierarchical cluster analysis, Wilcoxon rank sum test | 37 | Low | Low | 3 | 9 | — | — | — |
Key: LC: liquid chromatography; GC: gas chromatography; UPLC: ultra-performance liquid chromatography; HPLC: high-performance liquid chromatography; QTOF: quad-time-of-flight; 1H-NMR: proton nuclear magnetic resonance; UHPLC: ultra-high performance liquid chromatography; IMS: ion mobility spectroscopy; ESI: electrospray ionisation; SPME: solid-phase microextraction; CE: capillary electrophoresis; RPLC: reverse-phase liquid chromatography; HILIC: hydrophilic interaction chromatography; MS: mass spectrometry; PCA: principal component analysis; PLS-DA: partial least squares discriminant analysis; MCCV: Monte Carlo cross-validation; OPLS-DA: orthogonal partial least squares discriminant analysis; ROC: receiver operating curve.
Liquid chromatography mass spectrometry (LC-MS) was the most commonly used analytical platform (n = 14) followed by gas chromatography mass spectrometry (GC-MS, n = 12). Sample types used in these studies were tissue (n = 10), saliva (n = 13), plasma (n = 13), urine (n = 5), and breath (n = 6). Several studies used more than one analytical platform [34, 35, 38, 40] and/or sample types for analysis [34, 35] (Table 1). Eight studies used targeted methods, and 22 studies untargeted methods. All studies that used untargeted methods covered a large range of commonly identified metabolites, ranging from small fatty acids to larger glycolipid and carbohydrate metabolites. Only five studies identified volatile compounds [26, 30, 36–38].
3.1. Quality
Assessment of bias and applicability of outcomes were analysed with QUADAS-2 (Table 1). The QUADAS-2 was divided into risk of bias of the following: patient selection, diagnostic test, reference standard, and patient flow and timing. Additionally, this test investigated applicability of patient selection, diagnostic test, and reference standard to the systematic review. There was an overall low risk of bias of these diagnostic tests and high applicability of these studies to the review question. In this QUADAS-2 analysis, the nature of patient flow and timing of sample analysis was least reported in studies in this review (n = 11) [16, 28–30, 33, 36, 39, 40, 44].
General reporting quality of a clinical diagnostic tool was assessed by the STARD checklist (Table 1). The STARD score for reported studies ranged from 21 to 37 with a mean of 29.4 (±4.76 S.D) where the maximum score is 41. More than 75% of studies reported inclusion and exclusion criteria, described the reference test and standards, and reported potential bias and analysis of diagnostic accuracy well. However, more than two thirds of studies failed to clearly demonstrate patient recruitment protocol, specifically, how patients were identified and recruited, the nature of recruitment, e.g., consecutive or random series and [22, 37, 40, 41, 45–47] sample size estimation [35, 42, 48], participant flow [24, 31, 35, 39, 49, 50], and adverse effects as a consequence of the diagnostic tool.
Reporting of clinical demographics was not consistent in each study. Of the 30 studies, only 10 fully reported all clinical demographics [28, 30, 34, 35, 38, 41, 43, 47, 49, 51], 13 reported at least patient age, gender, and clinical stage [16, 25, 26, 31, 36, 39, 40, 42, 45, 46, 48, 52, 53]. Seven studies did not report differences in metabolite profile at different tumour stages [24, 27, 29, 32, 36, 37, 46]. In these seven studies, four compared differences in metabolic profile between cancer and noncancer cohorts [24, 27, 32, 37].
Definitions of normal control differed most in tissue sample analysis, where Zhang et al. specified normal adjacent control tissue samples a minimum of 5 cm from the tumour site [54] in contrast to the other five tissue studies that used adjacent normal controls [26, 29, 45, 46, 53] without demonstrating adequacy of tissue clearance. Of all 30 studies in this review, only Shoffel-Havakuk et al. used patients with benign histology as controls [37]. No tissue study used normal samples from patients with no endoluminal pathology, which is pertinent as metabolic field effects exist in endolumens [55]. Various exclusion criteria were given to control donors' characteristics, including use of nonsteroidal anti-inflammatory drugs within the past week, antibiotic treatment and consumption of specific food, history of mucosal disorder, chronic and/or systemic disease such as diabetes, autoimmune disorders, heart disease, infection, and liver disease. Twenty-six studies involving biofluids or breath used healthy volunteer controls, one additionally used patients with benign diseases [24, 25, 27, 28, 30–43, 46–49, 51, 52, 56, 57]. The definition for healthy volunteers was based on history (six studies) or endoluminal study (18 studies).
Reporting of metadata in metabolomics datasets was assessed using CAWG-MSI [14] (Supplementary ). A summary of the minimum reported metadata is summarised in Table 1. Twenty of the 30 studies included in this systematic review used relative quantification of compounds [16, 24, 25, 28, 29, 31, 33–38, 40–43, 45, 48, 49, 52], whilst 10 included studies provided absolute quantification of compounds [27, 30, 32, 39, 46, 47, 51–53, 56]. Despite the availability of reporting guidelines for metabolomics analysis, only three studies reported greater than 50% of the CAWG-MSI criteria [34, 39, 52]. Overall, studies reported sample preparation, experimental analysis, and instrumental performance well. However, the majority (80%) did not provide method validation data [16, 24, 25, 27, 28, 30–38, 40–42, 45–49, 51, 52, 54, 56]. Thirteen studies that analysed relative quantification of metabolites identified used either internal standards or normalised the results to allow for instrument variation [16, 24, 25, 29, 33–36, 40–42, 45, 49]. Six of the 10 studies that used absolute quantification did not report accuracy or precision validation data for their method on the instrument [30, 44, 46, 47, 51, 56] whilst two of 10 studies reported the limits of quantification and detection of their method [39, 52]. Out of 30 studies, only 12 declared evidence of data preprocessing [25, 29, 33, 34, 36, 37, 40, 41, 43, 45, 48, 49]. Levels one, two, and three metabolite identification were reported in nine [25, 27, 30, 32, 36, 39, 40, 46, 52], 15 [16, 24, 26, 29, 33, 34, 37, 42, 43, 45, 47, 49, 51, 56, 58], and six [28, 31, 35, 38, 41, 48] studies, respectively. Only two of the 30 studies reported all of the statistical aspects suggested by the CAWG-MSI guidelines [59].
3.2. Discriminatory Features
The highest sensitivity of oesophageal squamous cell cancer (OSCC) diagnosis was reported by Zhang et al. at 97.4% with a specificity of 95% and AUC of 0.988 [44]. Jin et al. reported the highest specificity at 96.67% with a sensitivity of 90% and AUC of 0.964 [42]. The highest sensitivities and specificities of lung squamous cell cancer (LSCC) were poorer with Handa et al. reporting the highest sensitivity of 97.4% [28] and Sanchez-Rodriguez et al. reporting the highest specificity of 68% and AUC of 0.7 [30]. The highest sensitivity, specificity, and AUC were reported for head and neck squamous cell cancer (HNSCC): 100%, 96.7%, and 0.997, respectively (Table 1). However, no groups subsequently validated their initial findings in independent cohorts. Of the 6 studies which reported AUC > 0.90, a high risk of bias was not present and CAWG-MSI metabolite identification was level 1 or 2.
3.3. Metabolic Themes
A total of 181 metabolites identified were associated with an increase or decrease in concentration in patients with ASCC compared to their normal controls (Supplementary ). These compounds were identified in a range of sample types including tissue, plasma, urine, saliva, and breath. The majority were amino acids, carboxylic acids, or fatty acids, and these were more commonly identified in tissue, saliva, and plasma samples. The least common metabolites identified were vitamins, nitrogen, and sulphur containing compounds (Supplementary ). Sixty-eight compounds that changed in ASCC were reported in more than one study. These metabolites were selected based on metabolites that were identified to be increased or decreased in cancer in different studies. Of these, 27 compounds were noted to be involved in amino acid and lipid metabolism (Supplementary ). All biomarkers showed a consistent increase or decrease in the sample types across different studies (see Supplementary Tables and ).
A particularly deregulated pathway was branched chain amino acid metabolism (BCAAs, see Figures 3 and 4 and Supplementary ). There were 36 significant differences in BCAA concentrations, or their downstream metabolites, across 12 studies [25, 28, 34–36, 39–41, 43, 45, 46, 49]. The QUADAS-2 risk of bias was low for nine of these studies [34–36, 40, 41, 45–47, 49]. Five of these studies were of good quality and five of fair quality as assessed by the STARD checklist. One study reported the minimum metadata required from the CAWG-MSI checklist [39]. Of these 12 studies, two reported level 1 metabolite identification [35, 39], seven reported level 2 [25, 28, 36, 41, 43, 45, 60], and three reported level 3 metabolite identification [34, 40, 46].
Figure 3.

Proportion of identified compounds in each ASCC, LSCC, OSCC, and HNSCC in different sample types. Key: ASCC: aerodigestive squamous cell carcinoma; OSCC: oesophageal squamous cell carcinoma; LSCC: lung squamous cell carcinoma; HNSCC: head and neck squamous cell carcinoma; BCAA: branched chain amino acid.
Figure 4.

Metabolic pathways involved in all ASCC: (a) all metabolic pathways, (b) amino acid metabolism, (c) lipid metabolism, and (d) carbohydrate metabolism.
3.4. Influence of Anatomical Location on Metabolic Themes
LSCC (n = 9) had the lowest number of metabolite classes compared to OSCC (n = 20) or HNSCC (n = 18) (Figure 3). Common metabolites that were identified in all ASCC sites were amino acids, fatty acids, carbohydrate, nitrogen compounds, and organic acids. OSCC and HNSCC appear to demonstrate similar metabolic profiles compared to LSCC (see Figures 3 and 4). Metabolic pathways commonly deregulated in both OSCC and HNSCC mainly concerned amino acid mobilisation, uptake, and polymerisation; lipid synthesis; and alternative energy. All twelve studies demonstrating BCAA deregulation were either OSCC or HNSCC. These compounds were increased in tissue and saliva but decreased in cancer patients' plasma. Breakdown products of BCAA, alpha-ketoisocaproic acid (KIC), alpha-ketoisovaleric acid (KIV), and alpha-ketomethylvaleric acid (KMV) were reported in three metabolomic studies [35, 42, 48] related to OSCC and HNSCC. However, the design and reporting heterogeneity meant these site-specific results should be approached with caution, and further detailed analyses were not performed.
3.5. Influence of Biosample Type on Metabolic Themes
There was an overall positive deflection in the proportion of metabolites present in the tissue, saliva, urine, and breath of ASCC patients and a negative deflection in plasma (Figure 3). This was particularly evident for amino acids. Metabolites in ASCC saliva samples were more similar to tissue than plasma. In particular, increased BCAAs were identified in tissue and saliva of patients with ASCC. In contrast, plasma BCAAs were decreased in ASCC plasma and not identified in urine or breath. This trend was also noted in other amino acids. BCKAs were decreased in the plasma of ASCC patients, but the proportions of fatty acids increase and decrease were similar in tissue samples. However, the design and reporting heterogeneity meant these sample-specific results should be approached with caution, and further detailed analyses were not performed.
4. Discussion
This systematic review provides an overview of progress in ASCC metabolic biomarker studies. The principal findings of this review were (i) favourable diagnostic performance of metabolic biomarkers for the detection of OSCC and HNSCC but not LSCC in pooled analysis, (ii) shared metabolic features of OSCC and HNSCC, and (iii) suggestion of a consistent role of the KEGG amino acid metabolic pathway in ASCC. Additionally, comparing sample types suggests metabolites are often depleted in the circulation and enriched in both tumour tissue and luminal surrogates, suggesting a model for ASCC biomarker kinetics. From the design perspective, clinical methodology and reporting quality was of a reasonable standard, but analytical methodology and reporting quality were often of a poor standard, and no studies performed exceptionally in both aspects.
ASCCs all have high mortality due to late disease detection. Currently, there are no screening strategies for any subtype of sufficient accuracy and quality to support political endorsement. Pooled analysis of identified studies regarding the detection of ASCC gave an area under the curve (AUC) of 0.927 with sensitivity of 85.7% (95% CI 78.9–92%), respectively. This diagnostic performance compares favourably to existing screening programmes such as faecal occult blood testing for colorectal cancer and cytological cervical screening test that currently are associated with lower sensitivity and specificity [61, 62]. Although the studies were generally of an exploratory nature without extensive validation, these results are encouraging and suggest metabolic biomarkers of ASCC may provide novel screening tools to identify high-risk populations, provided these efforts can progress to high-quality validation studies with appropriate power. The finding that the six studies reporting the highest AUC values had good clinical design and used targeted metabolomic methods suggests methodological rigour and hypothesis-driven metabolomics generate the best results.
In both discriminatory performance and metabolic themes, HNSCC and OSCC clustered away from LSCC, suggesting the underlying biology of those cancers is better suited to metabolic biomarker studies. Both HNSCC and OSCC arise from normally resident squamous cells, whereas LSCC arise from metaplastic squamous cells, perhaps explaining LSCCs' relative metabolic heterogeneity. Moreover, genomic studies suggest LSCC to be distinct from HNSCC and OSCC [63–65]. Nonetheless, the relatively lower number of quantified metabolites for LSCC suggests this cancer warrants further study, perhaps using the similar analytical approaches from the best OSCC/HNSCC studies.
Despite using weighting to account for multiplicity from untargeted approaches, the heterogeneity in study design and quality, and the lack of independent validation, made comprehensive biological interpretation of the observed metabolic difference speculative. An exception to this was BCAA metabolism, which was a consistent theme in across the ASCC subtypes. There were 36 significant differences in BCAA concentrations or their downstream metabolites, across 12 studies [25, 26, 28, 34–36, 41–43, 46, 56, 66]. This was far more than any other metabolite group. Increased BCAAs were observed in ASCC tissue samples from four studies [26, 36, 45, 53], and decreased BCAA levels in cancer-blood samples were observed in two studies [42, 56]. These differences were often stark. This suggests uptake of BCAAs into ASCCs against the concentration gradient. BCAAs constitute 35-40% of human protein and are thus essential amino acids necessary for protein synthesis in rapidly dividing cells [67]. They also have additional proproliferative effects. For example, leucine potently activates the mammalian target of rapamycin complex 1 [60, 68–70] and BCAA deamination is a major source of glutamine for alternative energy [68, 71]. Thus, BCAA metabolism is emerging as critical mediators of transformation and treatment escape in a number of malignancies including other squamous cancers [72, 73] and the present finding of consistent BCAA reprogramming in ASCC warrants further targeted study.
Metabolomic biomarker analytics has evolved considerably in the last 15 years, and that progress is reflected in the design heterogeneity of the included studies. Critical appraisal of analytical design using CAWG-MSI generally revealed a low standard. In contrast, only six of the studies included in this review demonstrated poor STARD/QUADAS-2 scores (score of less than 25), indicating a reasonable quality of clinical design and reporting (Supplementary ). A key issue with metabolomic studies is the compromise between metabolomic coverage and unambiguous compound identification. Several studies used untargeted methodologies [16, 25, 26, 28, 29, 31, 33–38, 40–43, 45, 47–49, 51, 53] or more than one platform [3, 8, 9, 12] to increase their metabolomic coverage, although none used ultra-high coverage techniques such as Fourier-transform ion cyclotron resonance mass spectrometry (FT-ICR). No studies did not meet their objectives, or overstated their conclusions; however, this suggests that significant aspects of the ASCC metabolome have not been explored. Six studies that performed targeted methodology achieved level 1 identification of compounds of interest [27, 30, 32, 39, 46, 52], and two further studies used only commercially available spectral libraries for confirmation of their compound of interest [24, 56].
Additionally, our critical review has highlighted the following recurrent shortcomings in the current ASCC metabolomic literature: (i) lack of a clear sample size calculation; (ii) poor description of patient recruitment and inadequate description of clinical metadata; (iii) poor description of method validation; (iv) inconsistent quality assurance, especially replicate analysis; (v) biomarker performance frequently reported as multivariable models rather than clinical metrics; and (vi) lack of model validation data, either using internal cross-validation, or independent validation cohorts or studies. Using the CAWG-MSI checklist during study design would help to mitigate these issues [14].
A potential limitation was that more patients included in this review had late-stage disease (n = 548) rather than early-stage disease (n = 331), and that the case mix was usually just reported rather than subject to subgroup analysis. Typically, the clinical motivation for the work was early cancer detection, which seems at odds with test populations enriched for late-stage disease, without subgroup analysis. However, the majority of these studies were performed in tertiary centre settings, which meant that patients would typically have been on a curative pathway. Thus, the observed metabolic differences can detect treatable disease, which provides a platform for further studies powered to detect truly early disease. It should also be noted that more than half of the articles in this review were performed in China and Japan and may not be applicable to Western populations.
5. Conclusion
This review summarised progress in using metabolites to identify patients with ASCC. There was significant heterogeneity in methodology and quality; however, especially for OSCC and HNSCC, metabolites showed promise for minimally invasive diagnosis. These two ASCC subtypes had similar metabolic phenotypes, with deregulation of amino acid metabolism particularly pronounced. Comparative analysis of different sample types suggested a kinetics model for amino acids across the endolumen. To aid the development of future studies and ultimately clinical translation, the summarised recurrent methodological weaknesses must be addressed, especially with respect to analytical design.
Acknowledgments
This project is funded by the Medical Research Council, UK. The funding reference number is MR/S022112/1.
Conflicts of Interest
The authors declare that there is no conflict of interest regarding the publication of this paper.
Supplementary Materials
Supplementary Information Supplementary Figure 1: proportion of identified compound classes in different biosamples. Supplementary Table 1: summary of quality assessments. Supplementary Table 2: quality assessment of metabolic metadata based on CAWG-MSI guidelines. Supplementary Table 3: list of all metabolites, chemical class, and studies that identified them to be increased or decreased in biosamples. Supplementary Table 4: summary of significantly different metabolites listed in Supplementary .
References
- 1.Bray F., Ferlay J., Soerjomataram I., Siegel R. L., Torre L. A., Jemal A. Global cancer statistics 2018: GLOBOCAN estimates of incidence and mortality worldwide for 36 cancers in 185 countries. CA: A Cancer Journal for Clinicians. 2018;68(6):394–424. doi: 10.3322/caac.21492. [DOI] [PubMed] [Google Scholar]
- 2.Campion A. C. O. V., Ribeiro C. M. B., Luiz R. R., et al. Low survival rates of oral and oropharyngeal squamous cell carcinoma. International Journal of Dentistry. 2017;2017:7. doi: 10.1155/2017/5815493.5815493 [DOI] [PMC free article] [PubMed] [Google Scholar]
- 3.Siegel R. L., Miller K. D., Jemal A. Colorectal cancer mortality rates in adults aged 20 to 54 years in the United States, 1970-2014. JAMA. 2017;318(6):572–574. doi: 10.1001/jama.2017.7630. [DOI] [PMC free article] [PubMed] [Google Scholar]
- 4.Narod S. A., Iqbal J., Miller A. B. Why have breast cancer mortality rates declined? Journal of Cancer Policy. 2015;5:8–17. doi: 10.1016/j.jcpo.2015.03.002. [DOI] [Google Scholar]
- 5.Burton K. A., Ashack K. A., Khachemoune A. Cutaneous squamous cell carcinoma: a review of high-risk and metastatic disease. American Journal of Clinical Dermatology. 2016;17(5):491–508. doi: 10.1007/s40257-016-0207-3. [DOI] [PubMed] [Google Scholar]
- 6.Manzoni C., Kia D. A., Vandrovcova J., et al. Genome, transcriptome and proteome: the rise of omics data and their integration in biomedical sciences. Briefings in Bioinformatics. 2018;19(2):286–302. doi: 10.1093/bib/bbw114. [DOI] [PMC free article] [PubMed] [Google Scholar]
- 7.Zhang A., Sun H., Yan G., Wang P., Wang X. Metabolomics for biomarker discovery: moving to the clinic. BioMed Research International. 2015;2015:6. doi: 10.1155/2015/354671.354671 [DOI] [PMC free article] [PubMed] [Google Scholar]
- 8.Kumar S., Huang J., Abbassi-Ghadi N., Španěl P., Smith D., Hanna G. B. Selected ion flow tube mass spectrometry analysis of exhaled breath for volatile organic compound profiling of esophago-gastric cancer. Analytical Chemistry. 2013;85(12):6121–6128. doi: 10.1021/ac4010309. [DOI] [PubMed] [Google Scholar]
- 9.Markar S. R., Wiggins T., Antonowicz S., et al. Assessment of a noninvasive exhaled breath test for the diagnosis of oesophagogastric cancer. JAMA Oncology. 2018;4(7):970–976. doi: 10.1001/jamaoncol.2018.0991. [DOI] [PMC free article] [PubMed] [Google Scholar]
- 10.Haick H., Broza Y. Y., Mochalski P., Ruzsanyi V., Amann A. Assessment, origin, and implementation of breath volatile cancer markers. Chemical Society Reviews. 2014;43(5):1423–1449. doi: 10.1039/c3cs60329f. [DOI] [PMC free article] [PubMed] [Google Scholar]
- 11.Hanna G. B., Boshier P. R., Markar S. R., Romano A. Accuracy and methodologic challenges of volatile organic compound–based exhaled breath tests for cancer diagnosis: a systematic review and meta-analysis. JAMA Oncology. 2019;5(1, article e182815) doi: 10.1001/jamaoncol.2018.2815. [DOI] [PMC free article] [PubMed] [Google Scholar]
- 12.Masson P., Spagou K., Nicholson J. K., Want E. J. Technical and biological variation in UPLC-MS-based untargeted metabolic profiling of liver extracts: application in an experimental toxicity study on galactosamine. Analytical Chemistry. 2011;83(3):1116–1123. doi: 10.1021/ac103011b. [DOI] [PubMed] [Google Scholar]
- 13.Benton H. P., Want E. J., Ebbels T. M. D. Correction of mass calibration gaps in liquid chromatography-mass spectrometry metabolomics data. Bioinformatics. 2010;26(19):2488–2489. doi: 10.1093/bioinformatics/btq441. [DOI] [PubMed] [Google Scholar]
- 14.Sumner L. W., Amberg A., Barrett D., et al. Proposed minimum reporting standards for chemical analysis: chemical analysis working group (CAWG) metabolomics standards initiative (MSI) Metabolomics. 2007;3(3):211–221. doi: 10.1007/s11306-007-0082-2. [DOI] [PMC free article] [PubMed] [Google Scholar]
- 15.Stroup D. F., Berlin J. A., Morton S. C., et al. Meta-analysis of observational studies in epidemiology: a proposal for reporting. Meta-analysis Of Observational Studies in Epidemiology (MOOSE) group. Journal of the American Medical Association. 2000;283(15):2008–2012. doi: 10.1001/jama.283.15.2008. [DOI] [PubMed] [Google Scholar]
- 16.Xu J., Chen Y., Zhang R., et al. Global metabolomics reveals potential urinary biomarkers of esophageal squamous cell carcinoma for diagnosis and staging. Scientific Reports. 2016;6(1, article 35010) doi: 10.1038/srep35010. [DOI] [PMC free article] [PubMed] [Google Scholar]
- 17.Harbord R. M., Whiting P., Sterne J. A. C., et al. An empirical comparison of methods for meta-analysis of diagnostic accuracy showed hierarchical models are necessary. Journal of Clinical Epidemiology. 2008;61(11):1095–1103. doi: 10.1016/j.jclinepi.2007.09.013. [DOI] [PubMed] [Google Scholar]
- 18.Chong J., Xia J. MetaboAnalystR: an R package for flexible and reproducible analysis of metabolomics data. Bioinformatics. 2018;34(24):4313–4314. doi: 10.1093/bioinformatics/bty528. [DOI] [PMC free article] [PubMed] [Google Scholar]
- 19.Chong J., Yamamoto M., Xia J. MetaboAnalystR 2.0: from raw spectra to biological insights. Metabolites. 2019;9(3):p. 57. doi: 10.3390/metabo9030057. [DOI] [PMC free article] [PubMed] [Google Scholar]
- 20.Ma J., Shojaie A., Michailidis G. A comparative study of topology-based pathway enrichment analysis methods. BMC Bioinformatics. 2019;20(1, article 546) doi: 10.1186/s12859-019-3146-1. [DOI] [PMC free article] [PubMed] [Google Scholar]
- 21.Whiting P. F., Rutjes A. W. S., Westwood M. E., et al. Quadas-2: a revised tool for the quality assessment of diagnostic accuracy studies. Annals of Internal Medicine. 2011;155(8):529–536. doi: 10.7326/0003-4819-155-8-201110180-00009. [DOI] [PubMed] [Google Scholar]
- 22.Cohen J. F., Korevaar D. A., Altman D. G., et al. STARD 2015 guidelines for reporting diagnostic accuracy studies: explanation and elaboration. BMJ Open. 2016;6(11, article e012799) doi: 10.1136/bmjopen-2016-012799. [DOI] [PMC free article] [PubMed] [Google Scholar]
- 23.Bossuyt P. M., Reitsma J. B., Bruns D. E., et al. STARD 2015: an updated list of essential items for reporting diagnostic accuracy studies. BMJ. 2015;351, article h5527 doi: 10.1136/bmj.h5527. [DOI] [PMC free article] [PubMed] [Google Scholar]
- 24.Cheng J., Zheng G., Jin H., Gao X. Towards tyrosine metabolism in esophageal squamous cell carcinoma. Combinatorial Chemistry & High Throughput Screening. 2017;20(2):133–139. doi: 10.2174/1386207319666161220115409. [DOI] [PubMed] [Google Scholar]
- 25.Wang J., Zhang T., Shen X., et al. Serum metabolomics for early diagnosis of esophageal squamous cell carcinoma by UHPLC-QTOF/MS. Metabolomics. 2016;12(7):p. 116. doi: 10.1007/s11306-016-1050-5. [DOI] [Google Scholar]
- 26.Wang L., Chen J., Chen L., et al. 1H-NMR based metabonomic profiling of human esophageal cancer tissue. Molecular Cancer. 2013;12(1):p. 25. doi: 10.1186/1476-4598-12-25. [DOI] [PMC free article] [PubMed] [Google Scholar]
- 27.De Castro J., Rodríguez M. C., Martínez-Zorzano V. S., Sánchez-Rodríguez P., Sánchez-Yagüe J. Erythrocyte fatty acids as potential biomarkers in the diagnosis of advanced lung adenocarcinoma, lung squamous cell carcinoma, and small cell lung cancer. American Journal of Clinical Pathology. 2014;142(1):111–120. doi: 10.1309/AJCP1QUQQLLT8BLI. [DOI] [PubMed] [Google Scholar]
- 28.Handa H., Usuba A., Maddula S., Baumbach J. I., Mineshita M., Miyazawa T. Exhaled breath analysis for lung cancer detection using ion mobility spectrometry. PLoS One. 2014;9(12, article e114555) doi: 10.1371/journal.pone.0114555. [DOI] [PMC free article] [PubMed] [Google Scholar]
- 29.Rocha C. M., Barros A. S., Goodfellow B. J., et al. NMR metabolomics of human lung tumours reveals distinct metabolic signatures for adenocarcinoma and squamous cell carcinoma. Carcinogenesis. 2015;36(1):68–75. doi: 10.1093/carcin/bgu226. [DOI] [PubMed] [Google Scholar]
- 30.Sánchez-Rodríguez P., Rodríguez M. C., Sánchez-Yagüe J. Identification of potential erythrocyte phospholipid fatty acid biomarkers of advanced lung adenocarcinoma, squamous cell lung carcinoma, and small cell lung cancer. Tumor Biology. 2015;36(7):5687–5698. doi: 10.1007/s13277-015-3243-3. [DOI] [PubMed] [Google Scholar]
- 31.Hartwig S., Raguse J. D., Pfitzner D., Preissner R., Paris S., Preissner S. Volatile organic compounds in the breath of oral squamous cell carcinoma patients: a pilot study. Otolaryngology–Head and Neck Surgery. 2017;157(6):981–987. doi: 10.1177/0194599817711411. [DOI] [PubMed] [Google Scholar]
- 32.Szabó A., Tarnai Z., Berkovits C., et al. Volatile sulphur compound measurement with OralChroma™: a methodological improvement. Journal of Breath Research. 2015;9(1, article 016001) doi: 10.1088/1752-7155/9/1/016001. [DOI] [PubMed] [Google Scholar]
- 33.Bouza M., Gonzalez-Soto J., Pereiro R., de Vicente J. C., Sanz-Medel A. Exhaled breath and oral cavity VOCs as potential biomarkers in oral cancer patients. Journal of Breath Research. 2017;11(1, article 016015) doi: 10.1088/1752-7163/aa5e76. [DOI] [PubMed] [Google Scholar]
- 34.Kamarajan P., Rajendiran T. M., Kinchen J., Bermúdez M., Danciu T., Kapila Y. L. Head and neck squamous cell carcinoma metabolism draws on glutaminolysis, and stemness is specifically regulated by glutaminolysis via aldehyde dehydrogenase. Journal of Proteome Research. 2017;16(3):1315–1326. doi: 10.1021/acs.jproteome.6b00936. [DOI] [PMC free article] [PubMed] [Google Scholar]
- 35.Mukherjee P. K., Funchain P., Retuerto M., et al. Metabolomic analysis identifies differentially produced oral metabolites, including the oncometabolite 2-hydroxyglutarate, in patients with head and neck squamous cell carcinoma. BBA Clinical. 2017;7:8–15. doi: 10.1016/j.bbacli.2016.12.001. [DOI] [PMC free article] [PubMed] [Google Scholar]
- 36.Somashekar B. S., Kamarajan P., Danciu T., et al. Magic angle spinning NMR-based metabolic profiling of head and neck squamous cell carcinoma tissues. Journal of Proteome Research. 2011;10(11):5232–5241. doi: 10.1021/pr200800w. [DOI] [PMC free article] [PubMed] [Google Scholar]
- 37.Shoffel-Havakuk H., Frumin I., Lahav Y., Haviv L., Sobel N., Halperin D. Increased number of volatile organic compounds over malignant glottic lesions. The Laryngoscope. 2016;126(7):1606–1611. doi: 10.1002/lary.25733. [DOI] [PubMed] [Google Scholar]
- 38.Gruber M., Tisch U., Jeries R., et al. Analysis of exhaled breath for diagnosing head and neck squamous cell carcinoma: a feasibility study. British Journal of Cancer. 2014;111(4):790–798. doi: 10.1038/bjc.2014.361. [DOI] [PMC free article] [PubMed] [Google Scholar]
- 39.Wang Q., Gao P., Wang X., Duan Y. Investigation and identification of potential biomarkers in human saliva for the early diagnosis of oral squamous cell carcinoma. Clinica Chimica Acta. 2014;427:79–85. doi: 10.1016/j.cca.2013.10.004. [DOI] [PubMed] [Google Scholar]
- 40.Wang Q., Gao P., Wang X., Duan Y. The early diagnosis and monitoring of squamous cell carcinoma via saliva metabolomics. Scientific Reports. 2015;4(1, article 6802) doi: 10.1038/srep06802. [DOI] [PMC free article] [PubMed] [Google Scholar]
- 41.Wei J., Xie G., Zhou Z., et al. Salivary metabolite signatures of oral cancer and leukoplakia. International Journal of Cancer. 2011;129(9):2207–2217. doi: 10.1002/ijc.25881. [DOI] [PubMed] [Google Scholar]
- 42.Jin H., Qiao F., Chen L., Lu C., Xu L., Gao X. Serum metabolomic signatures of lymph node metastasis of esophageal squamous cell carcinoma. Journal of Proteome Research. 2014;13(9):4091–4103. doi: 10.1021/pr500483z. [DOI] [PubMed] [Google Scholar]
- 43.Gupta A., Gupta S., Mahdi A. A. 1H NMR-derived serum metabolomics of leukoplakia and squamous cell carcinoma. Clinica Chimica Acta. 2015;441:47–55. doi: 10.1016/j.cca.2014.12.003. [DOI] [PubMed] [Google Scholar]
- 44.Zhang H., Wang L., Hou Z., et al. Metabolomic profiling reveals potential biomarkers in esophageal cancer progression using liquid chromatography-mass spectrometry platform. Biochemical and Biophysical Research Communications. 2017;491(1):119–125. doi: 10.1016/j.bbrc.2017.07.060. [DOI] [PubMed] [Google Scholar]
- 45.Yonezawa K., Nishiumi S., Kitamoto-Matsuda J., et al. Serum and tissue metabolomics of head and neck cancer. Cancer Genomics Proteomics. 2013;10(5):233–238. [PubMed] [Google Scholar]
- 46.Mizukawa N., Sugiyama K., Fukunaga J., et al. Defensin-1, a peptide detected in the saliva of oral squamous cell carcinoma patients. Anticancer Research. 1998;18(6B):4645–4649. [PubMed] [Google Scholar]
- 47.Kekatpure V. D., Bs N., Wang H., et al. Elevated levels of urinary PGE-M are found in tobacco users and indicate a poor prognosis for oral squamous cell carcinoma patients. Cancer Prevention Research. 2016;9(6):428–436. doi: 10.1158/1940-6207.CAPR-15-0412. [DOI] [PubMed] [Google Scholar]
- 48.Ohshima M., Sugahara K., Kasahara K., Katakura A. Metabolomic analysis of the saliva of Japanese patients with oral squamous cell carcinoma. Oncology Reports. 2017;37(5):2727–2734. doi: 10.3892/or.2017.5561. [DOI] [PubMed] [Google Scholar]
- 49.Liu R., Peng Y., Li X., et al. Identification of plasma metabolomic profiling for diagnosis of esophageal squamous-cell carcinoma using an UPLC/TOF/MS platform. International Journal of Molecular Sciences. 2013;14(5):8899–8911. doi: 10.3390/ijms14058899. [DOI] [PMC free article] [PubMed] [Google Scholar]
- 50.Jia K., Li W., Wang F., et al. Novel circulating peptide biomarkers for esophageal squamous cell carcinoma revealed by a magnetic bead-based MALDI-TOFMS assay. Oncotarget. 2016;7(17):23569–23580. doi: 10.18632/oncotarget.8123. [DOI] [PMC free article] [PubMed] [Google Scholar]
- 51.Song G., Qin T., Liu H., et al. Quantitative breath analysis of volatile organic compounds of lung cancer patients. Lung Cancer. 2010;67(2):227–231. doi: 10.1016/j.lungcan.2009.03.029. [DOI] [PubMed] [Google Scholar]
- 52.Wang Q., Gao P., Cheng F., Wang X., Duan Y. Measurement of salivary metabolite biomarkers for early monitoring of oral cancer with ultra performance liquid chromatography-mass spectrometry. Talanta. 2014;119:299–305. doi: 10.1016/j.talanta.2013.11.008. [DOI] [PubMed] [Google Scholar]
- 53.Zhang X., Xu L., Shen J., et al. Metabolic signatures of esophageal cancer: NMR-based metabolomics and UHPLC- based focused metabolomics of blood serum. Biochimica et Biophysica Acta (BBA) - Molecular Basis of Disease. 2013;1832(8):1207–1216. doi: 10.1016/j.bbadis.2013.03.009. [DOI] [PubMed] [Google Scholar]
- 54.Zhang L., Jiang J., Arellano M., et al. Quantification of serum proteins of metastatic oral cancer patients using LC-MS/MS and iTRAQ labeling. The Open Proteomics Journal. 2008;1(1):72–78. doi: 10.2174/1875039700801010072. [DOI] [PMC free article] [PubMed] [Google Scholar]
- 55.Yakoub D., Keun H. C., Goldin R., Hanna G. B. Metabolic profiling detects field effects in nondysplastic tissue from esophageal cancer patients. Cancer Research. 2010;70(22):9129–9136. doi: 10.1158/0008-5472.CAN-10-1566. [DOI] [PubMed] [Google Scholar]
- 56.Ma H., Hasim A., Mamtimin B., Kong B., Zhang H. P., Sheyhidin I. Plasma free amino acid profiling of esophageal cancer using high-performance liquid chromatography spectroscopy. World Journal of Gastroenterology. 2014;20(26):8653–8659. doi: 10.3748/wjg.v20.i26.8653. [DOI] [PMC free article] [PubMed] [Google Scholar]
- 57.Xu J., Chen Y., Zhang R., et al. Global and targeted metabolomics of esophageal squamous cell carcinoma discovers potential diagnostic and therapeutic biomarkers. Molecular & Cellular Proteomics. 2013;12(5):1306–1318. doi: 10.1074/mcp.M112.022830. [DOI] [PMC free article] [PubMed] [Google Scholar]
- 58.Zhang F., Zhang Y., Zhao W., et al. Metabolomics for biomarker discovery in the diagnosis, prognosis, survival and recurrence of colorectal cancer: a systematic review. Oncotarget. 2017;8(21):35460–35472. doi: 10.18632/oncotarget.16727. [DOI] [PMC free article] [PubMed] [Google Scholar]
- 59.Spicer R. A., Salek R., Steinbeck C. Compliance with minimum information guidelines in public metabolomics repositories. Scientific Data. 2017;4(1, article 170137) doi: 10.1038/sdata.2017.137. [DOI] [PMC free article] [PubMed] [Google Scholar]
- 60.Zhen H., Kitaura Y., Kadota Y., et al. mTORC1 is involved in the regulation of branched-chain amino acid catabolism in mouse heart. FEBS Open Bio. 2016;6(1):43–49. doi: 10.1002/2211-5463.12007. [DOI] [PMC free article] [PubMed] [Google Scholar]
- 61.Niv Y., Sperber A. D. Sensitivity, specificity, and predictive value of fecal occult blood testing (Hemoccult II) for colorectal neoplasia in symptomatic patients: a prospective study with total colonoscopy. The American Journal of Gastroenterology. 1995;90(11):1974–1977. [PubMed] [Google Scholar]
- 62.Cuzick J., Clavel C., Petry K. U., et al. Overview of the European and North American studies on HPV testing in primary cervical cancer screening. International Journal of Cancer. 2006;119(5):1095–1101. doi: 10.1002/ijc.21955. [DOI] [PubMed] [Google Scholar]
- 63.The Cancer Genome Atlas Research Network. Comprehensive genomic characterization of squamous cell lung cancers. Nature. 2012;489(7417):519–525. doi: 10.1038/nature11404. [DOI] [PMC free article] [PubMed] [Google Scholar]
- 64.The Cancer Genome Atlas Network. Comprehensive genomic characterization of head and neck squamous cell carcinomas. Nature. 2015;517(7536):576–582. doi: 10.1038/nature14129. [DOI] [PMC free article] [PubMed] [Google Scholar]
- 65.The Cancer Genome Atlas Research Network. Integrated genomic characterization of oesophageal carcinoma. Nature. 2017;541(7636):169–175. doi: 10.1038/nature20805. [DOI] [PMC free article] [PubMed] [Google Scholar]
- 66.Wang Q., Yu Q., Lin Q., Duan Y. Emerging salivary biomarkers by mass spectrometry. Clinica Chimica Acta. 2015;438:214–221. doi: 10.1016/j.cca.2014.08.037. [DOI] [PubMed] [Google Scholar]
- 67.Shimomura Y., Murakami T., Nakai N., Nagasaki M., Harris R. A. Exercise promotes BCAA catabolism: effects of BCAA supplementation on skeletal muscle during exercise. The Journal of Nutrition. 2004;134(6):1583S–1587S. doi: 10.1093/jn/134.6.1583S. [DOI] [PubMed] [Google Scholar]
- 68.Ananieva E. A., Wilkinson A. C. Branched-chain amino acid metabolism in cancer. Current Opinion in Clinical Nutrition and Metabolic Care. 2018;21(1):64–70. doi: 10.1097/MCO.0000000000000430. [DOI] [PMC free article] [PubMed] [Google Scholar]
- 69.Moberg M., Apró W., Ekblom B., Van Hall G., Holmberg H. C., Blomstrand E. Activation of mTORC1 by leucine is potentiated by branched-chain amino acids and even more so by essential amino acids following resistance exercise. American Journal of Physiology-Cell Physiology. 2016;310(11):C874–C884. doi: 10.1152/ajpcell.00374.2015. [DOI] [PubMed] [Google Scholar]
- 70.Dodd K. M., Tee A. R. Leucine and mTORC1: a complex relationship. American Journal of Physiology. Endocrinology and Metabolism. 2012;302(11):E1329–E1342. doi: 10.1152/ajpendo.00525.2011. [DOI] [PubMed] [Google Scholar]
- 71.Zhang S., Zeng X., Ren M., Mao X., Qiao S. Novel metabolic and physiological functions of branched chain amino acids: a review. Journal of Animal Science and Biotechnology. 2017;8(1):p. 10. doi: 10.1186/s40104-016-0139-z. [DOI] [PMC free article] [PubMed] [Google Scholar]
- 72.Lu H.-J., Hsieh C. C., Yeh C. C., et al. Clinical, pathophysiologic, and genomic analysis of the outcomes of primary head and neck malignancy after pulmonary metastasectomy. Scientific Reports. 2019;9(1, article 12913) doi: 10.1038/s41598-019-49212-y. [DOI] [PMC free article] [PubMed] [Google Scholar]
- 73.Wang Y., Zhang J., Ren S., et al. Branched-chain amino acid metabolic reprogramming orchestrates drug resistance to EGFR tyrosine kinase inhibitors. Cell Reports. 2019;28(2):512–525.e6. doi: 10.1016/j.celrep.2019.06.026. [DOI] [PubMed] [Google Scholar]
Associated Data
This section collects any data citations, data availability statements, or supplementary materials included in this article.
Supplementary Materials
Supplementary Information Supplementary Figure 1: proportion of identified compound classes in different biosamples. Supplementary Table 1: summary of quality assessments. Supplementary Table 2: quality assessment of metabolic metadata based on CAWG-MSI guidelines. Supplementary Table 3: list of all metabolites, chemical class, and studies that identified them to be increased or decreased in biosamples. Supplementary Table 4: summary of significantly different metabolites listed in Supplementary .