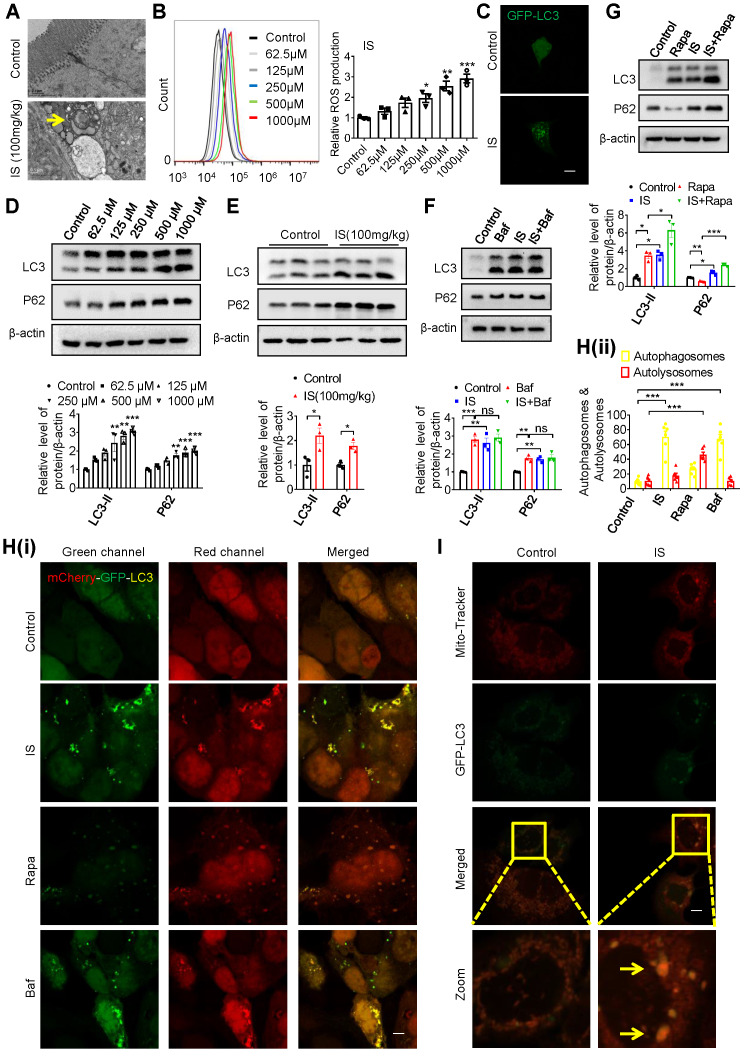
Figure 3.
IS induces intestinal damage via inhibiting mitophagic flux in Caco2 cells. (A) TEM observation of autophagic vacuoles (indicated by yellow arrow) in intestinal tissues from control and IS-injected mice. (B) ROS production of Caco2 cells treated with various concentrations of IS for 24 hours. (C) GFP-LC3 plasmids were transfected into Caco2 cells using Lipofectamine 2000. Cells were treated with control or IS for another 24 hours for confocal microscopy observation. (D) Western blot analysis of LC3 and P62 expression of cells in (B). (E) Western blot analysis of LC3 and P62 expression in intestinal tissues from control and IS-injected mice. (F, G) Western blot analysis of LC3 and P62 expression in Caco2 cells treated with control, Baf, IS or IS+Baf (F); control, Rapa, IS or IS+Rapa (G). (H) Caco2 cells were transfected with mCherry-GFP-LC3 adenovirus and treated with control, IS, Rapa or Baf for another 24 hours for confocal microscopy observation and ImageJ analysis. (I) Caco2 cells were transfected with GFP-LC3 plasmids, treated with control or IS for 24 hours and stained with mito-tracker for confocal microscopy. Yellow arrow indicates co-localization of mito-tracker and GFP-LC3 puncta. The gray scale of bands was quantified using ImageJ software. Scale bar, 10 μm. Data are shown as mean ± SEM and were analyzed by one-way ANOVA (B, D, F-H) or two-tailed unpaired Student's t test (E). n=3. ns: no significance. * P<0.05, ** P<0.01, *** P<0.001.

