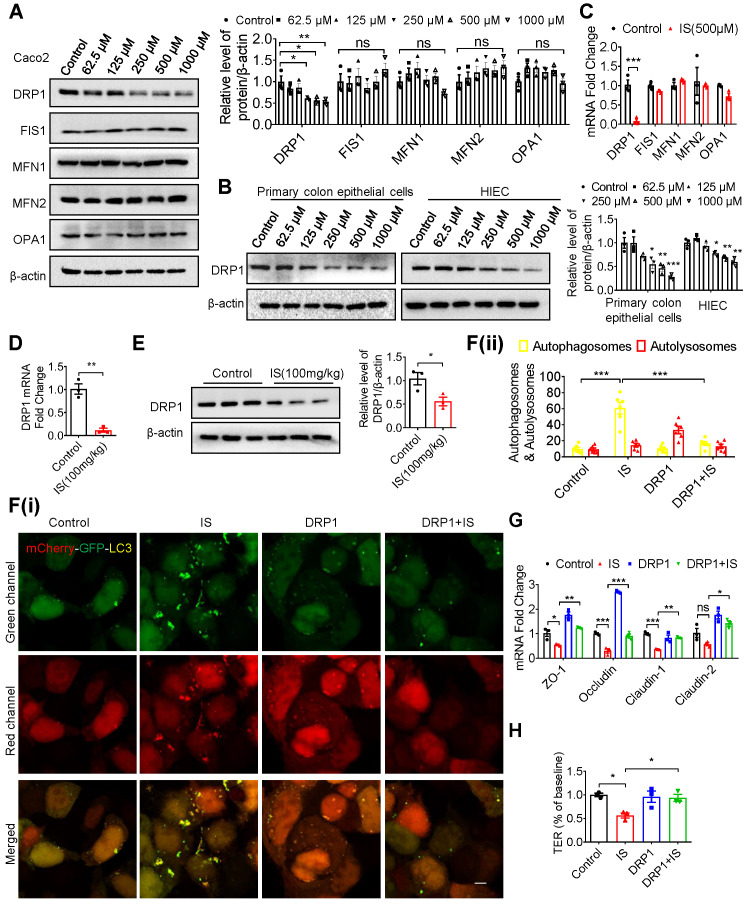
Figure 4.
IS inhibits mitophagy and intestinal function through suppressing DRP1. (A-C) Western blot and qPCR analysis of mitochondrial fission and fusion-related proteins in Caco2 (A, C), HIEC and primary colon epithelia cells (B) treated with control or IS for 24 hours. (D, E) qPCR (D) and Western blot (E) analysis of DRP1 expression in intestinal tissues from control or IS-injected mice. (F) Caco2 cells were transfected with mCherry-GFP-LC3 in combination with DRP1 overexpression plasmids or vector control, and then treated with control or IS for 24 hours for confocal microscopy and ImageJ analysis. Scale bar, 10 μm. (G) Caco2 cells were transfected with DRP1 overexpression plasmids or vector control and then treated with control or IS for 24 hours. The expressions of tight junction-related genes were detected using qPCR analysis. (H) Caco2 cells were seeded on Millicell Hanging Cell Culture Inserts in 24-well plates and cultured for 14 days, and then transfected with DRP1 overexpression plasmids or vector control and treated with control or IS for 24 hours for TER determination. The gray scale of bands was quantified using ImageJ software. Data are shown as mean ± SEM and were analyzed by one-way ANOVA (A, B, F-H) or two-tailed unpaired Student's t test (C-E). n=3. ns: no significance. * P<0.05, ** P<0.01, *** P<0.001.

