

Abstract

A two-stage pyrolysis fixed bed was used, and the vapor-modified pyrolysis coke was used as a carrier. A ZHPC catalyst was prepared by plasma calcination. Gas-phase tar produced by the pyrolysis of raw coal was subjected to in situ catalytic cracking to improve tar and gas yield. The effects of plasma calcination power, calcination time, and ZnO loading on in situ cracked products were studied. The prepared catalyst was characterized by X-ray electron spectroscopy, X-ray diffraction, Brunauer–Emmett–Teller, and scanning electron microscopy. The results showed that (1) compared with traditional catalysts, the catalyst prepared by plasma has better performance; (2) the optimal calcination time of the ZHPC catalyst is 5 min, calcination power is 60 W, and ZnO loading is 10%; (3) compared with raw coal pyrolysis, the optimal ZHPC catalyst on in situ catalytic cracking tar, gas yield increased by 66.16%; the cracking rate of tar increased by 54.46%, and the content of light components increased to 60.7%; (4) in situ catalytic cracking of tar with the optimal PC, the light tar has been greatly improved, in which the light oil, phenol oil, naphthalene oil, and wash oil have increased by 93.04, 126.31, 257.28, and 108.08%, respectively. The anthracene oil and asphalt have decreased by 26.98 and 58.71%; the tar cracking rate has increased.
1. Introduction
With the development of coal utilization technologies such as gasification, liquefaction, carbonization, and coking, a large number of coal tar or coal tar by-products have been produced, among which carbonization and liquefaction are the processes with coal tar as the main product.1,2 Although medium and low-temperature coal tars have higher contents of aliphatic hydrocarbons and light aromatics than high-temperature coal tars, they can be used as raw materials for liquid fuels and chemicals, and the content of heavy components in coal tar produced by the existing medium and low-temperature pyrolysis process is still as high as about 50%.3−5 With the development of economy and the urgency of environmental protection, the quality requirements for fuel oil are becoming higher and higher, so the use of coal tar to produce cleaner liquid fuels has become a research hotspot.6
The middle and low-temperature coal tar produced by carbonization has not been cracked secondarily. Therefore, there are many light components in the medium and low-temperature coal tar.7 The light fractions obtained after fractionation can be used for blending gasoline and diesel. High temperature cracking is the process of converting large molecules into small molecular compounds, but it requires high equipment, more energy consumption, and easily blocks pipelines.8−10 Through hydrocracking, coal tar can obtain gasoline, diesel oil, kerosene, and other distillate fuels. Catalytic cracking can overcome the shortcomings of thermal cracking, reduce the activation energy of molecular reactions, and thus reduce the reaction temperature.11
Compared with the traditional coal tar hydrogenation process, the coal pyrolysis and tar catalytic cracking processes are performed simultaneously, the energy consumption is lower, and it has better economic benefits.12−14 Meanwhile, the heavy components are degraded to form small molecular substances, which are more conducive to the condensation and separation of coal tar downstream of the process.15 The in situ catalytic cracking of gas tar is that the gas tar from coal pyrolysis enters into the catalytic layer for catalytic cracking before it is condensed. Under the action of catalyst and heat, the heavy components in coal tar undergo cracking and aromatization reactions and are converted into light aromatics, oil products, gases, and so forth.16−18 The advantage of gas-phase tar in situ catalytic cracking is that the heavy components in tar are lightened, which can increase their utilization value. The lightning of tar can solve the problem of equipment and pipeline blockage caused by the condensation of heavy components in tar.19,20 The catalyst is also easily separated and recovered in the catalytic layer. High-temperature gas-phase tar produced by pyrolysis enters the catalytic layer for catalysis, which avoids the energy consumption of tar heating in the traditional catalytic cracking process and improves the energy efficiency of the process.21−23
In the process of in situ catalytic cracking to achieve gas tar upgrading, the choice of catalyst is particularly important. Metal oxide catalysts show good hydrogenation performance during coal pyrolysis and can reduce the hydrogenation reaction temperature, which is very suitable as a catalyst for coal pyrolysis to produce tar.24 The molecular sieve catalyst has the advantages of a unique pore structure, large specific surface area, strong acidity, and good selective catalytic performance.25,26 It can convert the aromatic compounds in the thick ring during pyrolysis into useful chemicals and raw materials in the chemical industry. The supported catalyst can flexibly control its physical and chemical properties and improve its catalytic performance through the choice of support, active components, auxiliaries, and changes in preparation process conditions.27−29 Therefore, it has been widely studied in the catalytic cracking of coal tar. In recent years, coal-based carbon materials have also been widely used, such as activated carbon, foamed carbon, pyrolytic coke, and carbon-based supported catalysts.30
In order to improve the ratio of light oil, the active component loaded on pyrolysis coke is considered in this paper, which leads to the problem of the preparation method of the supported catalyst.31 The traditional catalyst preparation method generally adopts the impregnation or sol–gel method.32 Both methods must adopt the calcination method. The calcination temperature is above 300 °C.33 This high-temperature calcination process will cause pyrolysis coke to ignite. The process must be completed in an anaerobic environment. Therefore, it is difficult to control the process, and even if the reaction conditions are controlled, the prepared catalyst is prone to agglomeration, the active component distribution of the catalyst is uneven, and the catalytic activity is low. Based on the above problems, a low-temperature plasma calcination method is proposed to prepare a pyrolysis coke-supported catalyst. Low-temperature plasma, as an effective technical method, has become increasingly connected with the catalyst field. Compared with traditional catalysts, the catalyst has many significant advantages such as short preparation time, large specific surface area of the catalyst, high dispersion of active components, many lattice defects, and good stability, which can fully meet the above requirements.34,35
In this paper, a vapor-modified pyrolysis coke was used as the carrier, the ZHPC catalyst was prepared by plasma calcination, and the catalyst was subjected to heavy tar cracking and characterized by Brunauer–Emmett–Teller (BET), X-ray electron spectroscopy (XPS), X-ray diffraction (XRD), and scanning electron microscopy (SEM). It can achieve comprehensive utilization of coal and improves tar yield.
2. Results and Discussion
2.1. Coal Sample Analysis
2.1.1. Proximate and Ultimate Analyses
Table 1 shows the proximate and ultimate analyses of coal samples.
Table 1. Proximate and Ultimate Analyses of Coal Samples (%).
| Mad | Aad | Vad | FCad | C | H | N |
|---|---|---|---|---|---|---|
| coal sample | ||||||
| proximate analysis/% | ultimate analysis/% | |||||
| 15.23 | 16.58 | 36.56 | 32.53 | 58.93 | 4.093 | 1.136 |
2.1.2. Thermal Weight Analysis of Lignite
The weight loss curve [thermogravimetric (TG) analysis] and the weight loss rate curve [derivative thermogravimetric (DTG) analysis] of lignite under a N2 atmosphere at a heating rate of 15 °C/min are shown in Figure 1. It can be seen that the weight loss of lignite was divided into three stages. The first stage was between room temperature and 150 °C, called the drying stage, mainly the precipitation of moisture and adsorbed gas. The second stage was between 150 and 300 °C; this stage was in the preheating stage. No obvious pyrolysis occurred. There was no obvious change in the TG and DTG curves. The third stage was between 300 and 500 °C. This stage was a pyrolysis stage of coal, where functional groups were decomposed such as a phenolic carboxyl group having a poor thermal stability in a molecular structure and a bridge structure was broken between an aromatic ring and a side chain of a fat in a macromolecular network. A large number of gaseous hydrocarbons and tar vapors were released. The coal lost weight quickly and had a maximum rate of weight loss. The DT curve of the coal dropped sharply after 400 °C, and the DTG curve also showed the highest peak of weight loss. The peak temperature of the pyrolysis was 450 °C, which was the temperature corresponding to the maximum weight loss temperature. The maximum weight loss temperature reflected the stability of the coal macromolecular structure. The lower the peak temperature, the more easily the network structure in coal was destroyed. The higher the reactivity of coal, the more unstable the structure was during pyrolysis.
Figure 1.

TG and DTG curves of lignite.
2.2. Effect of the ZHPC Catalyst on Tar Cracking under Different Plasma Calcination Conditions
2.2.1. Effect of the ZHPC Catalyst on Tar Cracking under Different Plasma Calcination Time
The optimal vapor-modified pyrolysis coke (HPC) was prepared by an equal volume impregnation method with a supported 5% loading pyrolysis catalyst; it was placed in a plasma reactor and calcined in an oxygen atmosphere. The calcination power was 45 W, and the calcination time was 1, 3, 5, and 8 min to prepare ZHPC catalysts, namely, ZHPC-1min, ZHPC-3min, ZHPC-5min, and ZHPC-8min, respectively; 3 g was weighed for tar cracking. Figure 2 is the effect of ZHPC on tar cracking by plasma at different calcination times.
Figure 2.

Effect of the ZHPC catalyst on tar cracking under different plasma calcination times. (a) Total gas and tar yield. (b) Gas yield. (c) Component proportion of tar.
As can be seen from Figure 2a, after the plasma calcination of ZHPC as a catalyst, with the increase of the plasma calcination time, the total yield of pyrolysis gas first increases and then decreases, and the tar first decreases and then increases. Among them, under the condition of ZHPC-5min, the tar produced by pyrolysis coke cracking is at least 0.63632 g. The yield of catalytic cracking tar is reduced by 0.688 g, and the tar cracking efficiency is improved by 51.9%. The pyrolysis coke catalytic cracking produced the largest amount of gas; the total gas yield reached 16.3 L and increased by 64.6%. Therefore, at different calcination times of the plasma, the order of the pyrolysis cracking effect is 5 min > 8 min > 3 min > 1 min.
Figure 2b shows that after ZHPC of plasma with different calcination times, the amounts of H2, CO2, CH4, and CO gases produced by cracking tar show a trend of increasing and then decreasing, indicating ZHPC of plasma with different calcination times have different effects. The combustible gas H2, CH4, and CO produced by catalytic pyrolysis of ZHPC-5min increased to a large extent compared with the pyrolysis of raw coal. Because the more combustible the gas produced by pyrolysis coke catalytic cracking of gas tar, the better the effect of ZHPC-5min on gas tar cracking.
Figure 2c shows the effect of ZHPC on tar composition at different calcination times. In the tar grouping, the higher the content of light oil, phenol oil, naphthalene oil, and washing oil, the lower the content of asphalt and anthracene oil and the better the quality of the tar. It can be seen that the contents of light oil, phenol oil, naphthalene oil, and wash oil increase first and then decrease with the increase of calcination time of ZHPC; the contents of anthracene oil and asphalt decrease with the increase of temperature, so it can be concluded that as the calcination time of the preparation pyrolysis coke rises, the tar yield gradually becomes better. It can also be seen that the ZHPC-5min tar cracking is obvious, the overall contents of light oil, phenol oil, naphthalene oil and washing oil produced are the highest, and the anthracene oil and asphalt are reduced the most. Therefore, from the perspective of tar composition changes, ZHPC-5min has the best tar cracking effect. Coal tar contains a large number of chain hydrocarbons, cyclic hydrocarbons, aromatic hydrocarbons, and heterocyclic compounds containing oxygen, nitrogen, and sulfur. There are many types of compounds and complex components. Many substances will be cracked when they undergo different thermal coking. Temperature bridges such as −CH2–, −O–, −S–, and so forth will break, and large molecules become small molecules and gases. The formulae 1 and 2are as follows.
| 1 |
| 2 |
Table 2 shows the changes of light components and heavy components after tar cracking. The light components are the yield of light oil, phenol oil, naphthalene oil, and wash oil, and the heavy components are anthracene oil and asphalt. The proportion of light group is higher, and the effect is better. ZHPC-5min tar cracking is obvious, and the proportion of light components increased from 36.65 to 55.80%.
Table 2. Changes of Light and Heavy Components after Tar Cracking.
| calcination time |
|||||||
|---|---|---|---|---|---|---|---|
| coal | PC | HPC | ZHPC-1min | ZHPC-3min | ZHPC-5min | ZHPC-8min | |
| light component (g) | 0.3551 | 0.4390 | 0.4537 | 0.3698 | 0.3728 | 0.3551 | 0.3618 |
| heavy component (g) | 0.9689 | 0.7620 | 0.5512 | 0.3279 | 0.3100 | 0.2813 | 0.3045 |
| light component ratio (%) | 26.8 | 36.55 | 45.15 | 53 | 54.60 | 55.80 | 54.30 |
Figure 2 shows that the effect of ZHPC-5min on gas tar cracking is better and the proportion of light components is the highest. Because of the short effective discharge time of the plasma, fewer active particles are generated, the zinc nitrate loaded on the pyrolytic coke surface cannot be fully oxidized by the plasma, and fewer active sites are generated. With the increase of modification time, the number of high energy oxygen containing particles ionized from the system increases, the energy injected into the system increases, the etching strength of organic matter on the catalyst surface increases, and the metal salt ions loaded on the catalyst surface have enough time for oxidation reaction to generate oxides conducive to tar cracking. The number of active sites on the catalyst surface also gradually increases, which significantly improved the chemical properties of the catalyst surface, thus increasing tar cracking efficiency and gas production. However, the modification time should not be too long. Such a large number of high energy particles will destroy the pore structure of the catalyst, change the position of the original effective active site, and reduce the effect of the catalyst. Therefore, the effect of ZHPC-5min on gas tar cracking is better.
2.2.2. Effect of the ZHPC Catalyst on Tar Cracking under Different Plasma Calcination Powers
The optimal HPC was prepared by a volumetric immersion method with a supported 5% loading pyrolysis catalyst. The catalyst was placed in a plasma reactor and calcined in an oxygen atmosphere, and the calcination power was 45, 60, and 75 W, respectively. Calcination time was 5 min to prepare the ZHPC catalyst, namely, ZHPC-45W, ZHPC-60W, and ZHPC-75W, 3 g was weighed for tar cracking. Figure 3 is the effect of the ZHPC catalyst on tar cracking under different plasma calcination powers.
Figure 3.

Effect of the ZHPC catalyst on tar cracking under different plasma calcination powers. (a) Total gas and tar yield. (b) Gas yield. (c) Component proportion of tar.
It can be seen from Figure 3a that with the increase of plasma calcination power, the total yield of pyrolysis gas increases first and then decreases, and the tar decreases first and then increases. Among them, under the condition of ZHPC-60W, the tar produced by pyrolysis coke catalytic cracking is at least 0.62277 g, and the tar is reduced by 0.701 g and increased by 52.9%. The pyrolysis coke catalytic cracking produced the largest amount of gas; the total gas yield reached 16.35 L and increased by 65.1%. Therefore, at different calcination power of the plasma, the order of pyrolysis cracking effect is 60 W > 45 W > 75 W.
It can be seen from Figure 3b that after ZHPC by plasma with different calcination power, with the increase of power, the amounts of H2, CO2, CH4, and CO gases produced by tar cracking will increase first and then decrease. This shows different calcination powers of plasma have different effects. Comparing ZHPC-45W and ZHPC-75W, the flammable gases H2, CH4, and CO produced by the ZHPC-60W catalytic cracking have increased to a greater extent. The more flammable the gas produced by pyrolytic coking catalytic cracking of gas-phase tar, the better. Therefore, the plasma calcination power is 60 W, and the pyrolysis coke has the best cracking effect.
Figure 3c shows the effect of ZHPC with different calcination powers on tar composition. It can be seen that when pyrolysis coke with different calcination powers of the plasma is added, tars with different boiling points are cracked to make the percentage content change. ZHPC-60W tar oil crack obviously, which caused the asphalt content to be greatly reduced, and the content of anthracene oil is increased; the contents of light oil and phenol oil are significantly increased; naphthalene oil and washing oil produced by tar oil are reduced. Therefore, from the perspective of tar composition changes, ZHPC-60W tar has the best cracking effect. Table 3 shows the changes of light and heavy components after tar cracking under different calcination powers. As can be seen, the proportion of light components in tar under ZHPC-60W is higher, and the effect is better, increasing from 26.8 to 59.30%.
Table 3. Changes of Light and Heavy Components after Tar Cracking.
| calcination power |
||||||
|---|---|---|---|---|---|---|
| coal | PC | HPC | ZHPC-45W | ZHPC-60W | ZHPC-75W | |
| light component (g) | 0.3551 | 0.4390 | 0.4537 | 0.3551 | 0.3693 | 0.3740 |
| heavy component (g) | 0.9689 | 0.7620 | 0.5512 | 0.2813 | 0.2535 | 0.3123 |
| light component ratio (%) | 26.8 | 36.55 | 45.15 | 57.01 | 59.30 | 54.50 |
It can be seen from Figure 3 that when the modified power is 45 W, the plasma discharge intensity is insufficient, there are fewer high energy oxygen containing particles in the system, the etching effect on the catalyst surface is not obvious, and the modification effect is poor. When the modification power is 75 W, the plasma discharge is violent. During the modification process, the high energy oxygen containing electron flow constantly strikes the catalyst surface, destroys the original functional group structure and pore structure, and deactivates the active site, resulting in the decrease of the effect. When the modified power is 60 W, the tar cracking efficiency and gas production are the highest, and the proportion of flammable gas is higher than other powers. This is because the zinc nitrate on the pyrolytic coke surface is completely converted into zinc oxide and uniformly distributed on the catalyst surface, resulting in an increase in active sites and the best effect of tar cracking. Therefore, the optimal modification power is 60 W.
2.2.3. Effect of Pyrolytic Coke on Tar Cracking under Different ZnO Loadings
The optimal vapor-modified pyrolysis coke was prepared by an equal volume impregnation method with 5, 10, and 15% loading capacity of a supported pyrolysis coke catalyst. The catalyst was placed in a plasma reactor, and oxygen was introduced for calcination. The calcination power was 60 W, and the calcination time was 5 min respectively. ZHPC catalysts were prepared, namely, ZHPC-5%, ZHPC-10%, and ZHPC-15%, and 3 g was weighed for tar cracking. Figure 4 is the effect of ZHPC on tar cracking under different ZnO loading.
Figure 4.

Effect of ZHPC on tar cracking under different ZnO loadings. (a) Total gas and tar yield. (b) Gas yield. (c) Component proportion of tar.
Figure 4a shows the effect of ZHPC with different loading amounts of ZnO on gas and tar yield. It can be seen that with the increase of ZnO loading, the total yield of pyrolysis gas first increases and then decreases and the tar decreases and then increases. Under the condition of ZHPC-10%, the tar produces at least 0.60277 g, the yield of catalytic cracking tar is reduced by 0.721 g and increased by 54.47%. The pyrolysis coke catalytic cracking produced the largest amount of gas, with a total gas yield of 16.45 L, and increased by 66.16%. Therefore, the cracking effect of ZHPC-10% is better.
Figure 4b shows the effect of ZHPC under different ZnO loadings on the gas composition. It can be seen that the yields of H2, CO2, CH4, and CO produced by tar cracking change with the addition of different loading amounts of ZnO, indicating that it has different cracking effects. Compared with the raw coal, the flammable gas (H2, CH4, and CO) produced after ZHPC-10% cracking has increased to a large extent. The more combustible the gas produced by ZHPC is, the better in situ catalytic cracking of gas-phase tar. Therefore, the effect of ZHPC-10% tar cracking to produce flammable gas is better.
Figure 4c shows the effect of different loading amounts of ZnO on tar composition. It can be seen that ZHPC-10% has an obvious tar cracking effect, which greatly reduces the asphalt content, increases the anthracene oil content, obviously increases the light oil and phenol oil contents, and slightly reduces the naphthalene oil content and wash oil content produced by tar cracking. Therefore, from the perspective of tar composition changes, ZHPC-10% tar has the best cracking effect. Figure 5a–c shows catalysts with a plasma calcination time of 5 min, power of 60 W, and a ZnO loading of 10%. It can be seen that because of the tar cracking, the light components of the tar increase and the tar yield is improved.
Figure 5.
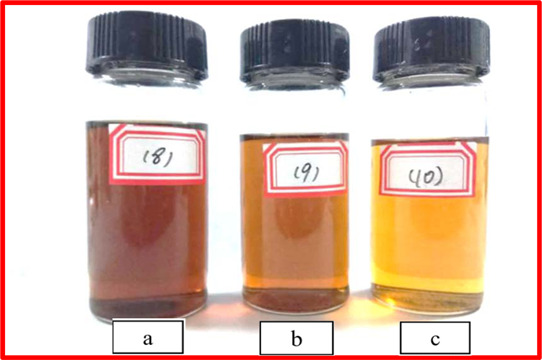
Tar image after cracking. Note: photoed by Shu Hao.
Table 4 shows the changes of light components and heavy components after ZHPC tar cracking. As can be seen, the proportion of light components in the tar is higher and the effect is better. ZHPC-10min tar cracking is obvious.
Table 4. Changes of Light and Heavy Components after Tar Cracked by Different ZnO Loadings.
| ZnO loading |
||||||
|---|---|---|---|---|---|---|
| coal | PC | HPC | ZHPC-5% | ZHPC-10% | ZHPC-15% | |
| light component (g) | 0.3551 | 0.4390 | 0.4537 | 0.3724 | 0.3659 | 0.3685 |
| heavy component (g) | 0.9689 | 0.7620 | 0.5512 | 0.2504 | 0.2369 | 0.2978 |
| light component ratio (%) | 26.8 | 36.55 | 45.15 | 59.80 | 60.70 | 55.31 |
It can be seen from Figure 4 that when ZnO loading is 10%, the total amount of pyrolysis gas is the largest and the proportion of combustible gas is also the highest. The reason may be that when the loading is 10%, manganese nitrate attached to the surface of pyrolysis coke is fully oxidized and the generated manganese oxide can oxidize gaseous hydrocarbon to generate hydrogen. When the loadings are 5 and 15%, because the plasma treatment time is relatively short, the manganese nitrate supported on the catalyst surface cannot be completely oxidized. Hence, the catalytic effect is relatively poor and the optimal ZnO loading can be determined to be 10%.
2.3. Catalyst Characterization
2.3.1. BET of the Catalyst
Before and after the reaction, the specific surface areas of different catalysts are shown in Table 5. As can be seen, the optimal vapor pyrolysis modification conditions make the specific surface area the largest. After ZnO loading, the specific surface area of pyrolysis coke becomes smaller, and the specific surface area decreases as the load increases. The thermal pyrolysis of the load forms ZnO particles inside it, which blocks the thermally decomposed pores, and the more the load, the more the oxide particles are formed and the larger the pores are blocked. As it increases, the specific surface area of pyrolysis becomes smaller. At the same time, after the reaction, the specific surface area has also decreased to a large extent. The main reason is that a portion of the tar molecules are adsorbed on the surface, clogging the pores and reducing the specific surface area. After the reaction, the specific surface area of ZHPC-10% is similar to that of the optimal HPC.
Table 5. Specific Surface Area of Catalysts (m2/g).
| PC | HPC | ZHPC-5% | ZHPC-10% | ZHPC-15% | ZHPC-10% after reaction | |
|---|---|---|---|---|---|---|
| BET (m2/g) | 68.9 | 331.15 | 268.13 | 231.56 | 199.25 | 148.75 |
2.3.2. XRD Pattern of the ZHPC Catalyst
Figure 6 shows the XRD of the catalyst with different ZnO loadings. It can be seen that after Zn-loaded pyrolysis coke modified by plasma calcination, two kinds of metal oxides are formed on the catalyst, namely, ZnO and ZnO2, and the dispersion of the metal oxide is relatively uniform. It can be seen that the plasma can increase the dispersibility of the metal oxide. ZnO has better crystallinity and dispersibility, while ZnO2 has poor stability, can occur ZnO2 → ZnO + 1/2O2, so the amount of ZnO2 formed on the catalyst is very small. It is mainly ZnO that played a catalytic role in the actual catalytic cracking reaction.
Figure 6.

XRD pattern of the ZHPC catalyst.
Although flammable gas (H2, CH4, and CO) is produced in the pyrolysis process, the reducibility of Zn is stronger than that of hydrogen, so it is difficult to decompose zinc oxide. Only when the temperature reaches 1975 °C can zinc oxide decompose to produce zinc vapor and oxygen. Elemental carbon can be used for the reduction of zinc in zinc oxide and react at high temperature.
2.3.3. XPS Pattern of the ZHPC Catalyst
It can be seen from the peak of oxygen in Figure 7c that there are two forms of oxygen in the catalyst, where 531.8 eV and 533.6 eV belongs to lattice oxygen and chemical adsorption oxygen, respectively, and the lattice oxygen intensity is significantly higher than the chemical adsorption oxygen intensity. After the reaction, the lattice oxygen area is largely reduced; therefore, the amount of lattice oxygen after the reaction is less. It can be seen from the peak of oxygen in Figure 8c that the intensity of the lattice oxygen increases and the strength of the chemisorbed oxygen decreases after the reaction, indicating that the lattice oxygen participated in the reaction during the reaction. As can be seen from Figures 7b and 8b, there are two peaks of zinc on the catalyst surface, 1022 eV is Zn 2p3/2, 1045 eV is Zn 2p1/2, and the oxide is ZnO. The strength of ZnO decreases after the reaction, indicating that ZnO plays a major role in the reaction. It can be seen from the XRD spectrum that the catalyst includes more ZnO, and this result can be better verified by combining XPS. It indicates that a highly active metal oxide is formed on the surface of the plasma calcination catalyst, which is favorable for promoting the cracking of the gas phase tar by the catalyst.
Figure 7.

ZHPC-10% before reaction.
Figure 8.

ZHPC-10% after reaction.
In the whole process of catalytic cracking, ZnO plays a major catalytic role. ZnO is a P-type semiconductor with considerable nonstoichiometric oxygen present. Because coal mainly produces gaseous hydrocarbons during the pyrolysis stage, the formation of hydrogen is mainly due to the oxidative dehydrogenation of gaseous hydrocarbons. The mechanism of oxidative dehydrogenation of gaseous hydrocarbons on ZnO can be inferred as follows: first, gaseous hydrocarbons react with lattice oxygen [O] in ZnO to form a −H to form a hydrocarbyl radical and then further desorb a −H to form lower-order hydrocarbons. Therefore, we speculate the reaction mechanisms of oxidative dehydrogenation of gaseous hydrocarbons on ZnO catalysts which are as follows.
| 3 |
| 4 |
| 5 |
2.3.4. SEM Pattern of ZHPC-10%
It can be seen from Figure 9 that after ZnO loading, there are more particles on the surface. It is speculated that these particles may be zinc oxide, which provided more active sites for the gas phase tar. After tar cracking, the particles of ZHPC catalysts change greatly, and the number of particles decrease. Therefore, many particles and active sites are consumed in the process of cracking tar, and the effect of cracking tar is achieved (Figure 10).
Figure 9.
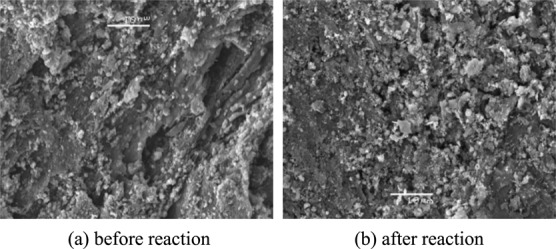
SEM of ZHPC-10%.
Figure 10.

Tar catalytic cracking process.
3. Conclusions
In this paper, vapor-modified pyrolysis coke was used as the raw material. The ZnO-loaded pyrolysis coke catalyst is prepared by the equal volume impregnation method. The pyrolysis coke is calcined by plasma. The effects of ZnO loading, calcination time, and calcination power on tar cracking were studied. The results showed that:
-
(1)
Compared with traditional catalysts, the catalyst prepared by plasma has the advantages of short preparation time, large specific surface area, high dispersion of active components, many lattice defects, and good stability which can fully meet the above requirements.
-
(2)
Vapor-modified pyrolysis coke is used as carrier; the ZHPC catalyst is prepared by the plasma calcination method, and the catalyst cracks the heavy tar. The cracking effect of heavy tar is improved, and it can achieve comprehensive utilization of coal and improves tar yield.
-
(3)
The optimal plasma calcination time is 5 min, calcination power is 60 W, and ZnO loading is 10%. The tar cracking effect is the best.
-
(4)
Compared with the pyrolysis of raw coal, the yield of gas produced is increased from 9.9 to 16.45 L, that is, increased by 66.16%; the tar is decreased from 1.324 to 0.603 g, and the cracking rate of tar is increased by 54.46%.
4. Materials and Methods
4.1. Materials
The lignite used in the experiment was produced in Ordos. The lignite was crushed, and particles with 3–5 mm were screened. The screened lignite particles was put into a 60 °C drying oven for drying and then put into a dryer for standby. In the experiment, 3–5 mm lignite particles were used to prepare different types of pyrolysis coke catalysts.
4.2. Preparation of the ZHPC Catalyst by Plasma
-
(1)
Weigh 100 g lignite particles and put them into the pyrolysis furnace. The pyrolysis constant temperature time of the pyrolysis furnace was 2 h, and the final pyrolysis temperature was 750 °C. Pyrolysis coke was prepared as the carrier of subsequent modification and named PC.
-
(2)
PC was used as the carrier, placed in a tubular furnace, modified by vapor, and set at a constant flow rate of 450 mL/min, a temperature of 650 °C, and a time of 60 min, and the prepared pyrolysis coke catalyst was named HPC.
-
(3)
The mass of zinc nitrate hexahydrate required for the preparation of ZHPC catalysts with 5% loading was 0.551 g, which was placed in a distilled zinc nitrate solution. Then, 3 g HPC was placed in a zinc nitrate solution, impregnated 24 h with the equivalent volume impregnation method, and dried for 1 h at 110 °C. The calculation formula of zinc nitrate required is as follows
| 6 |
-
(4)
The HPC impregnated in (3) was placed in the plasma, and oxygen was used as the calcination atmosphere. The flow rate was 60 mL/min, calcination power was 45 W, and calcination time was 1, 3, 5, and 8 min. ZHPC catalysts with different plasma calcination times were prepared and named ZHPC-1min, ZHPC-3min, ZHPC-5min, and ZHPC-8min, respectively.
-
(5)
Taking the optimal time of plasma in (4) as the calcination time, the impregnated HPC was placed in the plasma, oxygen was used as the calcination atmosphere, the flow rate was 60 mL/min, and powers were 45, 60, and 75 W. ZHPC catalysts with different calcination powers were prepared, which were named ZHPC-45W, ZHPC-60W, and ZHPC-75W.
-
(6)
Taking the optimal power of plasma in (5) as the optimal calcination power, the impregnated HPC with 5, 10, and 15% ZnO loadings were prepared by the equal volume impregnation method. The impregnated HPC was placed in the plasma, oxygen was used as the calcination atmosphere, the flow rate was set to 60 mL/min, and time was 5 min. ZHPC catalysts with different loadings were prepared by the plasma calcination, which were named ZHPC-5%, ZHPC-10%, and ZHPC-15%.
4.3. Catalyst Activity Evaluation
4.4. Detection of the Gas and the Tar
4.4.1. Gas Detection
The gas produced by catalytic cracking of tar gas is collected using the gas collecting bag. The gas composition was analyzed using an Agilent-7820A gas chromatograph. The measured gas mainly consists of H2, CO, CO2, and CH4.
4.4.2. Tar Detection
The tar detection was mainly carried out by means of simulated distillation to analyze the distribution of each fraction and carried out on a simulated distillation chromatogram. The principle of this method was a nonpolar column with a certain degree of separation, testing the retention time of known mixture components under linear temperature programming conditions. Then, under the same chromatographic conditions, the samples were sequentially separated according to the boiling points of the components, and the slice integration was performed to obtain the corresponding cumulative area and the corresponding retention time. After temperature–time interpolation correction, a temperature corresponding to a percent yield was obtained, which was in a distillation range. The cumulative area percentage was the yield. Table 6 shows boiling point ranges for classifying tar fractions.
Table 6. Boiling Point Ranges for Classifying Tar Fractions.
| coal tar fraction |
||||||
|---|---|---|---|---|---|---|
| light oil | phenolic oil | naphthalene oil | washing oil | anthracene oil | asphalt | |
| boiling point (°C) | <170 | 170–210 | 210–230 | 230–300 | 300–360 | >360 |
4.5. Characterization of the Catalysts
TG analysis of the raw coal: the raw coal was analyzed using a Swiss Mettler Toledo TGA/SDTA851e TG analyzer. During the experiment, the carrier gas was selected from high purity N2, the gas flow rate was 60 mL/min, the temperature range was 24–500 °C, and the heating rate was 15 °C/min.
Specific surface area analysis (BET): the JW-BK122W type surface and pore size analyzer were used to measure the specific surface area of different types of pyrolysis coke catalysts.
SEM: JSM-6460LV, working voltage 20 kV, magnification 5000×.
XPS: XPS is an important tool for analyzing the surface structure and composition of an element, and it can get the composition of the test object.
XRD: An XD-3 type ray diffractometer; the test parameters: the voltage was 36 kV, the current was 25 mA, the target was Cu, 2θ/θ is 10–80°, and scanning speed was 4 °/min.
Acknowledgments
This research was funded by the National Natural Science Foundation of China [grant numbers: 51704230 and 41907255]; the Key Laboratory of Coal Resources Exploration and Comprehensive Utilization, the Ministry of Natural Resources in P. R. China [grant number: KF2019-7]; the Shannxi Key Research and Development Project [grant number: 2019ZDLSF05-05-01]; 2019 Shaanxi Provincial Natural Science Basic Research Program Enterprise Joint Fund Project [grant number: 2019JL-01]; the Natural Science Basic Research Plan in Shaanxi Province of China [grant number: 2018JM5048]; and Xi’an Science and Technology Plan Project [grant number: 2019217714GXRC013CG014-GXYD13.4].
Author Contributions
Conceptualization, Zhang Lei(F) and Zhang Lei(M); methodology, S.H.; software, J.Y.; validation, J.Y.; investigation, Zhang Lei(M); data curation, K.W.; writing-original draft preparation, S.H.;and writing-review & editing, S.H.
The authors declare no competing financial interest.
References
- Liu Y.; Yao Q.; Sun M.; Yuan T.; Gao J.; Wang R.; Zhang Y.; Chen H.; Ma X. Process characteristics and mechanisms for catalyzed pyrolysis of low-temperature coal tar. Energy Fuels 2019, 33, 7052–7061. 10.1021/acs.energyfuels.9b01069. [DOI] [Google Scholar]
- Wang Z.; Zhao Y.; Sun R.; Li Y.; Ren X.; Xu J. Effect of reaction conditions on the evolution of surface functional groups in O2/H2O combustion process of demineralized coal char. Fuel Process. Technol. 2019, 195, 106144. 10.1016/j.fuproc.2019.106144. [DOI] [Google Scholar]
- Zhang L.; Gao H.; Chang X.; Zhang L.; Wen X.; Wang Y. S. An application of Green Surfactant Synergistically Metal Supported Cordierite Catalyst in Denitration of Selective Catalytic Oxidation. J. Cleaner Prod. 2020, 249, 119307. 10.1016/j.jclepro.2019.119307. [DOI] [Google Scholar]
- Zhao H.; Li Y.; Song Q.; Liu S.; Yan J.; Ma Q.; Ma L.; Shu X. Investigation on the thermal behavior characteristics and products composition of four pulverized coals: Its potential applications in coal cleaning. Int. J. Hydrogen Energy 2019, 44, 23620–23638. 10.1016/j.ijhydene.2019.07.087. [DOI] [Google Scholar]
- Song Q.; Zhao H.; Jia J.; Zhang F.; Wang Z.; Lv W.; Yang L.; Zhang W.; Zhang Y.; Shu X. Characterization of the products obtained by pyrolysis of oil sludge with steel slag in a continuous pyrolysis-magnetic separation reactor. Fuel 2019, 255, 115711. 10.1016/j.fuel.2019.115711. [DOI] [Google Scholar]
- Zhang L.; Shu H.; Zhang L.; Jia Y. Gas modified pyrolysis coke for In-Situ catalytic cracking of coal tar. ACS Omega 2020, 10.1021/acsomega.0c00055. [DOI] [PMC free article] [PubMed] [Google Scholar]
- Wang H.; Zhong H.; Bo G. Existing forms and changes of nitrogen inside of horizontal subsurface constructed wetlands. Environ. Sci. Pollut. Res. 2018, 25, 771–781. 10.1007/s11356-017-0477-1. [DOI] [PubMed] [Google Scholar]
- Li Z.; Wang H.; Jing K.; Wang L.; Li Y.; Zhang X.; Liu G. Kinetics and modeling of supercritical pyrolysis of endothermic hydrocarbon fuels in regenerative cooling channels. Chem. Eng. Sci. 2019, 207, 202–214. 10.1016/j.ces.2019.06.019. [DOI] [Google Scholar]
- Boulangé M.; Lorgeoux C.; Biache C.; Michel J.; Michels R.; Faure P. Aging as the main factor controlling PAH and polar-PAC (polycyclic aromatic compound) release mechanisms in historically coal-tar-contaminated soils. Environ. Sci. Pollut. Res. 2019, 26, 1693–1705. 10.1007/s11356-018-3708-1. [DOI] [PubMed] [Google Scholar]
- Li X.-H.; Ma J.-S.; Li L.-L.; Li B.-F.; Feng J.; Turmel W.; Li W.-Y. Semi-coke as solid heat carrier for low-temperature coal tar upgrading. Fuel Process. Technol. 2016, 143, 79–85. 10.1016/j.fuproc.2015.11.013. [DOI] [Google Scholar]
- Wang J.; Lu P.; Su W.; Xing Y.; Li R.; Li Y.; Zhu T.; Yue H.; Cui Y. Study on the denitrification performance of FexLayOz/activated coke for NH3-SCR and the effect of CO escaped from activated coke at mid-high temperature on catalytic activity. Environ. Sci. Pollut. Res. 2019, 26, 20248–20263. 10.1007/s11356-019-05090-5. [DOI] [PubMed] [Google Scholar]
- Hosokai S.; Norinaga K.; Kimura T.; Nakano M.; Li C.-Z.; Hayashi J.-i. Reforming of volatiles from the biomass pyrolysis over charcoal in a sequence of coke deposition and steam gasification of coke. Energy Fuels 2011, 25, 5387–5393. 10.1021/ef2003766. [DOI] [Google Scholar]
- Valle B.; García-Gómez N.; Remiro A.; Gayubo A. G.; Bilbao J. Cost-effective upgrading of biomass pyrolysis oil using activated dolomite as a basic catalyst. Fuel Process. Technol. 2019, 195, 106142. 10.1016/j.fuproc.2019.106142. [DOI] [Google Scholar]
- Hita I.; Aguayo A. T.; Olazar M.; Azkoiti M. J.; Bilbao J.; Arandes J. M.; Castaño P. Kinetic Modeling of the Hydrotreating and Hydrocracking Stages for Upgrading Scrap Tires Pyrolysis Oil (STPO) toward High-Quality Fuels. Energy Fuels 2015, 29, 7542–7553. 10.1021/acs.energyfuels.5b01502. [DOI] [Google Scholar]
- Kumabe K.; Hasegawa Y.; Moritomi H. Effect of Hydrogen Separation on Coal Char Gasification with Subcritical Steam Using a Calcium-Based CO2 Sorbent. ACS Omega 2020, 5, 236–242. 10.1021/acsomega.9b02591. [DOI] [PMC free article] [PubMed] [Google Scholar]
- Niu R.; Yi C.; Chen L.; Liu X.; Tie M.; Wu Z.; Wu Q. The study on in-situ catalytic pyrolysis of sawdust with bio-char catalyst. J. Biobased Mater. Bioenergy 2019, 13, 784–789. 10.1166/jbmb.2019.1912. [DOI] [Google Scholar]
- Gao R.; Liu Y.; Liu B.; Xu Z. Novel utilization of pyrolysis products produced from waste printed circuit boards: catalytic cracking and synthesis of graphite carbon. J. Cleaner Prod. 2019, 236, 117662. 10.1016/j.jclepro.2019.117662. [DOI] [Google Scholar]
- Al-Fatesh A. S.; Fakeeha A. H.; Khan W. U.; Ibrahim A. A.; He S.; Seshan K. Production of hydrogen by catalytic methane decomposition over alumina supported mono-, bi- and tri-metallic catalysts. Int. J. Hydrogen Energy 2016, 41, 22932–22940. 10.1016/j.ijhydene.2016.09.027. [DOI] [Google Scholar]
- Zhao H.; Wang B.; Li Y.; Song Q.; Zhao Y.; Zhang R.; Hu Y.; Liu S.; Wang X.; Shu X. Effect of chemical fractionation treatment on structure and characteristics of pyrolysis products of Xinjiang long flame coal. Fuel 2018, 234, 1193–1204. 10.1016/j.fuel.2018.08.015. [DOI] [Google Scholar]
- Zhang L.; Chen JH.; Lei Z.; He HB.; Wang YS.; Li Y. H. Preparation of soybean oil factory sludge catalyst and its application in selective catalytic oxidation denitration process. J. Cleaner Prod. 2019, 225, 220–226. 10.1016/j.jclepro.2019.03.254. [DOI] [Google Scholar]
- Shu D.; Liu H.; Chen T.; Chen D.; Zou X.; Wang C.; Li M.; Wang H. The positive effect of siderite-derived alpha-Fe2O3 during coaling on the NO behavior in the presence of NH3. Environ. Sci. Pollut. Res. 2020, 10.1007/s11356-020-07829-x. [DOI] [PubMed] [Google Scholar]
- Wang W.; Yao H.; Yue L. Supported-catalyst CuO/AC with reduced cost and enhanced activity for the degradation of heavy oil refinery wastewater by catalytic ozonation process. Environ. Sci. Pollut. Res. 2019, 27, 7199–7210. 10.1007/s11356-019-07410-1. [DOI] [PubMed] [Google Scholar]
- Zhao J.-P.; Cao J.-P.; Wei F.; Zhao X.-Y.; Feng X.-B.; Huang X.; Zhao M.; Wei X.-Y. Sulfation-acidified HZSM-5 catalyst for in-situ catalytic conversion of lignite pyrolysis volatiles to light aromatics. Fuel 2019, 255, 115784. 10.1016/j.fuel.2019.115784. [DOI] [Google Scholar]
- Tan W. K.; Muto H.; Ito T.; Kawamura G.; Lockman Z.; Matsuda A. Facile Fabrication of Plasmonic Enhanced Noble-Metal-Decorated ZnO Nanowire Arrays for Dye-Sensitized Solar Cells. J. Nanosci. Nanotechnol. 2020, 20, 359–366. 10.1166/jnn.2020.17223. [DOI] [PubMed] [Google Scholar]
- Rathsack P. Analysis of pyrolysis liquids obtained from the slow pyrolysis of a German brown coal by comprehensive gas chromatography mass spectrometry. Fuel 2017, 191, 312–321. 10.1016/j.fuel.2016.11.088. [DOI] [Google Scholar]
- Song Q.; Zhao H.; Jia J.; Zhang F.; Wang Z.; Lv W.; Yang L.; Zhang W.; Zhang Y.; Shu X. Characterization of the products obtained by pyrolysis of oil sludge with steel slag in a continuous pyrolysis-magnetic separation reactor. Fuel 2019, 255, 115711. 10.1016/j.fuel.2019.115711. [DOI] [Google Scholar]
- Song Q.; Zhao H.; Jia J.; Yang L.; Lv W.; Gu Q.; Shu X. Effects of demineralization on the surface morphology, microcrystalline and thermal transformation characteristics of coal. J. Biobased Mater. Bioenergy 2020, 145, 104716. 10.1016/j.jaap.2019.104716. [DOI] [Google Scholar]
- Lee M.-j.; Kim D.-H.; Lee M.; Ye B.; Jeong B.; Lee D.; Kim H.-D.; Lee H. Enhanced NOx removal efficiency for SCR catalyst of well-dispersed Mn-Ce nanoparticles on hexagonal boron nitride. Environ. Sci. Pollut. Res. 2019, 26, 36107–36116. 10.1007/s11356-019-04619-y. [DOI] [PubMed] [Google Scholar]
- Du J.; Deng W.; Li C.; Zhang Z.; Yang T.; Cao X.; Du F.; Sun Q. Multi-metal catalysts for slurry-phase hydrocracking of coal-tar vacuum residue: Impact of inherent inorganic minerals. Fuel 2018, 215, 370–377. 10.1016/j.fuel.2017.09.120. [DOI] [Google Scholar]
- Issac M.; Dai B.; Zhang L. Kinetics underpinning the C-CO2 gasification of waste tyre char and its interaction with coal char upon co-gasification. Fuel 2019, 256, 115991. 10.1016/j.fuel.2019.115991. [DOI] [Google Scholar]
- Xu Z.; Gu S.; Sun Z.; Zhang D.; Zhou Y.; Gao Y.; Qi R.; Chen W. Synthesis of char-based adsorbents from cotton textile waste assisted by iron salts at low pyrolysis temperature for Cr(VI) removal. Environ. Sci. Pollut. Res. 2020, 10.1007/s11356-019-07588-4. [DOI] [PubMed] [Google Scholar]
- Zhang L.; Jia Y.; Zhang L.; He H. B.; Yang C.; Luo M.; Miao L. T. Preparation of soybean oil factory sludge catalyst by plasma and the kinetics of selective catalytic oxidation denitrification reaction. J. Cleaner Prod. 2019, 217, 317–323. 10.1016/j.jclepro.2019.01.182. [DOI] [Google Scholar]
- Hossain M. A.; Ganesan P. B.; Sandaran S. C.; Rozali S. B.; Krishnasamy S. Catalytic microwave pyrolysis of oil palm fiber (OPF) for the biochar production. Environ. Sci. Pollut. Res. 2017, 24, 26521–26533. 10.1007/s11356-017-0241-6. [DOI] [PubMed] [Google Scholar]
- Lei Z.; Yang J.; Hao S.; Lei Z.; Xin W.; Min L.; Yusu W.; Dan X. Application of Surfactant-modified Cordierite-based Catalysts in Denitration Process. Fuel 2020, 268, 117242. 10.1016/j.fuel.2020.117242. [DOI] [Google Scholar]
- Wang C.-q.; Jin J.-z.; Lin X.-y.; Xiong D.-m.; Mei X.-d. A study on the oil-based drilling cutting pyrolysis residue resource utilization by the exploration and development of shale gas. Environ. Sci. Pollut. Res. 2017, 24, 17816–17828. 10.1007/s11356-017-9199-7. [DOI] [PubMed] [Google Scholar]