Abstract
We synthesized and determined crystal structures of two manganese(II) aceto EMIM coordination compounds with simplified empirical formulas Mn4(OAc)10[EMIM]2 and Mn4(OAc)10[EMIM]2·2H2O. Both compounds feature extended chains of Mn2+ octahedrally coordinated exclusively by acetate anions, which has been observed for the first time. The EMIM moieties and water molecules participate in hydrogen bonding with acetate anions but do not directly interact with the metal cation. Both compounds have melting temperatures around 120 °C and can be considered as (non-room-temperature) ionic liquids. The structural arrangement represented by the two title compounds is robust in terms of accommodating other types of cations and allows for tuning of physical properties of the ionic liquid by means of cation substitution. Thermal analysis results obtained using TGA–DSC and VT IR suggest melting phase transitions around 120 °C, followed by structural rearrangement in the molten state taking place around 140–160 °C. Compounds I and II have a higher thermal stability range compared to [EMIM][OAc] ionic liquid, with an onset decomposition temperature above 260 °C.
1. Introduction
An ionic liquid is a salt in the liquid state; however, liquid salts have been divided into two separate categories by virtue of their melting temperatures. Ionic liquids are designated as salts whose melting point is below 100 °C, while molten salts are salts with a melting temperature above 100 °C. This classification is arbitrary and does not reflect any fundamental differences between the two classes of materials. Synthesis of liquid salts through combinations of ionic liquids and ionic solids presents opportunities to fine-tune the physicochemical properties of the resulting ionic liquids or molten salts. This approach plausibly enhances or creates new liquid salts with optimized properties for applications such as gas capture or battery electrolytes.
Ionic liquids are considered a class of “green compounds”, which have recently received considerable attention in numerous applications because of their negligible volatility, large liquidus range, and tunable chemical properties.1−5 Traditional ionic liquids contain large asymmetric organic cations and small inorganic anions with short-lived ion pairs. In contrast, ordinary liquids are predominantly made of electrically neutral molecules. Ionic liquids are very effective solvents, are electrically conducting, and find many technological applications, as solvents, catalysts, electrolytes, gas absorbers, and so forth.3−9
Technological performance of ionic liquids is controlled by the liquid structure and dominant intermolecular interactions; however, constraining these properties in the non-periodic liquid state is challenging. Most ionic liquids are believed to crystallize preserving the dominant intermolecular arrangements; thus, characterization of frozen ionic liquids by crystallographic methods is one of the most valuable ways to understand their structure.
1-Ethyl-3-methylimidazolium acetate or [EMIM][OAc] is a well-known and widely studied ionic liquid.2,10,11 The liquid structure of [EMIM][OAc] has been investigated using a combination of molecular dynamics and neutron scattering.12 Mixtures of [EMIM][OAc] with inorganic salts have been studied in search for improved ionic liquid performance.13 Along this path of investigation, some new ionic solids (molten salts) have been grown from mixtures of [EMIM][OAc] with copper(II) acetate/chloride.14 Following a similar approach, we decided to explore the possibilities of synthesis of other transition-metal salts with [EMIM][OAc] in search of novel and improved ionic liquids and molten salts for applications such as gas sorption, battery electrolytes, and forward osmosis water purification. This paper describes the synthesis and characterization of two ambient crystalline compounds that were obtained by thermal treatment of manganese(II) acetate and [EMIM][OAc]. Recently, a new series of interesting manganese(II) acetate coordination polymers with derivatives of pyridine N-oxide have been reported, featuring extended chains of hexacoordinated Mn2+ ions,15 with some of the cation sites coordinated by six acetate ions but overall mixed ligands along the ionic polymer chains. In our project, we obtained anhydrous and hydrated Mn2+ coordination polymers, which show a very similar polymer configuration but with purely acetate ligands.
2. Results and Discussion
2.1. X-ray Diffraction
The manganese(II) ion has a high spin 3d5 electronic configuration, resulting in a lack of the crystal field stabilization effect for any coordination geometries. This usually leads to the diversity of various geometries in complexes. However, most manganese(II) complexes assume an octahedral geometry and only few examples are known to take other coordination geometries. Coordination numbers exceeding six are uncommon, as the cation prefers arrangements with minimized ligand–ligand repulsion. Our precursor compound, solid manganese(II) acetate can be synthesized in one of three hydration states: as anhydrous compound [Mn3O(OAc)6·AcOH·OAc]n,16 as dihydrate17 and tetrahydrate.18 All of these forms feature hexacoordinated Mn2+, but in neither of these compounds is Mn2+ arranged in extended chains.
2.1.1. Compound I
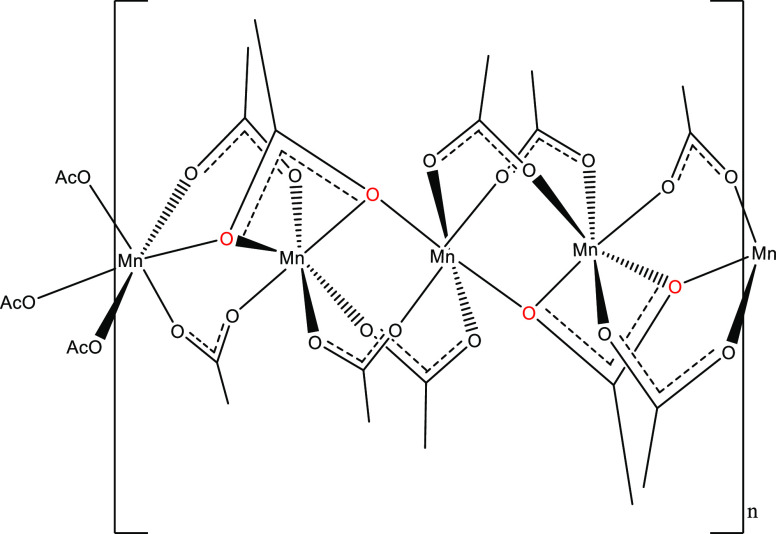
The unit cell of compound I, Mn4(OAc)10[EMIM]2, contains 3 symmetry independent Mn2+ cations. The metal cations are arranged in a chain as [Mn3, Mn2, Mn1, Mn2]n, extending along the (100) direction. As shown in Figure 1, all of the Mn2+ cations are six-coordinated, and all six donor atoms are oxygens contributed by acetate ions. Mn1 is located on an inversion center and is coordinated by 6 acetates. Two acetates (C14) are bidentate μ2-1,3 bridging to Mn2, another two acetates (C15) are μ3-1,3,3 bridging to Mn2 and Mn3, whereas the last two acetates (C12) in addition to bridging Mn2 are also chelating Mn2. Mn2 is coordinated by 5 acetates, one of which (C12), forms 2 chelating bonds. Three of the acetates are μ2-1,3 bridging; C8 and C10 bridge to Mn3, while C14 bridges to Mn1. The last Mn2 ligand C15 bridges μ3-1,3,3 to Mn1 and Mn3. Mn3, like Mn1, is coordinated by 6 acetates, four of which (2 × C8 and 2 × C10) μ2-1,3 bridge to Mn2, whereas the remaining two C15 acetates bridge μ3-1,3,3 to Mn2 and Mn1.
Figure 1.
Schematic representation of the molecular structure and conformation of the chain of interconnected, hexacoordinated Mn2+ cations in compound I. All of the coordinating ligands are acetate ions. Bridging oxygen atoms, bonded to two different Mn2+ cations are marked with red color.
The crystal of compound I contains only one symmetry-independent EMIM ion. The EMIM moieties in compound I are not participating in the coordination of the Mn cations but are interacting via Van der Waals forces and C–H···O hydrogen bonds with the acetate ligands, as shown in Figure 2. The terminal methyl group of the EMIM moiety (C6) is hydrophobic and does not take part in hydrogen bonding. Each of the three EMIM aromatic hydrogens is connected via a hydrogen bond to an acetate oxygen, and C1 methyl hydrogens are also all involved in hydrogen bonds. Each EMIM is hydrogen bonded to a total of ten neighboring acetate ions. Geometric parameters of the hydrogen bonds are reported in Supporting Information Table S1.
Figure 2.
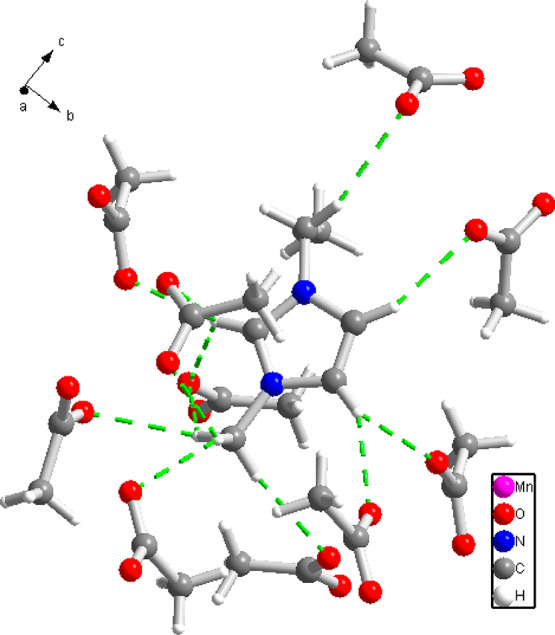
Hydrogen bond interactions of the EMIM moiety and acetate anions in compound I. Each of the three EMIM aromatic hydrogens is connected via a hydrogen bond (green dash lines) to an acetate oxygen.
The general organization of the structure of compound I is shown in Figures 3 and 4. The chains of interconnected coordination polyhedra extend along the (100) direction. Stacking of the neighboring chains and clustering of the hydrophobic methyl groups create fairly large void spaces, where additional guest species could be absorbed. An automated search for structural cavities, performed with the CrystalMaker program, located the center of the structural void at fractional atomic coordinates (0.7134, 0.3413, 0.2090) and estimated the void radius at 3.038 Å, with a void volume of 117.4910 Å3.
Figure 3.
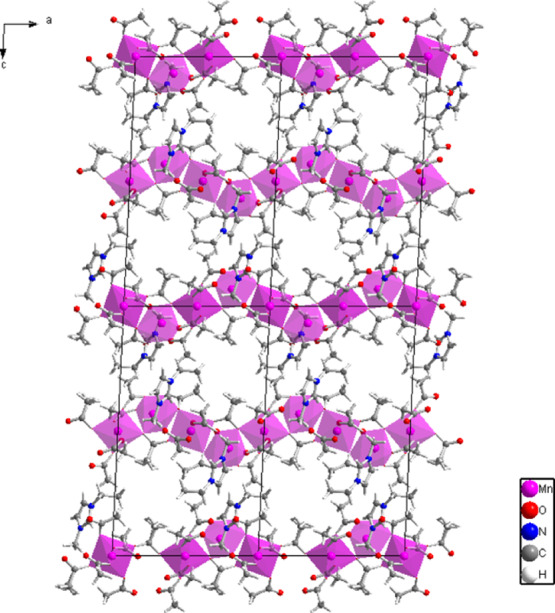
General organization of the crystal structure of compound I viewed along the (010) crystallographic direction. The purple polyhedra represent Mn2+ coordination environments. The chains of interconnected coordination polyhedra extend along the (100) direction.
Figure 4.
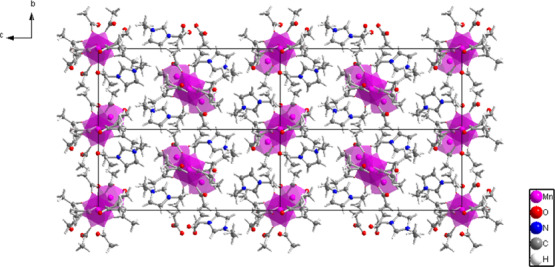
Arrangement of structural elements of compound I viewed along the chain propagation direction (100).
2.1.2. Compound II
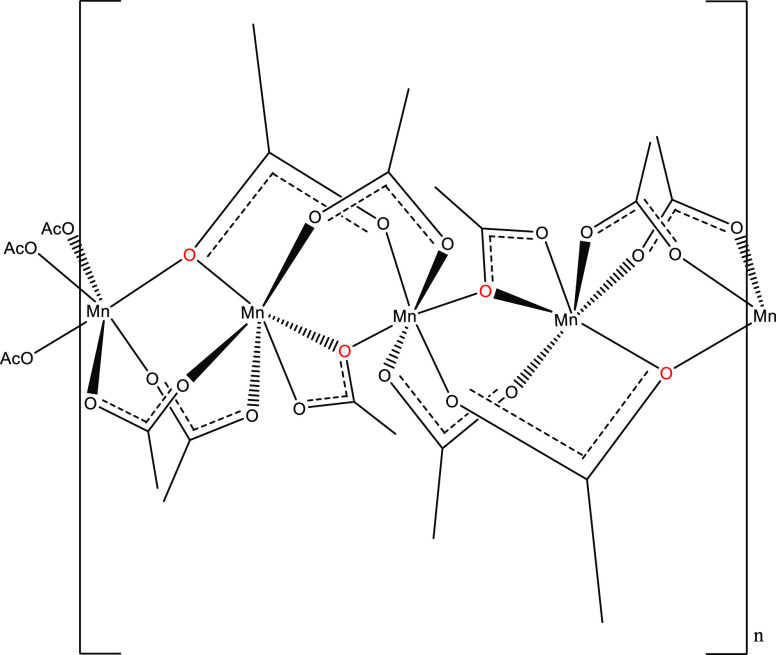
Compound II, Mn4(OAc)10[EMIM]2·2H2O, can be considered a dihydrate of compound I and bears major topological and structural similarities to the latter. Like in the case of compound I, in the dihydrate version there are 3 symmetry independent Mn cations, this time arranged as Mn1, Mn2, and Mn3; however, the space group symmetry is reduced to P1̅. As shown in Figure 5, all of the Mn2+ cations are again six-coordinated, and six donor atoms are oxygens contributed by acetate ions. Mn1 is coordinated by 6 acetates. Four (2 × C8 and 2 × C13) acetates are bidentate μ2-1,3 bridging to Mn3. The remaining two C6 acetates are μ3-1,3,3 bridging to Mn2 and bridging to plus chelating Mn3 with two bonds. Mn2 is located on an inversion center and is coordinated by 6 acetates. Four of these acetates (2 × C2 and 2 × C4) are μ2-1,3 bridging to Mn3, whereas the other two (2 × C6) are μ3-1,3,3 bridging to Mn1 and bridging to plus chelating Mn3 with two bonds. Mn3 is coordinated by 5 acetates. Two acetates (C2 and C4) are μ2-1,3 bridging to Mn2, another two acetates (C8 and C13) are μ2-1,3 bridging to Mn1, whereas the last acetate (C15) bridges μ3-1,3,3 to Mn1 and Mn2 and chelates Mn3 with two bonds (Figures 6 and 7).
Figure 5.
Schematic representation of the molecular structure and conformation of the chain of interconnected, hexacoordinated Mn2+ cations in compound II. All of the coordinating ligands are acetate ions. Bridging oxygen atoms, bonded to two different Mn2+ cations are marked with red color.
Figure 6.
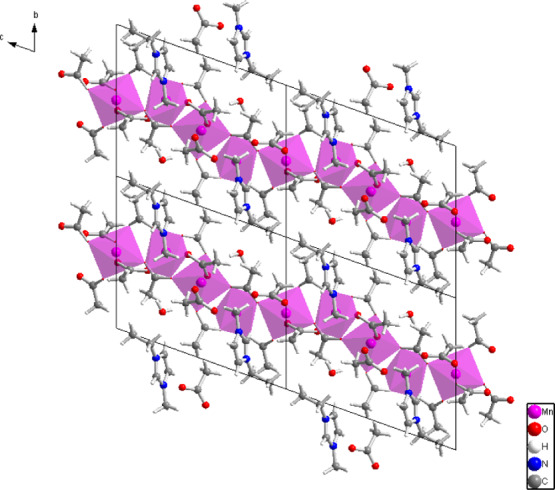
General organization of the crystal structure of compound II viewed along the (100) crystallographic direction. The purple polyhedra represent Mn2+ coordination environments. The chains of interconnected coordination polyhedra extend along the (001) direction.
Figure 7.
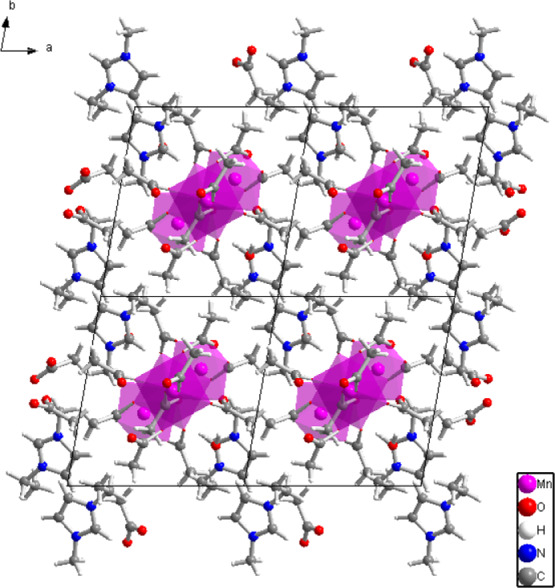
Arrangement of structural elements of compound II viewed along the chain propagation direction (001).
As shown in Figure 8, similar to compound I, neither the EMIM moieties nor the water molecules in compound II are participating in the coordination of the Mn cations, but they are hydrogen-bonded to the acetates. The water molecule (O1) is an acceptor of the C–H···O hydrogen bond from the C12 EMIM aromatic carbon and is a donor of hydrogen bonds to three neighboring acetate oxygens. The EMIM moiety is hydrogen bonded to eight acetate ions and one water molecule. Just like in the case of compound I, the terminal methyl group of the longer EMIM side chain (C16) is hydrophobic and does not participate in hydrogen bonds. The geometric parameters of hydrogen bonds for compound II are reported in Supporting Information Table S2. Because the presence of the water molecule affects the arrangement of hydrogen bonds, the cavities surrounded by hydrophobic groups are not as apparent as in compound I. The automated search for structural cavities in the compound II crystal structure, performed with the CrystalMaker program, located the center of the structural void at fractional atomic coordinates (0.0.0368, 0.0439, 0.5279) and estimated the void radius at 2.335 Å, with a void volume of only 53.3097 Å3. As a consequence, the density of compound II, 1.496 g/cm3, is 4.3% higher than the density of compound I, 1.434 g/cm3, suggesting that the anhydrous compound should have better absorption properties.
Figure 8.
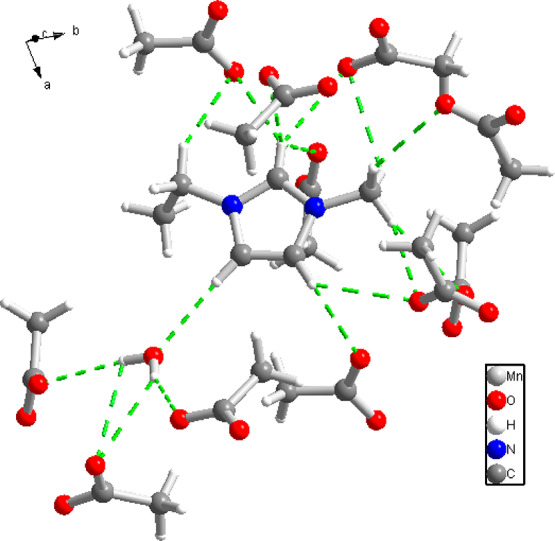
Hydrogen bond interactions (green dash lines) of the EMIM moiety, water molecule, and acetate anions in compound II. One of the EMIM aromatic hydrogens is connected via a hydrogen bond to an acetate oxygen, another is a hydrogen bond donor to the water molecule.
The topologic arrangement of structural elements in compounds I and II is related to that in [EMIM][OAc]Cu(II) acetate/chloride,14 in which the metal cations are also organized in infinite polymeric chains (complexes 2 and 3), while disordered EMIM and water molecules are present in the regions between the polyanionic chains, though in the latter there is a clustering of Cu ions involving Cu–Cu bonding, which is not observed in Mn-based compounds.
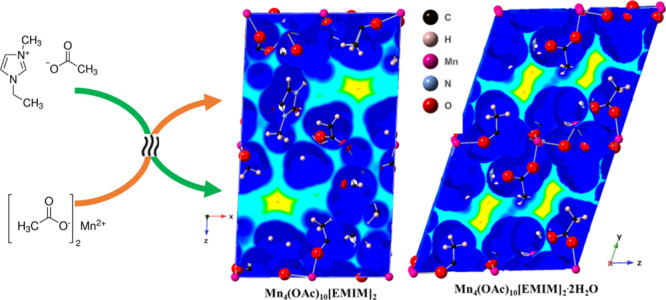
Both of the synthesized ionic salts feature void spaces in their crystal structures, which are shown in Figure 9. These voids may enable easy passage and binding of molecules, such as small gaseous contaminants (sulfur dioxide and hydrogen sulfide), into the bulk of the material, making this class of compounds potentially applicable to the separation and purification of small molecules. The structural arrangement represented by the two title compounds is robust in terms of accommodating other types of cations and allows for tuning of physical properties of the ionic liquid by means of cation substitution. The precise tuning of the void space size and shape by the careful selection of metal ions, ionic liquid cations, and anion alkyl groups could result in selective and fast absorption of small molecules.
Figure 9.
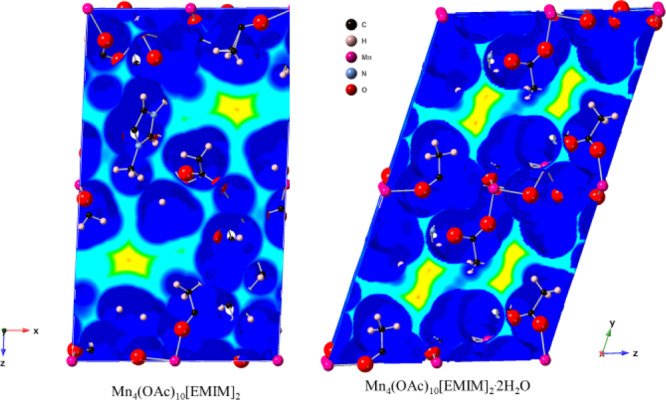
Van der Waals distance maps for compound I (Mn4(OAc)10[EMIM]2) and compound II (Mn4(OAc)10[EMIM]2·2H2O) showing a structural void space available for absorption.
2.1.3. Powder X-ray Diffraction Analysis
Dry, as-synthesized sample powder was analyzed using bulk powder diffraction and Bruker TOPAS 5 software. Rietveld refinement was performed using models of the structures of compounds I and II, as determined in single crystal experiments. During the refinement the atomic coordinates, site occupancies and atomic displacement parameters were kept fixed, whereas the phase fractions and unit cell parameters were optimized. A 30th order Chebyshev polynomial was used to model the background. Because the sample was not ground to a fine powder, we used a 4th order spherical harmonic model to account for the preferred orientation for both phases. The Rietveld refinement converged to a final figure-of-merit Rwp = 2.767%, and its results are shown in Figure 10. The sample was found to contain 84.88 wt % of compound I and 15.15 wt % of compound II. No other crystalline phases were identified.
Figure 10.
Results of Rietveld refinement of the bulk powder X-ray diffraction (XRD) pattern of the synthetic sample containing compounds I and II. Broad peak at 2θ = 20° is from the sample container. The bottom curve shows the difference between the observed and calculated intensities. Tick marks below the difference curve indicate peak positions for compound I and compound II.
2.2. Thermal Analyses
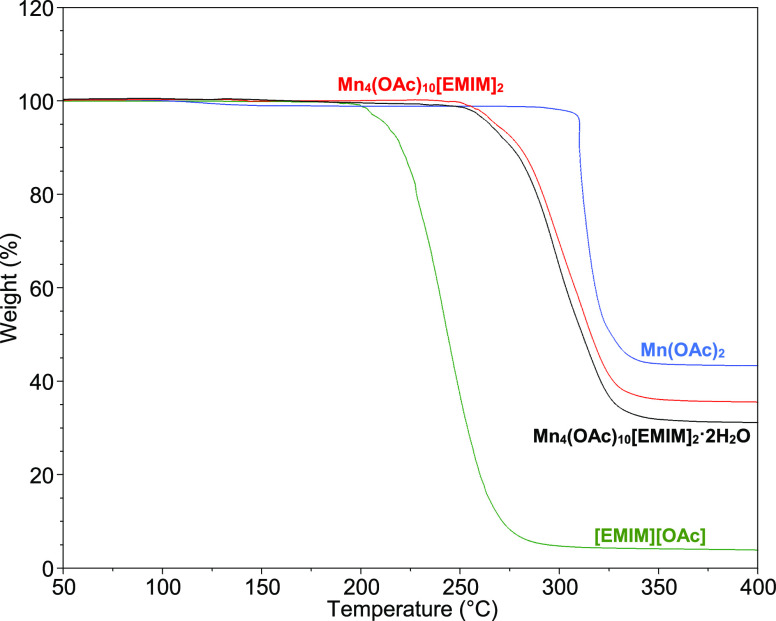
Comparison of the thermogravimetric analysis (TGA) and differential scanning calorimetry (DSC) spectra of products of syntheses of compounds I and II with that of pure [EMIM][OAc] and pure manganese acetate confirms the formation of new products. The TGA spectra of [EMIM][OAc] is observed to have a mass loss of about 96% around 250 °C corresponding to the decomposition of the ionic liquid, while manganese acetate is seen to decompose in a single step at 320 °C with about 55% mass loss. A small mass loss is observed in TGA spectra of compounds I and II around 260 °C, with a majority of the compounds decomposing at 300–320 °C for a total weight loss of 65–69%, as shown in Figure 11. The similarity in the decomposition profile of both compounds confirms their structural resemblance. The double cationic compounds (I and II) have higher thermal stability compared to the [EMIM][OAc] ionic liquid. The higher thermal stability can be attributed to the increased ionic bonding and lattice ordering in I and II compared to [EMIM][OAc], which enhances lattice energy. It can be anticipated that further altering of the metal ion charge, size, or type and functional groups on the EMIM cations or anions can result in further tuning of the physical and chemical properties of these compounds, resulting in materials with unique properties for various applications.
Figure 11.
TGA analyses at 10 °C/min under an argon flow of [EMIM][OAc] (green line), Mn(OAc)2 (blue line), compound I Mn4(OAc)10[EMIM]2 (red line), and compound II Mn4(OAc)10[EMIM]2·2H2O] (black line).
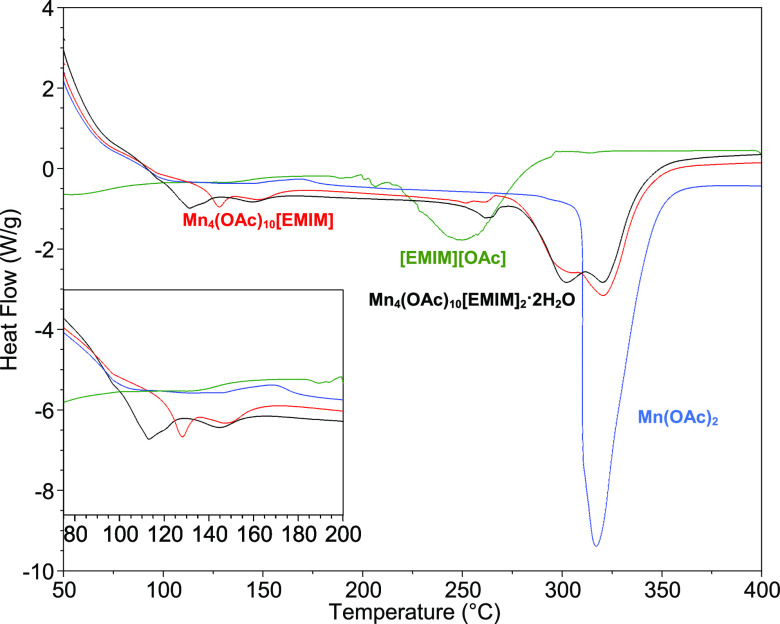
As shown in Figure 12, the DSC spectra of compound I shows an endothermic peak at 127 °C, which is attributed to melting. The spectra of II show an endothermic peak at 113 °C with a shoulder at around 120 °C, which are attributed to the loss of the bound water followed by the melting of the compound. The solid to liquid transformation of compounds I and II was visually confirmed using a SRS Digimelt apparatus, which shows both compounds melting in the temperature range of 120–130 °C. Endothermic peaks are also observed at around 260 °C in both compounds. The endothermic peaks at 301 and 321 °C are attributable to the multi-step decomposition of I and II. The decomposition plausibly proceeds through the formation of manganese acetate species, which concomitantly decomposes at higher temperatures, as observed for pure manganese acetate.
Figure 12.
DSC at 10 °C/min under an argon flow of [EMIM][OAc] (green line), Mn(OAc)2 (blue line), compound I Mn4(OAc)10[EMIM]2 (red line), and compound II [Mn4(OAc)10[EMIM]2·2H2O] (black line).
2.3. Vibrational Spectroscopy
The infrared (IR) frequency modes of [EMIM][OAc] have been assigned from the literature.19,20 Particularly, the interaction between the anion and the cation is shown by the following frequencies: 630 cm–1 (OCO bending + CC stretching), 896 cm–1 (OCO bending + CC stretching), 995 and 1035 cm–1 (CH3 bending), 1322 cm–1 (symmetric CO stretching), 1373 and 1425 cm–1 (CH3 bending), 1567 cm–1 (antisymmetric CO stretching), 702 cm–1 (in plane ring deformation + CEtN stretching + CMeN stretching), and 1171 cm–1 (In plane CImH bending).
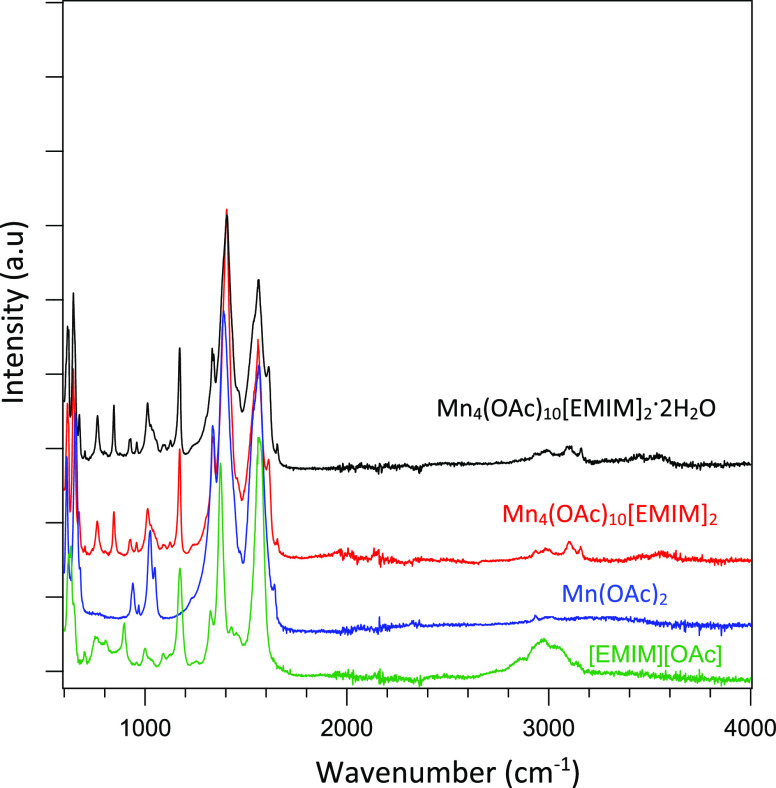
The room-temperature IR of Mn(OAc)2, as shown in Figure 13, has two strong carboxylate modes at 1388 and 1566 cm–1, which suggests a bridging connection in the solid state: Mn–O–C(CH3)–O–Mn (i.e., the acetate connects 2 Mn2+ ions).21−24 Compound I, Mn4(OAc)10[EMIM]2 (red spectrum), and compound II, Mn4(OAc)10[EMIM]2·2H2O (black spectrum), show similar behavior in-line with the XRD results. The presence of the [EMIM]+ cation is displayed by the peaks at 1170 and 1010 cm–1. Two new sharp bands at 844 and 761 cm–1 appear. According to the theoretical decomposition of the IR spectrum of [EMIM][OAc], most of the spectral intensities below 1000 cm–1 arise from the acetate ion.20 It is therefore possible that these two sharp bands are characteristic for the new Mn–acetate chains. It is interesting to note in this context that the molecular magnet Mn12acetate presents several sharp IR bands around 700 cm–1.25 Moreover, the peaks at 1639, 1559, 1387, 1333, 652, and 608 cm–1 can be assigned to the acetate modes. It is remarkable that the IR spectra of the hydrated sample do not show very strong IR bands for the water molecule and are basically similar to those of the water-free sample. This may be attributed to the samples stored in glovebox.
Figure 13.
Comparison of FTIR spectra of the [EMIM][OAc] (green line), Mn(OAc)2 (blue line), compound I Mn4(OAc)10[EMIM]2 (red line), and compound I Mn4(OAc)10[EMIM]2·2H2O (black line). All spectra were collected at 30 °C.
Variable temperature Fourier transform infrared (FTIR) was performed by heating compounds I and II from 30 to 280 °C with a step of 10 °C, Figure 14. Then, the samples were cooled down to 30 °C in order to collect the IR spectrum. The [Mn4(OAc)10[EMIM]2] sample, as shown in Figure 14a, shows some phase transitions while heating. At 120 °C, the doublet at 671 cm–1 is convoluted in one peak. The two peaks at 763 and 844 cm–1 disappear at 160 °C. The two peaks at 925 and 957 cm–1 become one peak at 160 °C, which is still present after cooling the sample. Interestingly, the frequency at 1174 cm–1 is shifted at 1158 cm–1 when the temperature is 120 °C. The latter is shifted at 1166 cm–1 at 160 °C. The signals at 1336, 1405, and 1558 cm–1 are broader at 160 °C. Further, the peak at 1611 cm–1 disappears at 160 °C. The phase transitions do not look reversible while cooling the sample down, which may indicate that at around 120–140 °C the Mn–acetate chain structure breaks apart. For [Mn4(OAc)10[EMIM]2·2H2O], Figure 14b displays a weak O–H stretching vibration of water around 3500 cm–1, which disappears upon heating the sample at 100 °C. Besides this feature, the FTIR spectra are similar to that of the water-free sample eluding to the similarity in structure of the two compounds that is observed by XRD.
Figure 14.
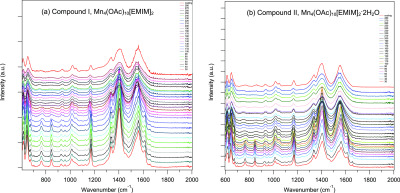
In situ high-temperature FTIR of (a) compound I, Mn4(OAc)10[EMIM]2, and (b) compound II, Mn4(OAc)10[EMIM]2·2H2O.
3. Conclusions
In this work, we have synthesized, characterized, and determined the crystal structures of two new manganese(II) aceto EMIM coordination compounds. The two compounds have empirical formulas Mn4(OAc)10[EMIM]2 and Mn4(OAc)10[EMIM]2·2H2O. These compounds have unique extended chains of Mn2+ octahedrally coordinated exclusively by acetate anions, which has been observed for the first time. The EMIM moieties and water molecules participate in hydrogen bonding with acetate anions but do not directly interact with the metal cation. Both compounds have melting temperatures around 120 °C and can be considered as (non-room-temperature) ionic liquids. The structural arrangement represented by the two title compounds is robust in terms of accommodating other types of cations and allows for tuning of the physical properties of the ionic liquid by means of cation substitution. Thermal analysis results obtained using TGA–DSC and VT IR suggest melting phase transitions at around 120 °C, followed by the structural rearrangement in the molten state taking place around 140–160 °C.
4. Experimental Section
4.1. Materials
The ionic liquid, 1-ethyl-3-methylimidazolium acetate, and 97% ([EMIM][OAc]) were purchased from Sigma-Aldrich. Anhydrous manganese acetate, 98%, was purchased from Alfa Aesar. The ionic liquid was vacuum dried at 90 °C for 12 h prior to use. All chemicals were stored in an inert nitrogen atmosphere glovebox.
4.2. Synthesis Procedure
The manganese imidazolium acetate compounds were synthesized using a solid-state green synthesis approach. In short, the ionic liquid, 1-ethyl-3-methylimidazolium acetate (0.44 g, 2.6 mmol) was added to a 10 mL glass tube followed by addition of manganese II acetate (0.91 g, 5.2 mmol), ensuring a 2:1 molar ratio of manganese acetate to ionic liquid. The mixture was heated to 110 °C with stirring for about 3 h under an inert nitrogen atmosphere followed by slow cooling of the viscous pink liquid product to room temperature. The solid product was stored in an inert atmosphere glovebox. Alteration of the ionic liquid and manganese acetate ratios resulted in the same product being formed. The synthesized pink-light brown solid products were placed in glass capillaries, which were then sealed with vacuum grease under a nitrogen atmosphere and transferred to the XRD instrument for single crystal measurements. The use of two different lots of anhydrous manganese acetate in two separate synthesis runs resulted in two slightly different solid product compounds, which will be referred to as compound I and compound II. The formation of the hydrated product, compound II, is attributed to the inadvertent exposure of the manganese acetate reactant to moisture prior to reactions. No manganese acetate reactant phases were detected in synthesized products, suggesting an almost complete conversion of reactants to products. The chemical formulas of these compounds, as determined from single crystal XRD experiments, were C16H26Mn2N2O10 and C16H30Mn2N2O12, respectively, which can be expressed in simplified forms as Mn4(OAc)10[EMIM]2 and Mn4(OAc)10[EMIM]2·2H2O.
We also obtained preliminary results regarding the synthesis of Fe, Mg, and Zn based analogues of the title compounds, which will be reported in separate publications.
4.3. XRD
4.3.1. Compound I
A small amount of the translucent, light-brown coarse-grained solid was loaded into a glass capillary with 0.5 mm diameter and filled with N2 gas. Oxford Cryostream 800+ was used to cool the sample down to 100 K in a stream of liquid N2. For the single crystal XRD analysis, an irregular blocky crystal of compound I, approximately 0.050 mm × 0.050 mm × 0.050 mm in size, was located in the capillary and positioned at the center of the goniometer. The X-ray intensity data were measured on a Bruker D8 Venture diffractometer with an Incoatec IμS 3.0 Ag Kα source (λ = 0.56086 Å) and Helios focusing optics. The diffractometer was equipped with a 3-circle, fixed-chi goniometer and Photon II detector. The total exposure time for the data collection was 2 h. The diffraction images were integrated with the Bruker SAINT software package using a narrow-frame algorithm. The integration of the data using a monoclinic unit cell yielded a total of 19549 reflections to a maximum θ angle of 20.02° (0.82 Å resolution), of which 3645 were independent (average redundancy 5.363, completeness = 80.1%, Rint = 5.95%, Rsig = 4.65%) and 2961 (81.23%) were greater than 2σ(F2). The limited completeness of the data was a consequence of restricted rotations of the sample mounted in a long capillary and difficulty with centering the sample, surrounded by other crystals inside the capillary. The final unit cell constants of a = 12.2690(8) Å, b = 9.2890(7) Å, c = 21.0005(16) Å, β = 92.724(2)°, and V = 2390.7(3) Å3 are based upon the refinement of the XYZ-centroids of 5667 reflections above 20 σ(I) with 4.563° < 2θ < 38.53°. Data were corrected for absorption effects using the Multi-Scan method (SADABS). The ratio of minimum to maximum apparent transmission was 0.911. The calculated minimum and maximum transmission coefficients (based on crystal size) were 0.6779 and 0.7444. The crystal structure of compound I was solved using the dual-space method, as implemented in the program ShelXT, assuming Z = 4. Hydrogen atoms missing in the initial model from the structure solution were found from difference Fourier maps. The final anisotropic full-matrix least-squares refinement on F2 with 292 variables converged to R1 = 5.32%, for the observed data and wR2 = 10.96% for all data. The goodness-of-fit was 1.117. The largest peak in the final difference electron density synthesis was 0.647 e–/Å3 and the largest hole was −0.458 e–/Å3 with an rms deviation of 0.084 e–/Å3. On the basis of the final model, the calculated density was 1.434 g/cm3 and F(000), 1064 e–.
In one of the acetate ions, a disorder of the methyl group has been observed, resulting in the splitting of the C16 carbon position and accompanying hydrogens into two positions, C16A and C16B, with approximately equal occupancies.
Constraints AFIX 137 were used to refine idealized riding hydrogen positions in methyl groups associated with EMIM moiety carbon atoms C1 and C6 and acetate carbon atoms C7, C9, C11, C13, and C16 (disordered between C16A and C16B). Hydrogen atoms connected to C2, C3, and C4, the three aromatic carbons of the EMIM moiety, were refined with AFIX 43 constraints, as idealized riding aromatic C–H. Hydrogen atoms connected to the C5 atom of the EMIM moiety were also refined using constrains with AFIX 23, as idealized riding secondary CH2.
Details of the crystallographic refinement statistics, relevant structural parameters, and selected bond length and angles for compound II are included in Supporting Information, Tables S3–S6.
4.3.2. Compound II
Following a procedure similar to that used for compound I, a translucent, light-brown irregular blocky crystal of compound II was located inside another capillary filled with a small amount of sample solid and nitrogen gas and was measured on the same instrument as compound I, but at ambient temperature (300 K). The total exposure time was also 2 h. The data analysis procedure was the same as described above, but this time revealed a triclinic symmetry. The integration of the data yielded a total of 9856 reflections to a maximum θ angle of 20.06° (0.82 Å resolution), of which 3232 were independent (average redundancy 3.050, completeness = 71.1%, Rint = 7.70%, Rsig = 8.51%) and 2065 (63.89%) were greater than 2σ(F2). The final unit cell constants of a = 9.362(2) Å, b = 10.820(3) Å, c = 12.659(3) Å, α = 70.170(5)°, β = 87.581(5)°, γ = 79.631(6)°, and volume = 1186.3(5) Å3 are based upon the refinement of the XYZ-centroids of 2934 reflections above 20 σ(I) with 4.456° < 2θ < 38.92°. The ratio of minimum to maximum apparent transmission was 0.702. The calculated minimum and maximum transmission coefficients (based on crystal size) are 0.5227 and 0.7445.
The crystal structure of compound II was also solved and refined using the Bruker SHELXTL software package, in space group P1̅, with Z = 2 for the formula unit, C16H30Mn2N2O12. The final anisotropic full-matrix least-squares refinement on F2 with 296 variables converged at R1 = 6.61%, for the observed data and wR2 = 17.70% for all data. The goodness-of-fit was 1.029. The largest peak in the final difference electron density synthesis was 0.600 e–/Å3 and the largest hole was −0.390 e–/Å3 with an rms deviation of 0.094 e–/Å3. On the basis of the final model, the calculated density was 1.496 g/cm3 and F(000), 552 e–.
Constraints AFIX 137 were used to refine idealized riding hydrogen positions in methyl groups associated with the EMIM moiety carbon atoms C9 and C16 and acetate carbon atoms C1, C3, C5, C7, and C14. Hydrogen atoms connected to C10, C11, and C12, the three aromatic carbons of the EMIM moiety, were refined with AFIX 43 constraints, as idealized riding aromatic C–H. Hydrogen atoms connected to the C15 atom of the EMIM moiety were also refined using constrains with AFIX 23, as idealized riding secondary CH2.
Details of the crystallographic refinement statistics, relevant structural parameters, and selected bond length and angles for compound II are included in Supporting Information, Tables S7–S10.
4.3.3. Powder XRD
In order to constrain the yield and purity of the synthesis of the two new compounds a powder XRD analysis was performed on the dry as-synthesized powder. Sample loading into an airtight domed sample container with a zero-background Si wafer plate was performed inside a glovebox. Diffraction measurements were conducted using a Bruker D8 ADVANCE diffractometer equipped with a LynxEye XE detector and Cu Kα X-ray source operating at 40 keV and 40 mA at the University of Hawai’i X-ray Atlas lab. Data acquisition was performed over the angular range from 5 to 80o, with a step of 0.01o and acquisition time of 2 s per step. During the data collection, the sample was rotated at an angular speed of 15 revolutions per minute.
4.4. Thermal Analyses
TGA and DSC of the reactants and synthesized manganese aceto EMIM ionic compounds were performed using a TA Instruments Q600 SDT, and employing a temperature ramp of 10 °C/min and argon flow of 100 mL/min up to 600 °C.
4.5. Vibrational Spectroscopy
FTIR experiments were performed with a Biorad Excalibur Instrument equipped with a portable Specac Golden Gate heatable ATR setup allowing to prepare samples in the glovebox. IR spectra were recorded with a spectral resolution of 2 cm–1, with 30 scans in the range 600–4000 cm–1. The samples were heated up from 30 to 280 °C with a step of 10 °C. Then, the IR was collected after cooling down the samples at 30 °C.
Acknowledgments
The authors greatly appreciate financial support through the University of Hawai’i Materials Science Consortium for Research and Education (MSCoRE) and the Asia Pacific Research Initiative for Sustainable Energy Systems (APRISES) 2014 (award no. N00014-15-1-0028) and 2016 (award no. N00014-17-1-2206). The XRD work was conducted using the X-ray Atlas instrument at the University of Hawai’i, supported by NSF grant 1541516. This work was also supported in part by the Swiss National Science Foundation (project 200020-182494).
Supporting Information Available
The Supporting Information is available free of charge at https://pubs.acs.org/doi/10.1021/acsomega.0c01820.
The authors declare no competing financial interest.
Supplementary Material
References
- Wasserscheid P.; Welton T.. Ionic liquids in synthesis; Wiley-VCH Verlag: Weinheim, 2003. [Google Scholar]
- Kirchner B.Topics in current chemistry; Springer-Verlag new york, 2009; Vol. 290, p 40. [Google Scholar]
- Lei Z.; Dai C.; Chen B. Gas Solubility in Ionic Liquids. Chem. Rev. 2013, 114, 1289–1326. 10.1021/cr300497a. [DOI] [PubMed] [Google Scholar]
- MacFarlane D. R.; Tachikawa N.; Forsyth M.; Pringle J. M.; Howlett P. C.; Elliott G. D.; Davis J. H.; Watanabe M.; Simon P.; Angell C. A. Energy applications of ionic liquids. Energy Environ. Sci. 2014, 7, 232–250. 10.1039/c3ee42099j. [DOI] [Google Scholar]
- Smiglak M.; Pringle J. M.; Lu X.; Han L.; Zhang S.; Gao H.; MacFarlane D. R.; Rogers R. D. Ionic liquids for energy, materials, and medicine. Chem. Commun. 2014, 50, 9228–9250. 10.1039/c4cc02021a. [DOI] [PubMed] [Google Scholar]
- Rogers R. D.; Seddon K. R. Ionic Liquids--Solvents of the Future?. Science 2003, 302, 792–793. 10.1126/science.1090313. [DOI] [PubMed] [Google Scholar]
- Ghandi K. A Review of Ionic Liquids, Their Limits and Applications. Green Sustain. Chem. 2014, 04, 44–53. 10.4236/gsc.2014.41008. [DOI] [Google Scholar]
- Irge D. D. Ionic Liquids: A Review on Greener Chemistry Applications, Quality Ionic Liquid Synthesis and Economical Viability in a Chemical Processes. Am. J. Phys. Chem. 2016, 5, 74–79. 10.11648/j.ajpc.20160503.14. [DOI] [Google Scholar]
- Meng T.; Young K.-H.; Wong D. F.; Nei J. Ionic Liquid-Based Non-Aqueous Electrolytes for Nickel/Metal Hydride Batteries. Batteries 2017, 3, 4. 10.3390/batteries3010004. [DOI] [Google Scholar]
- Severa G.; Bethune K.; Rocheleau R.; Higgins S. SO2 sorption by activated carbon supported ionic liquids under simulated atmospheric conditions. Chem. Eng. J. 2015, 265, 249–258. 10.1016/j.cej.2014.12.051. [DOI] [Google Scholar]
- Froschauer C.; Weber H. K.; Röder T.; Sixta H.; Laus G.; Lendl B.; Schottenberger H. No Matter of Course: Ionic Liquids as SO2-Selective Gas Absorbers. Lenzinger Ber. 2013, 91, 30–43. [Google Scholar]
- Bowron D. T.; D’Agostino C.; Gladden L. F.; Hardacre C.; Holbrey J. D.; Lagunas M. C.; McGregor J.; Mantle M. D.; Mullan C. L.; Youngs T. G. A. Structure and Dynamics of 1-Ethyl-3-methylimidazolium Acetate via Molecular Dynamics and Neutron Diffraction. J. Phys. Chem. B 2010, 114, 7760–7768. 10.1021/jp102180q. [DOI] [PubMed] [Google Scholar]
- Oliveira F. S.; Cabrita E. J.; Todorovic S.; Bernardes C. E. S.; Canongia Lopes J. N.; Hodgson J. L.; MacFarlane D. R.; Rebelo L. P. N.; Marrucho I. M. Mixtures of the 1-ethyl-3-methylimidazolium acetate ionic liquid with different inorganic salts: insights into their interactions. Phys. Chem. Chem. Phys. 2016, 18, 2756–2766. 10.1039/c5cp06937h. [DOI] [PubMed] [Google Scholar]
- Serov N. Y.; Shtyrlin V. G.; Islamov D. R.; Kataeva O. N.; Krivolapov D. B. Structure of copper(II) complexes grown from ionic liquids – 1-ethyl-3-methylimidazolium acetate or chloride. Acta Crystallogr., Sect. E: Crystallogr. Commun. 2018, 74, 981–986. 10.1107/s2056989018008538. [DOI] [PMC free article] [PubMed] [Google Scholar]
- Lynch W.; Lynch G.; Sheriff K.; Padgett C. Structures of substituted pyridine N-oxide with manganese(II) acetate. Acta Crystallogr., Sect. E: Crystallogr. Commun. 2018, 74, 1405–1410. 10.1107/s205698901801232x. [DOI] [PMC free article] [PubMed] [Google Scholar]
- Hessel L. W.; Romers C. The crystal structure of “anhydrous manganic acetate”. Recl. Trav. Chim. Pays-Bas 2010, 88, 545–552. 10.1002/recl.19690880505. [DOI] [Google Scholar]
- Cheng C. Y.; Wang S. L. Structure of manganese acetate dihydrate. Acta Crystallogr. C 1991, 47, 1734–1736. 10.1107/s0108270191002202. [DOI] [Google Scholar]
- Bertaut E. F.; Tran Qui D.; Burlet P.; Burlet P.; Thomas M.; Moreau J. M. Crystal structure of manganese acetate tetrahydrate. Acta Crystallogr. B 1974, 30, 2234–2236. 10.1107/s0567740874006807. [DOI] [Google Scholar]
- Dhumal N. R.; Kim H. J.; Kiefer J. Molecular Interactions in 1-Ethyl-3-methylimidazolium Acetate Ion Pair: A Density Functional Study. J. Phys. Chem. A 2009, 113, 10397–10404. 10.1021/jp907394v. [DOI] [PubMed] [Google Scholar]
- Thomas M.; Brehm M.; Hollóczki O.; Kelemen Z.; Nyulászi L.; Pasinszki T.; Kirchner B. Simulating the vibrational spectra of ionic liquid systems: 1-Ethyl-3-methylimidazolium acetate and its mixtures. J. Chem. Phys. 2014, 141, 024510. 10.1063/1.4887082. [DOI] [PubMed] [Google Scholar]
- Nakamoto K.Infrared and Raman Spectra of Inorganic and Coordination Compounds, Part A: Theory and Applications in Inorganic Chemistry, 6th ed.; John Wiley and Sons, 2009. [Google Scholar]
- Alcock N. W.; Tracy V. M.; Waddington T. C. Acetates and acetato-complexes. Part 2. Spectroscopic studies. J. Chem. Soc., Dalton Trans. 1976, 2243–2246. 10.1039/dt9760002243. [DOI] [Google Scholar]
- Deacon G.; Phillips R. J. Relationships between the carbon-oxygen stretching frequencies of carboxylato complexes and the type of carboxylate coordination. Coord. Chem. Rev. 1980, 33, 227–250. 10.1016/s0010-8545(00)80455-5. [DOI] [Google Scholar]
- Ito K.; Bernstein H. J. The vibrational spectra of the formate, acetate, and oxalate ions. Can. J. Chem. 1956, 34, 170–178. 10.1139/v56-021. [DOI] [Google Scholar]
- Oppenheimer S. M.; Sushkov A. B.; Musfeldt J. L.; Achey R. M.; Dalal N. S. Diffuse optical excitations in Mn12-acetate. Phys. Rev. B: Condens. Matter Mater. Phys. 2002, 65, 054419. 10.1103/physrevb.65.054419. [DOI] [Google Scholar]
Associated Data
This section collects any data citations, data availability statements, or supplementary materials included in this article.


