Abstract
Chronic obstructive pulmonary disease (COPD) is a leading cause of disability and death of adults in the USA and worldwide. While environmental factors such as smoking and air pollution are major contributors to COPD, pediatric respiratory disease and more specifically early childhood wheezing are frequent predisposing factors. It is therefore possible that aggressive prevention and treatment of childhood respiratory illness may modify adult COPD risk. This article reviews some of the physiological factors that may explain the pediatric origins of childhood lung disease. One such factor is the “tracking” of normal lung function which occurs with growth. The maximal expiratory flow volume (MEFV) curve is an ideally suited tool to monitor tracking of airway function over the lifespan, as its relative effort independence makes it highly reliable. Study of the MEFV curve has demonstrated that individuals with similar lung volumes can have large differences in maximal flows, reflecting a disconnection between airway and lung growth (“dysanapsis”). Less than average airway size due to dysanaptic airway growth or airway remodeling may be independent risk factors for the development of COPD and the asthma/COPD overlap syndrome in adult life. There are intriguing early data suggesting that perhaps at least some of this risk is modifiable by improving asthma control with inhaled corticosteroids and minimizing asthma exacerbations.
Keywords: Airway remodeling, Asthma, Asthma/COPD overlap syndrome, Childhood origins, Chronic obstructive pulmonary disease (COPD), Dysanapsis, equal pressure point, flow limitation, Lung function, Maximal expiratory Flow volume curve, Prevention, tracking, Wavespeed theory
Chronic obstructive pulmonary disease (COPD) is a leading cause of disability and death of adults in the USA and worldwide. While environmental factors such as smoking and air pollution are major contributors to COPD, pediatric respiratory disease and more specifically early childhood wheezing are frequent predisposing factors. It is therefore possible that aggressive prevention and treatment of childhood respiratory illness may modify adult COPD risk. In this article, we will review some of the physiological factors that may explain the pediatric origins of childhood lung disease. We will do so by first briefly reviewing the physiology of forced expiration flows underlying the performance of spirometry, the single most useful tool in tracing the trajectory between pediatric and adult airway disease. We describe an overview of the epidemiology of childhood wheezing, and review the concept of “tracking” of lung function throughout the lifespan. We then discuss two ways in which childhood airway events can affect adult COPD risk: “dysanaptic” growth related to genetics, and airway remodeling likely due to environmental factors. We will also discuss how smaller airway size per se could lead to greater asthma symptoms for a given decrease in airway dimensions, and conclude with a discussion of the asthma/COPD overlap syndrome, and the possibility that some of its development may be pharmacologically modifiable.
The physiology of maximal expiratory flow
The maximal expiratory flow volume (MEFV) curve has been used to document the harmful effects of a wide variety of lung insults, e.g., smoking and air pollution. It is a very useful way of tracking lung function throughout the lifespan. One reason it is so useful is that maximal flow (Fmax) is relatively independent of maximal effort, thus making it a highly reproducible test with less than 5% intra‐subject variability from one testing session to another. In order to understand this stability, it is first necessary to consider the physiology underlying the flow volume curve. If a subject performs a series of flow volume curves with gradations of effort, the results will look as illustrated in Figure 1. Eventually the curve will approach an outer “envelope” which is a product of flow “limitation”, meaning that further increases in effort produce no further increases in flow; this flow is considered to be “maximal”.
Figure 1.

A series of flow volume curves with increasing efforts, eventually resulting in flow limitation
There are three common explanations for the presence of flow limitation. The first and simplest states that since the same positive pleural pressure on forced expiration provides both the alveolar driving pressure and the extra‐airway pressure which is tending to collapse the airway, further increases in driving pressure no longer produce further increases in flow (Figure 2).
Figure 2.

Theories of flow limitation 1. Balance between driving pleural pressure and airway collapsing pleural pressure. Pressure units are cmH2O
The second explanation for flow limitation is termed the equal pressure point theory, and is really an expansion of the first explanation. During forced expiratory flow, alveolar pressure, the pressure which is the source of expiratory flow (or “driving pressure”), is actually higher than the surrounding pleural pressure by an amount equal to the elastic recoil pressure of the lungs (Figure 3). In the example shown, pleural pressure is +100 cmH2O, and alveolar driving pressure is +130 cmH2O due to lung elastic recoil pressure (Pel) of +30 cmH2O. As flow is proceeding mouthward down the tracheobronchial tree, pressure gradually diminishes along the tree due to the presence of airways resistance, R, which is the pressure “cost” of flow (F):
| (Equation 1) |
where P2 is the upstream pressure and P1 is the downstream pressure. If mouth pressure is considered the same as atmospheric (0 cmH2O if we are referencing all pressures to atmospheric), there comes a point along the tracheobronchial tree where intra‐airway pressure is equal to pleural pressure. This is known as the “equal pressure point” (EPP).1 Downstream (mouthward) of the equal pressure point, pleural pressure exceeds intra‐airway pressure, and the airway will tend to narrow, limiting flow. There are two important realizations which arise from the equal pressure point theory:
Figure 3.
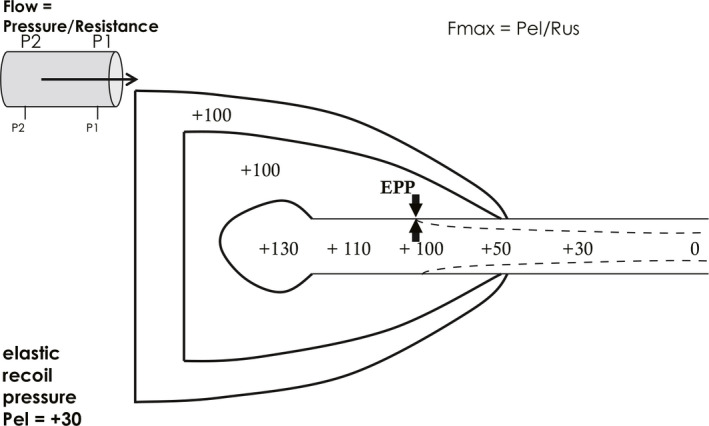
Theories of flow limitation 2. Equal pressure point (EPP) theory. Pressure units are cmH2O. See text
1) If one considers flow the same at any instant down the tracheobronchial tree, one can define the relevant pressure driving maximal flow as alveolar pressure (P2) minus pressure at the EPP (P1), and the relevant resistance as the resistance between the alveolus and the EPP, known as the “upstream” resistance (Rus). In other words, the pressure difference between the alveolus and the intra‐airway EPP is identical to the pressure difference between the alveolus and the pleural space. At the EPP, therefore, maximal flow,
| (Equation 2) |
where Rus is the resistance upstream of the equal pressure point. As lung volume decreases, airways resistance increases because airway size is dependent on lung size. Thus flow decreases monotonically during a forced expiration both because Pel decreases and Rus increases. This explains the characteristic triangular shape of the flow volume curve (Figure 1).
2) One can see that maximal flow is independent of muscle strength from Equation 2. The relevant driving pressure is elastic recoil, Pel, not respiratory muscle pressure.
The third explanation for flow limitation comes from wave speed theory.2 This theory states that the maximal flow any compliant tube like an airway can support is
| (Equation 3) |
where A is tube cross sectional area, dP/dA is tube wall stiffness, and ρ is fluid density.2 Figure 4 illustrates why maximal flow cannot exceed wave speed. Flow can proceed downstream only as fast as pressure information can be transmitted from fluid molecule to molecule upstream. This is termed the wave speed, and applies to gasses as well. In the illustration, if we put all air molecules in motion to the right (fluid speed, v) and accelerate, eventually rightward flow will meet the wave speed, w, at which pressure information can be transmitted upstream from P1 to P2. At this point molecules are stationary, and wave speed limit is reached. This is analogous to the child's toy known as “Adam's Cradle” (Figure 4 inset). The wave speed equation (Equation 3) implies that the more compliant or less stiff (stiffness = dP/dA) the airway wall, as in tracheomalacia, the lower the maximal flow. This is because the driving pressure gets dissipated in expanding the airway wall if it is compliant. It also explains why maximal flow can be increased when breathing gases of low density, e.g., helium/oxygen mixtures.
Figure 4.

Theories of flow limitation 3. Wave speed theory. See text. The inset shows the child's game “Adam's cradle”, in which pressure information is successively transmitted back upstream by each ball transferring momentum to the next. The speed at which this occurs is analogous to a fluid's or gas's wave speed
These three theories of flow limitation can be reconciled if one realizes that flow acceleration occurs just downstream of the equal pressure point because the airway narrows here. Recall that flow is the product of velocity (v) and cross‐sectional area (A):
If flow along the airway is constant, as it must be, and the airway narrows at the EPP, the velocity has to accelerate; it is at this point of gas acceleration that wave speed can be reached (Figure 5). This is called a “choke point”, beyond which no further acceleration is possible.
Figure 5.
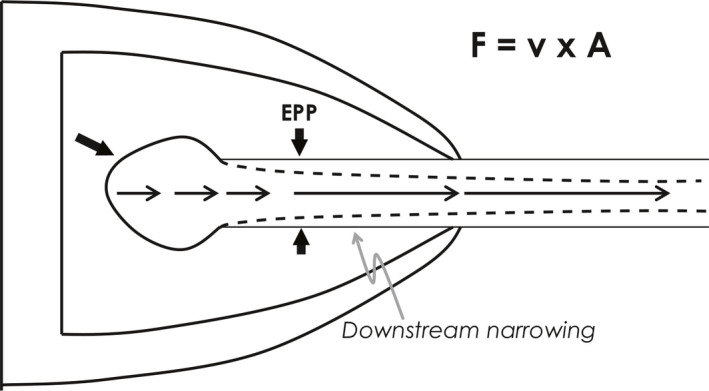
Reconciling Theories 2 and 3. Flow acceleration downstream of the equal pressure point (EPP) results in wave speed limitation
Furthermore, EPP theory helps explain the characteristic shapes of the MEFV curve in airway obstruction of differing locations along the tracheobronchial tree. This is because the EPP is not stationary, but moves from central to peripheral airways during the course of a forced expiration (Figure 6). Comparing Figure 6 to Figure 3, at lower lung volumes, shown in red, the EPP is reached in a more peripheral location than at higher lung volumes. This is because there are more resistive pressure losses upstream of the EPP as described above, because airways are smaller at lower lung volumes, and therefore resistive pressure losses are greater. Thus, since the EPP is the major site of flow limitation, the MEFV curve describes central airway events at high lung volumes and peripheral events at low lung volumes. This gives rise to the typical shapes of the MEFV curve in central and peripheral airway obstruction. Central obstruction such as subglottic stenosis, tracheal tumors or tracheomalacia causes low flows at high lung volumes (Figure 7), whereas peripheral obstruction such as asthma, cystic fibrosis or COPD causes low flows at low lung volumes (Figure 8).
Figure 6.

Peripheral movement of the equal pressure point (EPP) during expiration to a lower lung volume due to a different pressure profile at low lung volumes (red numbers) compare to high lung volumes (black numbers). Pressure units are cmH2O. EPPhi, equal pressure point at higher lung volume; EPPlo, equal pressure point at lower lung volume; Fmax, maximal flow; Pel, elastic recoil pressure; Rus, upstream resistance
Figure 7.
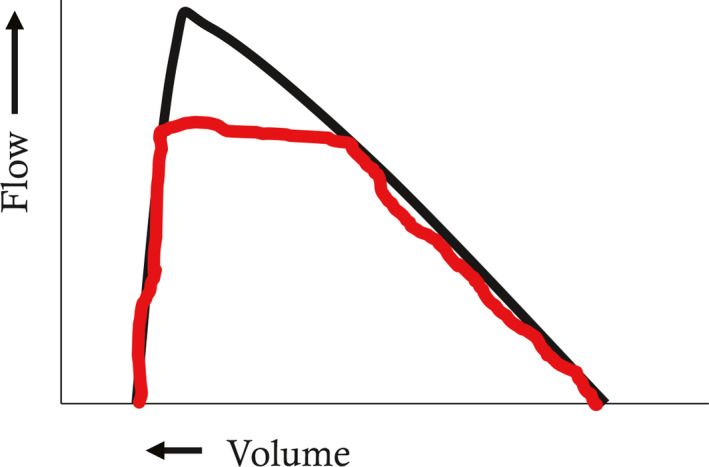
Maximal expiratory flow volume curve in central airway diseases (e.g. subglottic stenosis, tracheomalacia). Flows at high lung volumes reflect central airway events due to the central location of the equal pressure point (EPP). See text
Figure 8.
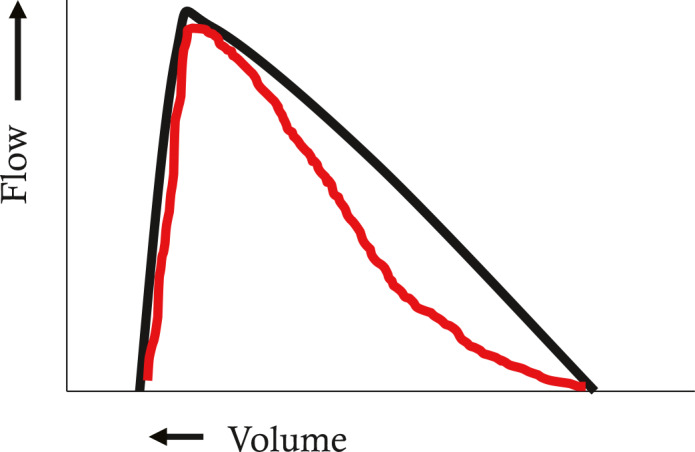
Maximal expiratory flow volume curve in small airway diseases (e.g. asthma, chronic obstructive pulmonary disease, cystic fibrosis, emphysema). Flows at low lung volumes reflect peripheral airway events due to the peripheral location of the equal pressure point (EPP). See text
Tracking of airway function with growth
Just as height and weight increase with growth, so does airway size track from childhood through adolescence and young adulthood (Figure 9).3, 4 Maximal flow rates such as the forced expiratory volume in one second (FEV1) or forced expiratory flow between 25% and 75% expired volume (FEF25–75) are often used to reflect airway size. Tracking of flow rates can be traced back to infancy (Figure 10).5 Ideally, just as with height, if one starts out on a certain percentile of FEV1, one remains there, and doesn't cross percentiles downwards. Downwards crossing of flow percentiles can happen, however, and will be discussed in the context of risk for the development of COPD. Since lung volume also increases with growth, a ratio of a flow to a volume is often used to correct for the lung size effect on airway growth. The most commonly used value used for flow is the FEV1, and the most commonly used value for volume is the vital capacity (VC). The FEV1/VC ratio “adjusts” flow rates for changes in lung volume. Thus, most literature on airway growth and/or decline will either use a height adjusted FEV1 or the FEV1/VC ratio. While airway function should track with growth, the FEV1/VC ratio can vary between individuals. In other words, normal subjects with the same vital capacity can have quite different FEV1 (Figure 11A). This variation, first described by Green and Mead,6, 7 has been termed “dysanaptic growth”, that is, an unlinking between airway size and lung size, and is, up to an extent, a normal variation. Such dysanapsis has been shown not only in physiological studies of the MEFV curve,8 but radiographically as well (Figure 11B).9
Figure 9.
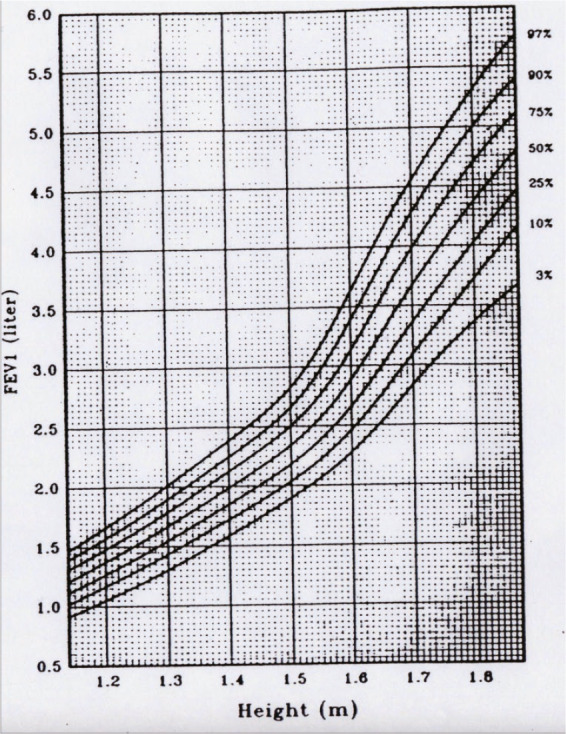
“Tracking” of airway growth, as reflected by forced expiratory volume in one second (FEV 1). (Reprinted with permission from ref. 3 Wang 1993)
Figure 10.
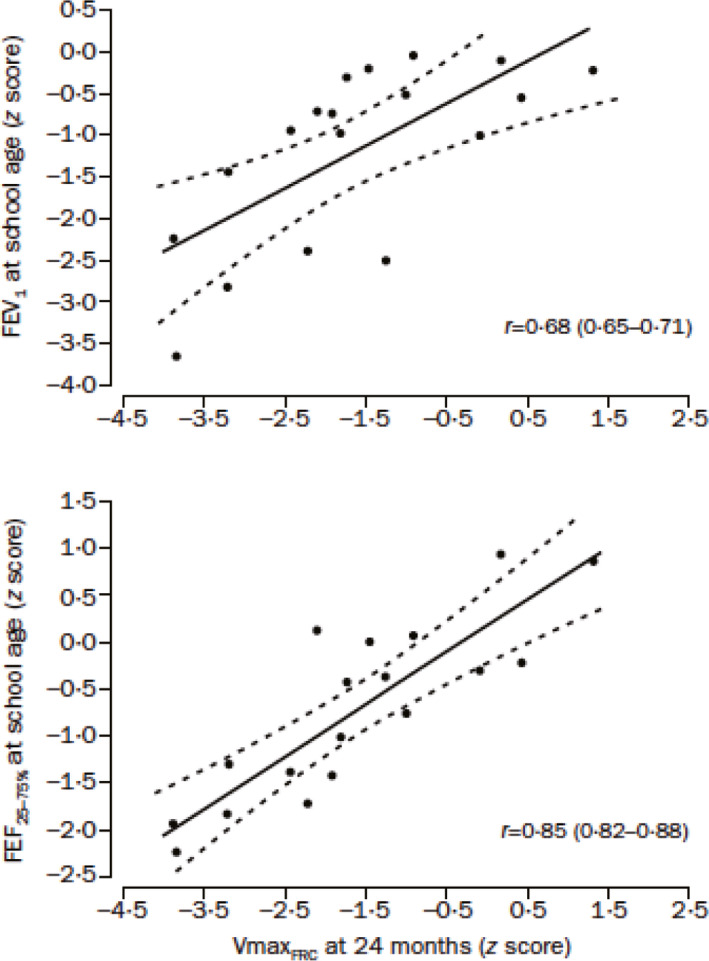
Tracking of airway function extends back to infancy. (Reprinted with permission from ref. 5 Filippone 2003)
Figure 11.

(A) Dysanaptic growth as reflected by adults with identical vital capacities (x‐axis) having widely varying flows (y‐axis). (B) CT evidence of dysanaptic growth, reflected in different airway cross sectional areas in individuals with identical forced vital capacities (FVC). (Reprinted with permission from ref. 9 Sheel 2009)
Risk factors for adult COPD: dysanaptic growth and airway remodeling
Recently it has been suggested that lower height adjusted FEV1 and FEV1/VC ratio may also be a risk factor for COPD. Low FEV1/VC ratio can be genetic or acquired. Dysanaptic growth implies a genetic underpinning for a low FEV1/VC ratio, and, as its name suggests, is probably present from birth and possibly antenatally—there is some evidence that FEV1 at the age of 60 is low in otherwise normal adults who were born full term, but in the lowest quintile of birthweight compared to those who were in the highest quintile. Genome wide association studies (GWAS) and gene pathway analysis studies have shown certain gene polymorphisms are associated with lower FEV1/VC ratio.10, 11, 12 Airway remodeling is another way in which height adjusted FEV1 can be lowered, and may be related to both environmental insults such as air pollution and smoking, as well as genetic factors. Airway remodeling is characterized by numerous cell and molecular changes resulting in airway smooth muscle hypertrophy and basement membrane thickening/fibrosis.13, 14
Whatever the mechanism, it has been speculated that four fundamental patterns of airway growth occur: 1) normal growth and normal decline, usually starting after the age of 18 years; 2) normal growth with early decline; 3) reduced growth with normal decline and 4) reduced growth with early decline. While normal growth and early decline rarely lead to pulmonary morbidity (unless excessive as in α‐1‐antitrypsin deficiency), the latter two patterns associated with either reduced growth and normal decline or reduced growth and early decline are thought to be associated with varying degrees of COPD (Figure 12 A and B).15 However accelerated decline in FEV1 is certainly a harbinger of COPD, as demonstrated by Lange et al who described four patterns of decline in FEV1 depending on initial FEV1 and whether COPD was present at final examination. Subjects with COPD had significantly greater rates of FEV1 decline (Figure 13).16
Figure 12.
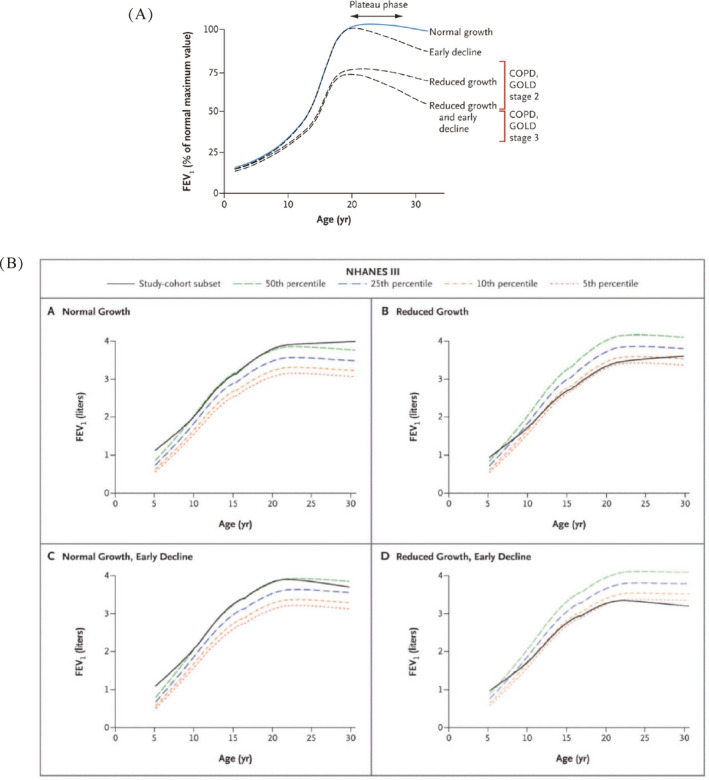
Four patterns of airway growth and decline in normal children and children with asthma. (A) Theoretical patterns and (B) Actual observed patterns. FEV 1, forced expiratory volume in one second; COPD, chronic obstructive pulmonary disease; GOLD, Global Initiative for Chronic Obstructive Lung Disease. (Reprinted with permission from ref. 15 McGeachie 2016)
Figure 13.
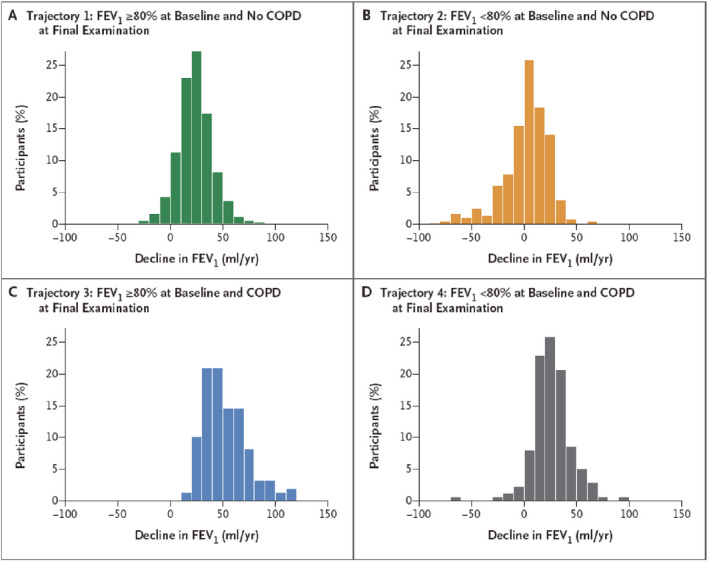
Lung function trajectories leading to chronic obstructive pulmonary disease (COPD). There is an accelerated rate of decline in subjects destined to develop COPD. FEV 1, forced expiratory volume in one second. (Reprinted with permission from ref.16 Lange 2015)
The relationship between airway size and airway hyper‐reactivity: the asthma/COPD overlap syndrome
While about 13% of the US adult population have asthma, 4% has COPD. Another 3% have what has been termed “asthma/COPD overlap syndrome”. These patients have chronic post‐bronchodilator airflow obstruction and a history of asthma dating back to childhood. It has been appreciated that the rate of FEV1 decline is more rapid in patients with poorly controlled asthma.17, 18 Furthermore, Lange showed that patients with asthma have a more rapid decline in FEV1 than the general population.19 Reduced airway growth can itself cause more severe asthma symptoms for a given percent decrease in airway size due to bronchospasm or inflammation, since the physics of fluid flow tells us that airway resistance is inversely proportional to the 4th power of the radius. Thus decreasing the airway radius by the same percentage will increase the airway resistance to a greater degree in a smaller airway than a larger one (Figure 14). This is confirmed by physiologic studies showing that subjects at the lowest quartile of FEV1/VC ratio have greater airway hyper‐reactivity as demonstrated by increased sensitivity to methacholine challenge (Figure 15).20 Bui showed that childhood lung function can predict COPD and asthma/COPD overlap syndrome (Figure 16). Adults at the age of 45 with asthma/COPD overlap syndrome had lower FEV1/VC ratio, and these differences extend back to the first time their lung function was measured at age 7 years.21
Figure 14.

Halving the radius by 50% increases airway resistance to greater extent in smaller airways than in larger ones. This is because resistance is inversely proportional to the 4th power of the radius
Figure 15.
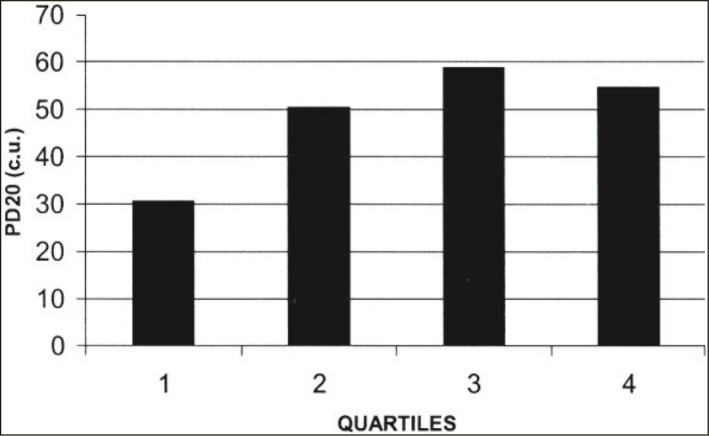
A consequence of Figure 14. Methacholine responsiveness is greater [lower PD20, the provocative dose of methacholine that decreases forced expiratory volume in one second (FEV 1) by 20%] in subjects with smaller airways (1st quartile of airway size compared to all other quartiles). cu, cumulative units. (Reprinted with permission from ref. 20 Parker 2003)
Figure 16.
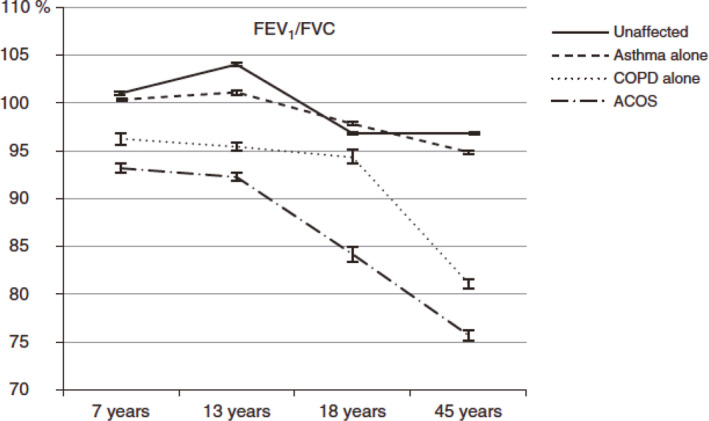
Lower childhood airway function in subjects destined to develop chronic obstructive pulmonary disease (COPD) or asthma/ COPD overlap syndrome (ACOS). FEV 1, forced expiratory volume in one second; FVC, forced vital capacity. (Reprinted with permission from ref. 21 Bui 2017)
Possibility of modifying COPD risk by treating asthma
The childhood asthma management program (CAMP) study evaluated 1041 children from 5 through 12 years of age with mild‐to‐moderate asthma with asthma who were treated with inhaled budesonide or nedocromil over a 4‐6‐year period to assess the effects on lung function. While asthma symptoms and morbidity were clearly improved during the treatment period, no lasting effects on post bronchodilator lung function were found.22 This study has frequently been cited as evidence that inhaled steroids do not have a disease modifying effect. However, this bears re‐evaluation for several reasons. First, the CAMP study was not designed to look at the potential evolution of childhood asthma to COPD. Although it was extremely well conducted, a 4‐year study could not evaluate lung function patterns that evolve over 30–40 years. Since data discussed above suggest that the worse the asthma control, the greater the decrease in lung function over two decades in children17 (Figure 17) and one decade in adults18, this suggests that improved control could lead to less lung function decline. There are some intriguing data that suggest this is the case. The START study23 studied the relationship between severe exacerbations and decline in lung function in adults with asthma. Subjects with well controlled asthma had negligible decline in FEV1 over a 3‐year period; subjects with poorly controlled asthma treated with inhaled steroids also had negligible decline in lung function over the same interval. However subjects with poorly controlled asthma treated with placebo had a greater longitudinal decline in lung function (Figure 18). This decline was significantly reduced during a 2‐year open label extension study during which the placebo group then received daily inhaled steroids.24 Furthermore a recent study by Reddel et al25 showed that the average decline in asthmatics of 1% per year could be reduced by 50% by treatment with budesonide. An interim safety recommendation from the 2016 GINA guidelines26 suggests that inhaled corticosteroids be included in treatment for patients with COPD and a history of asthma; this was supported by a well‐designed case‐control study.27
Figure 17.

Frequent asthma exacerbations are associate with a greater decline in FEV 1/FVC ratio over time. FEV 1, forced expiratory volume in one second; FVC, forced vital capacity. (Reprinted with permission from ref. 17 Sears 2003)
Figure 18.
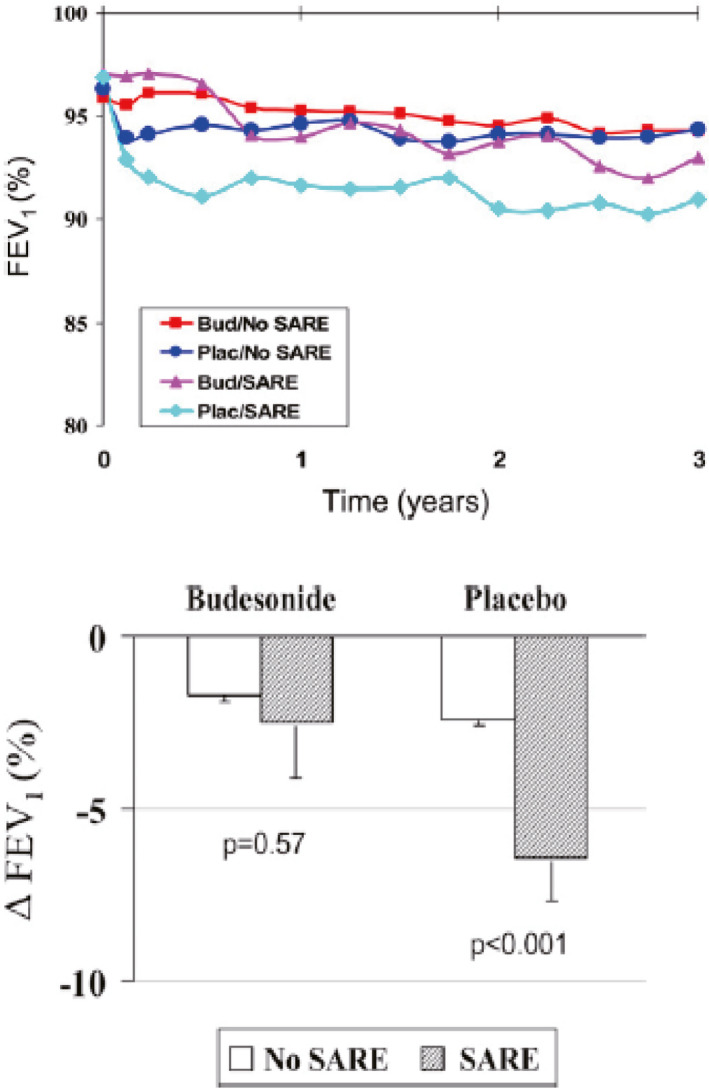
Inhaled corticosteroid treatment can slow lung function decline in subjects with asthma and frequent serious adverse respiratory events (SAREs). (Reprinted with permission from ref. 23 O'Byrne 2009)
Summary
The MEFV curve provides a robust method for tracking lung function in asthma and COPD patients across the lifespan starting above school age. Its property of effort independence underlies its intra‐subject reproducibility within testing sessions and over time. Tracking of normal lung function occurs with growth. Less than average airway size due to dysanaptic airway growth or airway remodeling may be independent risk factor for the development of COPD and the asthma/COPD overlap syndrome in adult life. There are intriguing early data suggesting that perhaps some of this risk is modifiable by improving asthma control with inhaled corticosteroids and minimizing asthma exacerbations, but further study is needed to ascertain the risk benefit ratio of such an approach.
CONFLICT OF INTEREST
None.
Allen JL. Airway function throughout the lifespan: Pediatric origins of adult respiratory disease. Pediatr Invest. 2019;3:236‐244. 10.1002/ped4.12165
REFERENCES
- 1. West JB. Respiratory Physiology: The Essentials. Philadelphia, Pennsylvania: Wolters Kluwer/Lippincott Williams & Wilkins; 2012. [Google Scholar]
- 2. Dawson SV, Elliot EA. Wave‐speed limitation on expiratory flow‐a unifying concept. J Appl Physiol Respir Environ Exerc Physiol. 1977;43:498‐515. [DOI] [PubMed] [Google Scholar]
- 3. Wang X, Dockery DW, Wypij D, Fay ME, Ferris BG Jr. Pulmonary function between 6 and 18 years of age. Pediatr Pulmonol. 1993;15:75‐88. [DOI] [PubMed] [Google Scholar]
- 4. Martin TR, Feldman HA, Fredberg JJ, Castile RG, Mead J, Wohl ME. Relationship between maximal expiratory flows and lung volumes in growing humans. J Appl Physiol. 1988;65:822‐828. [DOI] [PubMed] [Google Scholar]
- 5. Filippone M, Sartor M, Zacchello F, Baraldi E. Flow limitation in infants with bronchopulmonary dysplasia and respiratory function at school age. Lancet. 2003;361:753‐754. [DOI] [PubMed] [Google Scholar]
- 6. Green M, Mead J, Turner JM. Variability of maximum expiratory flow‐volume curves. J Appl Physiol. 1974;37:67‐74. [DOI] [PubMed] [Google Scholar]
- 7. Mead J. Dysanapsis in normal lungs assessed by the relationship between maximal flow, static recoil, and vital capacity. Am Rev Respir Dis. 1980;121:339‐342. [DOI] [PubMed] [Google Scholar]
- 8. Martin TR, Castile RG, Fredberg JJ, Wohl ME, Mead J. Airway size is related to sex but not lung size in normal adults. J Appl Physiol. 1987;63:2042‐2047. [DOI] [PubMed] [Google Scholar]
- 9. Sheel AW, Guenette JA, Yuan R, Holy L, Mayo JR, McWilliams AM, et al. Evidence for dysanapsis using computed tomographic imaging of the airways in older ex‐smokers. J Appl Physiol. 2009;107:1622‐1628. [DOI] [PMC free article] [PubMed] [Google Scholar]
- 10. Ong BA, Li J, McDonough JM, Wei Z, Kim C, Chiavacci R, et al. Gene network analysis in a pediatric cohort identifies novel lung function genes. PLoS One. 2013;8:e72899. [DOI] [PMC free article] [PubMed] [Google Scholar]
- 11. Hancock DB, Eijgelsheim M, Wilk JB, Gharib SA, Leohr LR, Marciante KD, et al. Meta‐analyses of genome‐wide association studies identify multiple loci associated with pulmonary function. Nat Genet. 2010;42:45‐52. [DOI] [PMC free article] [PubMed] [Google Scholar]
- 12. Repapi E, Sayers I, Wain LV, Burton PR, Johnson T, Obeidat M, et al. Genome‐wide association study identifies five loci associated with lung function. Nat Genet. 2010;42:36‐44. [DOI] [PMC free article] [PubMed] [Google Scholar]
- 13. Boulet LP. Airway remodeling in asthma: update on mechanisms and therapeutic approaches. Curr Opin Pulm Med. 2018;24:56‐62. [DOI] [PubMed] [Google Scholar]
- 14. Yilmaz O, Yuksel H. Where does current and future pediatric asthma treatment stand? Remodeling and inflammation: Bird's eye view. Pediatr Pulmonol. 2016;51:1422‐1429. [DOI] [PubMed] [Google Scholar]
- 15. McGeachie MJ, Yates KP, Zhou X, Guo F, Sternberg AL, Van Natta ML, et al. Patterns of growth and decline in lung function in persistent childhood asthma. N Engl J Med. 2016;374:1842‐1852. [DOI] [PMC free article] [PubMed] [Google Scholar]
- 16. Lange P, Celli B, Agusti A, Boje Jensen G, Divo M, Farner R, et al. Lung‐function trajectories leading to chronic obstructive pulmonary disease. N Engl J Med. 2015;373:111‐122. [DOI] [PubMed] [Google Scholar]
- 17. Sears MR, Greene JM, Willan AR, Wiecek EM, Taylor DR, Flannery EM, et al. A longitudinal, population‐based, cohort study of childhood asthma followed to adulthood. N Engl J Med. 2003;349:1414‐1422. [DOI] [PubMed] [Google Scholar]
- 18. Bai TR, Vonk JM, Postma DS, Boezen HM. Severe exacerbations predict excess lung function decline in asthma. Eur Respir J. 2007;30:452‐456. [DOI] [PubMed] [Google Scholar]
- 19. Lange P, Parner J, Vestbo J, Schnohr P, Jensen G. A 15‐year follow up of ventilatory function in adults with asthma. N Engl J Med. 1998;339:1194‐1200. [DOI] [PubMed] [Google Scholar]
- 20. Parker AL, Abu‐Hijleh M, McCool FD. Ratio between forced expiratory flow between 25% and 75% of vital capacity and FVC is a determinant of airway reactivity and sensitivity to methacholine. Chest. 2003;124:63‐69. [DOI] [PubMed] [Google Scholar]
- 21. Bui DS, Burgess JA, Lowe AJ, Perret JL, Lodge CJ, Bui M, et al. Childhood lung function predicts adult chronic obstructive pulmonary disease and asthma‐chronic obstructive pulmonary disease overlap syndrome. Am J Respir Crit Care Med. 2017;196:39‐46. [DOI] [PubMed] [Google Scholar]
- 22. Childhood Asthma Management Program Research Group , Szefler S, Weiss S, Tonascia J, Adkinson NF, Bender B, et al. Long‐term effects of budesonide or nedocromil in children with asthma. N Engl J Med. 2000;343:1054‐1063. [DOI] [PubMed] [Google Scholar]
- 23. O'Byrne PM, Pedersen S, Lamm CJ, Tan WC, Busse WW, START investigators Group . Severe exacerbations and decline in lung function in asthma. Am J Respir Crit Care Med. 2009;179:19‐24. [DOI] [PubMed] [Google Scholar]
- 24. Busse WW, Pedersen S, Pauwels RA, Tan WC, Chen YZ, Lamm CJ, et al. The inhaled steroid treatment as regular therapy in early asthma (START) study 5‐year follow‐up: Effectiveness of early intervention with budesonide in mild persistent asthma. J Allergy Clin Immunol. 2008;121:1167‐1174. [DOI] [PubMed] [Google Scholar]
- 25. Reddel HK, Busse WW, Pedersen S, Tan WC, Chen YZ, Jorup C, et al. Should recommendations about starting inhaled corticosteroid treatment for mild asthma be based on symptom frequency: a post‐hoc efficacy analysis of the START study. Lancet. 2017;389:157‐166. [DOI] [PubMed] [Google Scholar]
- 26. Global Initiative for Asthma. Diagnosis of asthma, COPD and asthma‐COPD overlap syndrome (ACOS): A joint project of GINA and GOLD. ©2016. https://goldcopd.org/wp-content/uploads/2016/04/GOLD_ACOS_2015.pdf. Accessed November 9, 2019.
- 27. Gershon AS, Campitelli MA, Croxford R, Stanbrook MB, To T, Upshur R, et al. Combination long‐acting β‐agonists and inhaled corticosteroids compared with long‐acting β‐agonists alone in older adults with chronic obstructive pulmonary disease. JAMA. 2014;312:1114‐1121. [DOI] [PubMed] [Google Scholar]


