Abstract
By using a facile hydrothermal method, we synthesized Ni1−xMnxFe2O4 nanoparticles as supercapacitor electrode materials and studied how the incremental substitution of Ni with Mn would affect their structural, electronic, and electrochemical properties. X-ray diffractometry confirmed the single-phase spinel structure of the nanoparticles. Raman spectroscopy showed the conversion of the inverse structure of NiFe2O4 to the almost normal structure of MnFe2O4. Field-emission scanning electron microscopy showed the spherical shape of the obtained nanoparticles with a size in the range of 20–30 nm. Optical bandgaps were found to decrease as the content of Mn increased. Electrochemical characterizations of the samples indicated the excellent performance and the desirable cycling stability of the prepared nanoparticles for supercapacitors. In particular, the specific capacitance of the prepared Ni1−xMnxFe2O4 nanoparticles was found to increase as the content of Mn increased, reaching the highest specific capacitance of 1,221 F/g for MnFe2O4 nanoparticles at the current density of 0.5 A/g with the corresponding power density of 473.96 W/kg and the energy density of 88.16 Wh/kg. We also demonstrated the real-world application of the prepared MnFe2O4 nanoparticles. We performed also a DFT study to verify the changes in the geometrical and electronic properties that could affect the electrochemical performance.
Subject terms: Energy storage, Condensed-matter physics
Introduction
Supercapacitors have attracted a lot of attention as an energy storage alternative for batteries due to their potentially promising applications in hybrid electric vehicles, mobile electronic devices, and memory backup systems thanks to their ability in providing high power and energy densities simultaneously1–3. Supercapacitors, also known as electrochemical capacitors, are generally classified into two categories according to their charge storage mechanisms4,5. The first category is the so-called electric double-layer capacitor (EDLC), where the capacitance arises from the electrostatic charge storage at the interfaces between the electrodes and the electrolyte6. The second category is the so-called pseudocapacitor, which involves faradaic reactions but behaves like a capacitor, not a galvanic cell. The typical capacitance per unit surface area of the electrode material in pseudocapacitors is more than 10 times that in EDLCs7.
Transition metal oxides are promising materials in photocatalysts, sensors, solar cells, etc.8–13, and especially as supercapacitor electrodes thanks to their fast, reversible faradaic redox reactions (or pseudocapacitance)14–20. For example, mixed metal oxides including Ni/Mn, Mn/Fe, and Mn/Ni/Co, Ni/Co/Mo oxides have significantly improved the electrochemical performance21–24. Nowadays, designing complex metal oxide-based materials with high specific capacitance and a low cost is desirable. Among the metal oxides, spinel ferrites are fascinating due to their impressive magnetic, electrical, and optical properties as well as their ability to exhibit different redox states and electrochemical stability25,26. It is expected that the ferrites could offer richer redox reactions, including contributions from both M and Fe ions (in MFe2O4) than those of the single-metal oxides27. Binary metal oxide ferrites (MFe2O4) have been widely studied for supercapacitor applications including MFe2O4 (M = Fe, Co, Ni, Mn, Cu, Zn)28, NiCo2O429, MnFe2O47,30, and CoFe2O427. Spinel ferrites may also consist of a mixture of two divalent metal ions, in which the ratio of these divalent ions may vary, and they are referred to as mixed ferrites. The cation distribution of the mixed ferrites significantly affects their surface properties, making them catalytically active. Therefore, it is worthwhile investigating the suitability of mixed ternary-transition-metal ferrites (AxB1−xFe2O4) in the challenging field of supercapacitors. For example, it has been shown that CuCoFe2O4, NiCoFe2O4, and NiCuFe2O4 can be promising for supercapacitors because of their low cost and low toxicity25. Furthermore, there are some reports on MnCoFeO431, MnZnFe2O432, and thin films of NixMn1−xFe2O4 (x = 0.2, 0.4, 0.6, 0.8)33 as supercapacitor electrodes. However, mixed ternary-transition-metal ferrites deserve more investigation to enter the commercial real-world applications.
Here, we carried out a systematic study to see how the incremental substitution of Ni with Mn in hydrothermally synthesized Ni1−xMnxFe2O4 nanoparticles will affect their structural, electronic, and electrochemical properties. Finally, we performed a density functional theory study on the same structures to confirm the changes in their geometrical, electronic, and electrochemical properties.
Experimental methods
Synthesis procedure
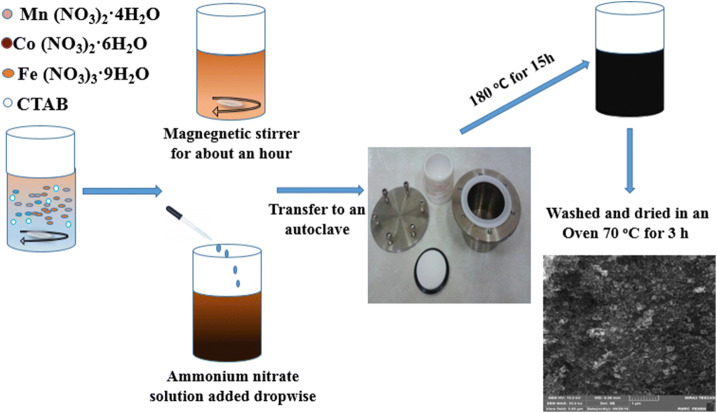
All chemicals, including Mn(NO3)2.4H2O, Fe(NO3)3.9H2O, Ni(NO3)2.6H2O, and cetyltrimethylammonium bromide (CTAB), were purchased from Merck Co. (> 98%) and used without any further purification. The nanoparticle powders of Ni1−xMnxFe2O4 (x = 0.0, 0.2, 0.4, 0.6, 0.8, and 1) were prepared using a hydrothermal method, similar to our recent work on supercapacitance properties of Ni1−xCoxFe2O4 nanoparticles26. First, stoichiometric amounts of the materials, listed in Table 1, were dissolved in 40 ml deionized (DI) water by stirring for about 1 h. Next, 1 ml of 25% ammonia solution was added into the prepared nitrate mixture under vigorous stirring until its pH reaches ~ 9. Next, we transferred the obtained mixture into a Teflon-lined stainless autoclave that subsequently heated in an oven at 180 °C for 15 h. Then, we allowed the autoclave to cool in ambient air to room temperature. Finally, we washed the obtained product with DI water and ethanol for several times and dried it in an oven at 70 °C for 3 h. The prepared powders were used for further characterizations. A schematic of the various steps followed in our synthesis procedure is shown in Fig. 1.
Table 1.
Amounts (g) of the precursors to synthesize Nix−1MnxFe2O4 nanoparticles.
| x | Mn(NO3)2·4H2O | Ni(NO3)2·6H2O | Fe(NO3)3·9H2O | CTAB |
|---|---|---|---|---|
| 0.0 | 0.000 | 0.291 | 0.800 | 0.25 |
| 0.2 | 0.050 | 0.232 | 0.800 | 0.25 |
| 0.4 | 0.100 | 0.174 | 0.800 | 0.25 |
| 0.6 | 0.150 | 0.116 | 0.800 | 0.25 |
| 0.8 | 0.200 | 0.058 | 0.800 | 0.25 |
| 1.0 | 0.251 | 0.000 | 0.800 | 0.25 |
Figure 1.
A schematic of the procedure followed to synthesize the manganese/nickel ferrite nanoparticles.
Characterization techniques
X-ray diffractometry (XRD) was used to investigate the crystal structures of the prepared materials by employing a PANalytical X'pert MPD (Philips, Cu-Kα radiation source, λ = 1.54056 Å). Raman spectroscopy equipped with an Nd:YAG laser working at λex = 532 nm at room temperature was employed to characterize the structure of the materials. Field-emission scanning electron microscopy (FESEM) was employed to observe the morphologies of the prepared materials by employing a MIRA3TESCAN-XMU microscope. The UV–Vis optical absorptions of the materials were recorded using a Unico, 4,802 spectrophotometer.
Electrochemical measurements
A three-electrode electrochemical setup was used to study the electrochemical properties of the materials by utilizing a VSP-300 Multichannel Potentiostat/Galvanostat/EIS instrument (Bio-Logic Science Instruments). The electrolyte was 3 M KOH solution, the reference was an Ag/AgCl electrode, the counter electrode was a square-shaped Platinum sheet (1 cm2, 99.99%), and the substrate for the working electrodes was a square-shaped nickel foam (1 × 1 cm2) washed with ethanol, acetone, and DI water. The working electrode material was prepared from the active material, acetylene black, and polyvinylidene difluoride (PVDF), as a binder, with the weight ratio of 80:15:5 solved in N-Methyl-2-pyrrolidone (NMP). The prepared material was coated on a nickel foam substrate by a brush. Cyclic voltammetry (CV) tests were performed at different scan rates in the potential range of 0–0.4 V. The chronopotentiometry galvanostatic charge–discharge (GCD) tests were performed at different current densities. An asymmetric supercapacitor in a two-electrode setup was also assembled using the MnFe2O4 nanoparticles as the positive electrode, activated carbon (AC) as the negative electrode, and a filter paper wetted with the electrolyte as the separator to demonstrate the real-world application of the prepared materials. To prepare the AC electrode, a mixture of AC powder and PVDF, as a binder, was mixed with the weight ratio of 90:10 and solved in NMP. The prepared ink was coated on a nickel foam substrate by a brush and dried at 60 °C for 10 h.
Computational methods
First-principles calculations were performed in the framework of density functional theory (DFT), as implemented in the Quantum Espresso package (version 6.2)34, using the plane-wave basis set and ultrasoft pseudopotentials35 and the valence electrons included Ni 3d 4 s, Mn 3d 4 s, Fe 3d 4 s, and O 2 s 2p states. Spin polarization was included in both geometry optimizations and electronic structure calculations. The generalized gradient approximation (GGA) developed by Perdew, Burke, and Ernzerhof (PBE)36 was applied for electron exchange–correlation functionals with the on-site Coulomb repulsion U terms37 of U(Ni) = 6.2 eV, U(Mn) = 3.9 eV, and U(Fe) = 5.3 eV to reproduce experimental data. The kinetic energy cutoffs for wavefunctions and charge densities were set to 50 and 450 Ry, respectively, and the k-point grid of 6 × 6 × 5 was adopted for sampling the first Brillouin zone (BZ) for electronic structure calculations. All structures were fully relaxed until the convergence criteria of energy and force became less than 10–6 Ry and 10–3 Ry/Bohr, respectively. All crystal images and simulated XRD patterns were produced by VESTA38.
Results and discussions
XRD patterns of the prepared Ni1−xMnxFe2O4 samples, shown in Fig. 2, show all characteristic peaks of a ferrite material. The peaks are indexed as (111), (220), (311), (400), (422), (511), and (440) diffraction planes that are matched with the JCPDS card No. 96-591-0,064, indicating the cubic spinel structure with the space group of . The patterns do not exhibit any additional peak, confirming the purity of the ferrite samples. The peaks are somewhat broad, which is due to the small size of the formed crystallites. The Williamson–Hall analysis was used to calculate the crystallite size and the lattice strain according to Eq. (1) for all intense peaks39:
| 1 |
where θhkl and βkhl are the diffraction angle and the full width at half maximum (FWHM) of the (hkl) diffraction peak, k is the shape factor (here, 0.94), λ is the wavelength of the X-ray radiation source (1.54056 Å), and D and ε correspond to the crystallite size and the lattice strain, respectively. Accordingly, D and ε were obtained from the Y-intercept and the slope of the line from the plot of 4Sinθ versus βCosθ40, respectively, as reported in Table 2. The lattice parameter a, also reported in Table 2, was calculated using Eq. (2) for the most intense peak41:
| 2 |
where dhkl is the inter-planar spacing for the most intense peak (311). It is seen that the lattice parameter a increases as the content of Mn+2 ions increases, which could be attributed to the larger ionic radius of Mn+2 (0.8 Å) than Ni+2 (0.69 Å). It is also seen that MnFe2O4 has both a larger crystallite size and a higher compressive strain than NiFe2O4, which is because of the stronger bonds that Mn+2 ions can form, as confirmed by Raman spectra (Fig. 3).
Figure 2.
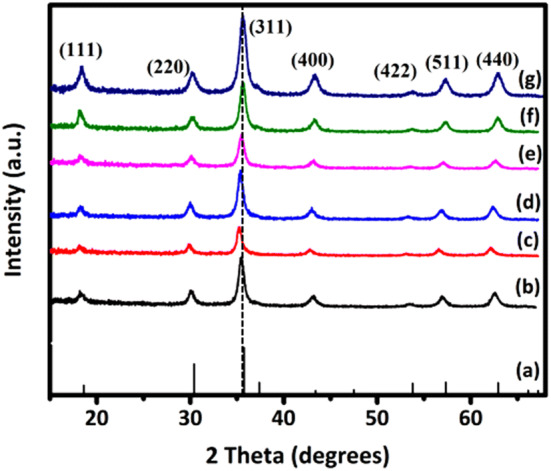
(a) Diffraction peaks corresponding to the JCPDS card #96-591-0,064 and XRD patterns of Ni1−xMnxFe2O4 nanoparticles where (b) x = 0, (c) x = 0.2, (d) x = 0.4, (e) x = 0.6, (f) x = 0.8, and (g) x = 1.
Table 2.
Lattice parameter a, inter-planar spacing d, FWHM, crystal size D, strain ε, unit cell volume V, A1g Raman shift for the Ni1−xMnxFe2O4 samples.
| x | d (Å) | a (Å) | V (Å3) | FWHM (degrees) | D (nm) | ε | A1g Raman shift (1/cm) |
|---|---|---|---|---|---|---|---|
| 0.0 | 2.52 | 8.36 | 584.28 | 0.7233 | 9.36 | − 0.00234 | 687.81 |
| 0.2 | 2.52 | 8.37 | 586.38 | 0.6436 | 9.44 | − 0.00253 | 686.38 |
| 0.4 | 2.52 | 8.39 | 590.59 | 0.7460 | 9.12 | − 0.00265 | 677.77 |
| 0.6 | 2.53 | 8.39 | 590.59 | 0.7350 | 8.39 | − 0.00302 | 654.37 |
| 0.8 | 2.55 | 8.45 | 603.35 | 0.6441 | 10.13 | − 0.00242 | 631.21 |
| 1.0 | 2.56 | 8.48 | 609.80 | 0.3936 | 9.54 | − 0.00284 | 630.98 |
Figure 3.
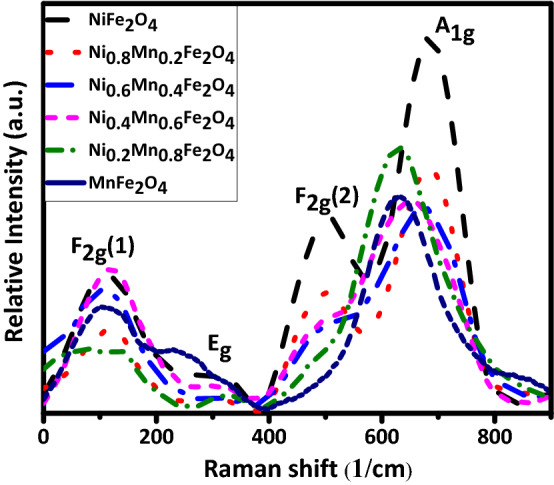
Raman spectra of the Ni1−xMnxFe2O4 nanoparticles.
Raman spectra of the Ni1−xMnxFe2O4 nanoparticles are shown in Fig. 3. The A1g band is due to the symmetric stretching of oxygen atoms along Fe–O (or M–O) tetrahedral bonds, the F2g(1) band is due to the translatory movement of the whole tetrahedron (FeO4), the F2g(2) band is due to the asymmetric stretching of Fe/M–O bonds, and the Eg band is due to the asymmetric and symmetric bending of O with respect to Fe42. The inverse spinel structure of the samples is confirmed by the Raman analysis43. As it is seen in Fig. 3 and Table 2, the A1g peak shifts toward a lower frequency (from 687 to 630 1/cm) and the intensity of the F2g(2) peak decreases as Ni+2 ions are substituted with Mn+2 ions, consistent with differences between the Raman spectra of inverse and normal spinel structures44. This is due to the smaller ionic radius of Ni+2 than Mn+2. As a result, when Ni+2 ions are substituted with Mn+2 ions the lengths of bonds between the cations with the host atoms increase, leading to stronger interactions between atoms45,46. The experimentally obtained Raman modes are consistent with those for Ni0.75Zn0.25Fe2O442, MnxFe3−xO447, and ZnCuFe2O448.
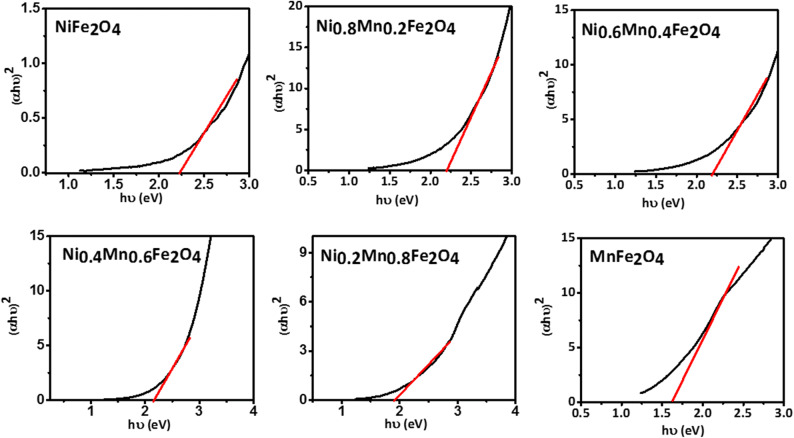
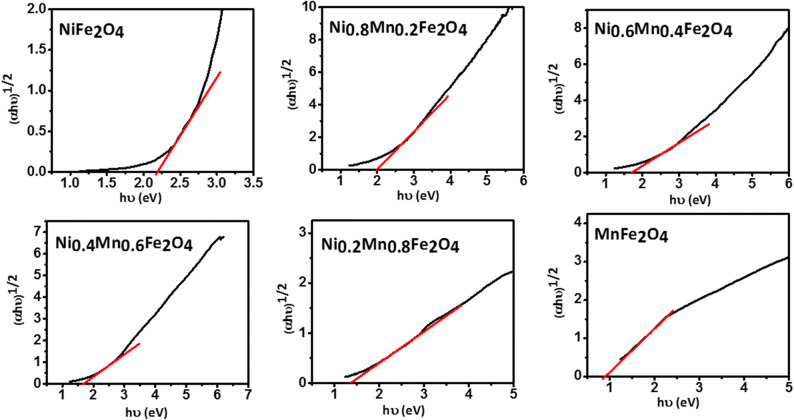
Figure 4 shows the optical absorption spectra of the prepared Ni1−xMnxFe2O4 nanoparticles. It is seen that as the content of Mn+2 increases the absorption edge undergoes a redshift and the absorbance is enhanced in both visible and near-infrared regions. These absorption spectra are consistent with those of previous reports on crystalline Mn1–xNixFe2O449 and Mn1−xCoxFe2O450. It is insightful to find how the incremental substitution of Ni with Mn in Ni1−xMnxFe2O4 will affect its bandgap. Because generally, the lower the bandgap the higher the specific capacitance. The optical bandgap Eg can be determined using the Tauc's relation in Eq. (3) 51
| 3 |
where α is the absorbance, h is the Plank's constant, ν is the light frequency, A is a proportionality constant, Eg is the optical bandgap, and n is a constant that depends on the bandgap type (1/2 and 2 for direct and indirect bandgaps, respectively). The optical bandgap can be estimated from the intersection of a line drawn on the linear part of the plot of (αhυ)n versus the photon energy hυ, known as the Tauc's plot, with the hυ axis. Tauc plots of the Ni1−xMnxFe2O4 nanoparticles are shown in Figs. 5 and 6 assuming direct and indirect bandgaps, respectively46,52,53. It is seen that both direct and indirect bandgaps decrease as the content of Mn+2 increases. It is known that the bandgap value is affected by various factors such as the crystallite size, structural parameters, and impurities. In this case, due to the larger radius of Mn+2 ions than Ni+2 ions, the ionic interactions get stronger as the content of Mn+2 increases. This, along with the doping-induced states, induces inner bands in the bandgap, providing additional paths between the conduction band and the valence band that decrease the bandgap value. This could indicate the better specific capacitance of the Mn-doped nanoparticles.
Figure 4.
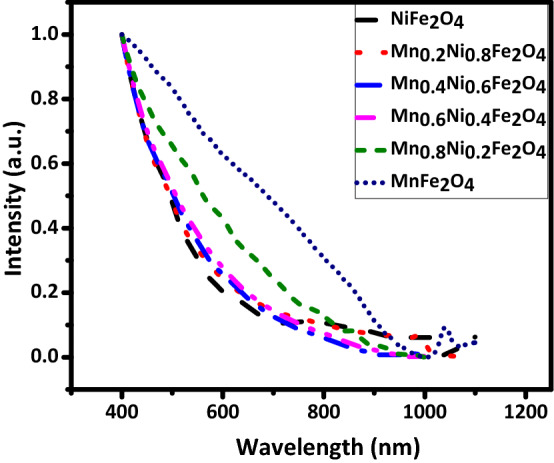
Absorption spectra of the Ni1−xMnxFe2O4 samples.
Figure 5.
Tauc plots of the Ni1−xMnxFe2O4 nanoparticles assuming direct bandgaps.
Figure 6.
Tauc plots of the Ni1−xMnxFe2O4 nanoparticles assuming indirect bandgaps.
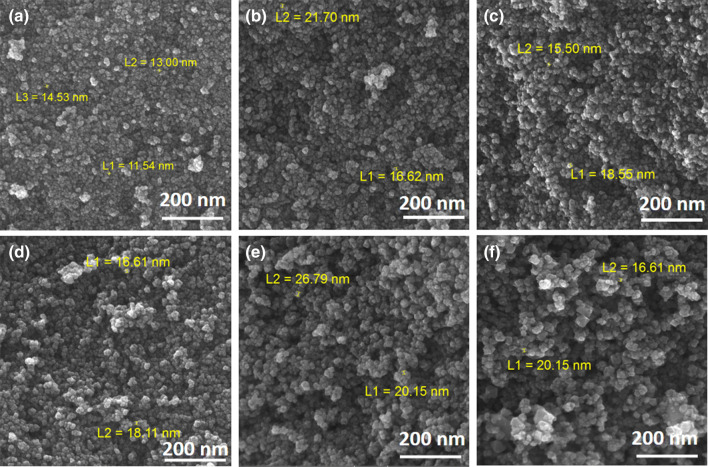
FESEM images of the prepared Ni1−xMnxFe2O4 nanoparticles are shown in Fig. 7. The images exhibit highly agglomerated and spherical nanoparticles with a small grain size thanks to the use of CTAB26. It is seen that the average grain size increases when Ni+2 ions are substituted with Mn+2 ions, which is due to the larger ionic radius of Mn+2 ions than Ni+2 ions.
Figure 7.
FESEM images of the prepared Ni1−xMnxFe2O4 nanoparticles, where (a) x = 0, (b) x = 0.2, (c) x = 0.4, (d) x = 0.6, (e) x = 0.8, and (f) x = 1.
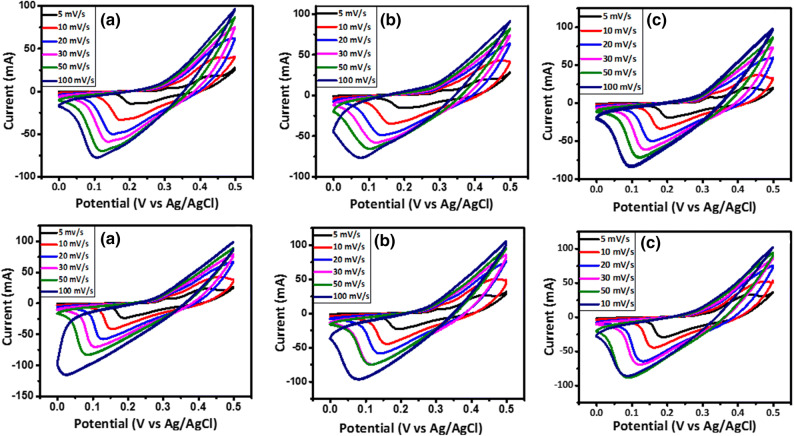
Cyclic voltammetry (CV) tests were carried out within the potential range of 0.0–0.5 V for three-electrode tests with scan rates varying from 5 to 100 mV/s, as shown in Fig. 8. The CV curves display faradic currents, which are generated by the reduction or oxidation of some chemical active materials at the electrode. Accordingly, there are two peaks in the CV curves: (1) the oxidation peak in positive currents and (2) the reduction peak in negative currents. The oxidation and reduction peaks shift to higher and lower potentials as the scan rate increases. It is well known that the area within a CV curve is directly proportional to its specific capacitance. Thus, it is seen in all of the CV curves that the specific capacitance decreases as the scan rate increases25. Because at high scan rates, the electrolyte ions do not have enough time to diffuse entirely into the electrode nanopores wherever the faradaic reactions occur, making some part of the active surface areas inaccessible. Furthermore, this could be attributed to the existence of a large ohmic resistance at high scan rates25,26,31. The comparative CV curves of the samples at the scan rate of 5 mV/s are also shown in Fig. 9. Based on the area within the CV curves, it is evident that the incremental substitution of Ni with Mn leads to the enhancement of the specific capacitance of the Ni1−xMnxFe2O4-based electrodes, resulting from the decreased bandgap of Ni1−xMnxFe2O4 nanoparticles for a higher x, which itself enhances faradaic reactions at the electrode surface and enhances the specific capacitance.
Figure 8.
CV curves of the electrodes constructed from the prepared Ni1−xMnxFe2O4 nanoparticles where (a) x = 0, (b) x = 0.2, (c) x = 0.4, (d) x = 0.6, (e) x = 0.8, and (f) x = 1 at the scan rates of 5–100 mV/s.
Figure 9.
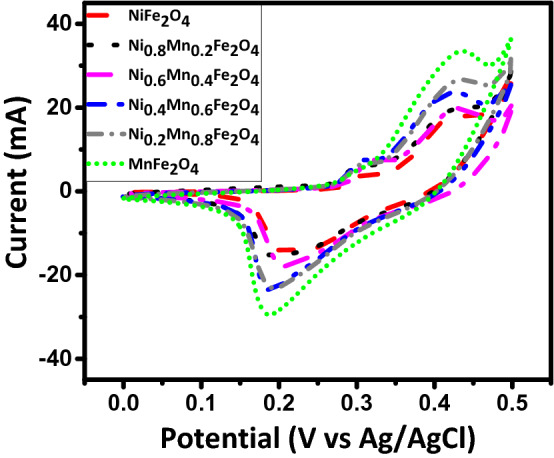
Comparative CV curves of the electrodes constructed from the prepared Ni1−xMnxFe2O4 nanoparticles at the scan rate of 5 mV/s.
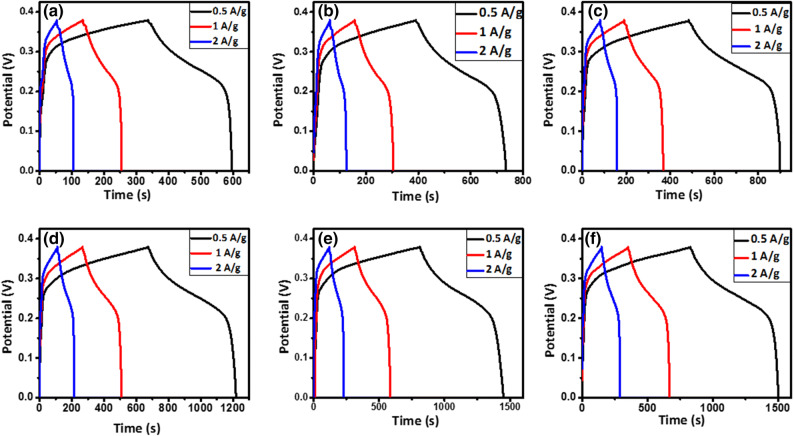
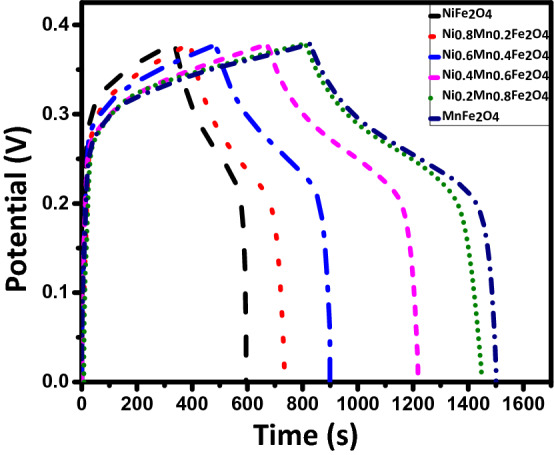
Galvanostatic charge–discharge (GCD) curves of the samples at different current densities for three-electrode tests are shown in Fig. 10. The nonlinear discharge curves show that the capacitive performance results from both the electric double-layer capacitance and the pseudocapacitance31. The potential drop observed at the beginning of the discharge curve indicates both the very low internal series resistance (Rs) of the prepared electrodes in the KOH electrolyte and the low contact resistance at the interface of the current collector and the electrolyte25. It is seen that the discharge time decreases as the current density increases, which is due to the lower accessibility of pores in the active material for electrolyte ions at higher currents16. The comparative GCD curves of the samples at the current density 0.5 A/g are also shown in Fig. 11. It is seen that the discharge time increases as Ni is incrementally substituted with Mn in Ni1−xMnxFe2O4-based electrodes. The specific capacitance values were calculated from Eq. (4):
| 4 |
where Csp is the specific capacitance (F/g), I/m is the current intensity (A/g), is the area under the discharge curve, and ΔV is the active potential window54–56. The electrode based on the MnFe2O4 nanoparticles shows the highest capacitance of 1,221 F/g at the current density of 0.5 A/g. Energy densities and power densities of the samples were also calculated using Eqs. (5) and (6)55:
| 5 |
| 6 |
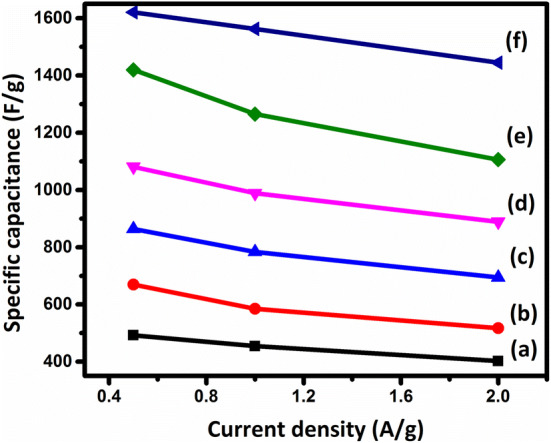
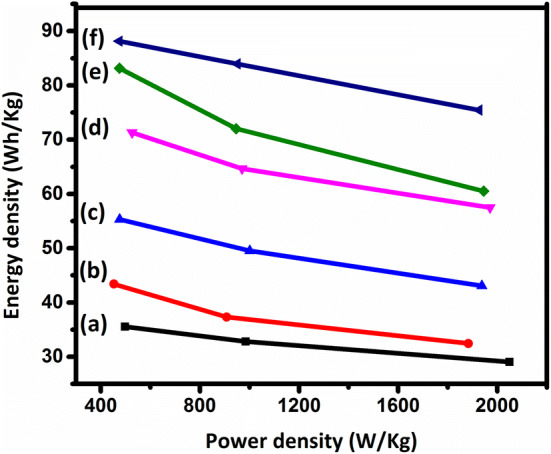
where t is the discharge time. The specific capacitance values and the energy and power densities of the samples are reported in Table 3. As can be seen in Fig. 12, the specific capacitance decreases as the current density increases, which can be explained by considering the ion diffusion mechanism. In other words, at a lower current density, the electrolyte ions have enough time to access the highest number of active sites on the electrode material, leading to a higher specific capacitance54. According to Table 3, the specific capacitance of Ni1−xMnxFe2O4-based electrodes increases considerably as the content of Mn increases, consistent with CV curves in Fig. 9, as discussed above. The Ragone plots of the sample are shown in Fig. 13, indicating that the MnFe2O4-based electrode exhibits the remarkable specific energy density of 35.55 Wh/kg with the specific power density of 479.92 W/kg, which are much higher than those of the other samples.
Figure 10.
GCD curves of the electrodes constructed from the prepared Ni1−xMnxFe2O4 nanoparticles where (a) x = 0, (b) x = 0.2, (c) x = 0.4, (d) x = 0.6, (e) x = 0.8, and (f) x = 1 at the current densities of 5–100 mV/s.
Figure 11.
GCD curves of the electrodes constructed from the prepared Ni1−xMnxFe2O4 nanoparticles at the current density of 0.5 A/g.
Table 3.
Specific capacitances, energy densities, and power densities of the electrodes constructed from the prepared Ni1−xMnxFe2O4 nanoparticles at the current density of 0.5 A/g.
| x | Specific capacitance (F/g) | Energy density (Wh/kg) | Power density (W/kg) |
|---|---|---|---|
| 0.0 | 492 | 35.55 | 497.92 |
| 0.2 | 601 | 43.41 | 452.98 |
| 0.4 | 766 | 55.31 | 476.35 |
| 0.6 | 988 | 71.34 | 526.25 |
| 0.8 | 1,152 | 83.18 | 475.28 |
| 1.0 | 1,221 | 88.16 | 473.96 |
Figure 12.
Specific capacitance versus current density for the electrodes constructed from the prepared Ni1−xMnxFe2O4 nanoparticles where (a) x = 0, (b) x = 0.2, (c) x = 0.4, (d) x = 0.6, (e) x = 0.8, and (f) x = 1.
Figure 13.
Ragone (energy density versus power density) plots for the electrodes constructed from the prepared Ni1−xMnxFe2O4 nanoparticles where (a) x = 0, (b) x = 0.2, (c) x = 0.4, (d) x = 0.6, (e) x = 0.8, and (f) x = 1.
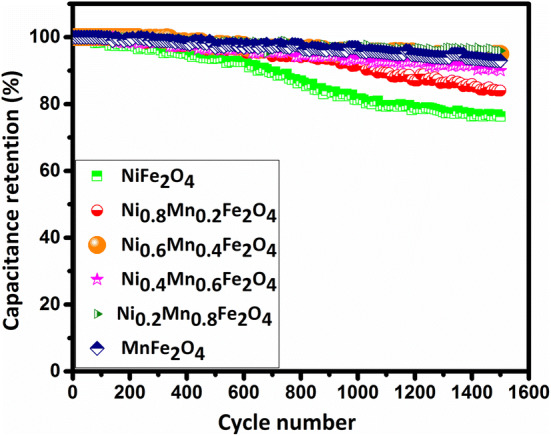
Cyclic stability tests were performed at the current density of 3 A/g for 1,500 GCD cycles, as shown in Fig. 14. It is seen that the substitution of Ni with Mn in Ni1−xMnxFe2O4-based electrodes considerably improves their cycling stability. This is another strength of MnFe2O4, in addition to its higher specific capacitance, as compared to NiFe2O4 for real-world commercial supercapacitor applications.
Figure 14.
Cycling stabilities of the electrodes constructed from the prepared Ni1−xMnxFe2O4 nanoparticles over 1,500 GCD cycles at the current density of 3 A/g.
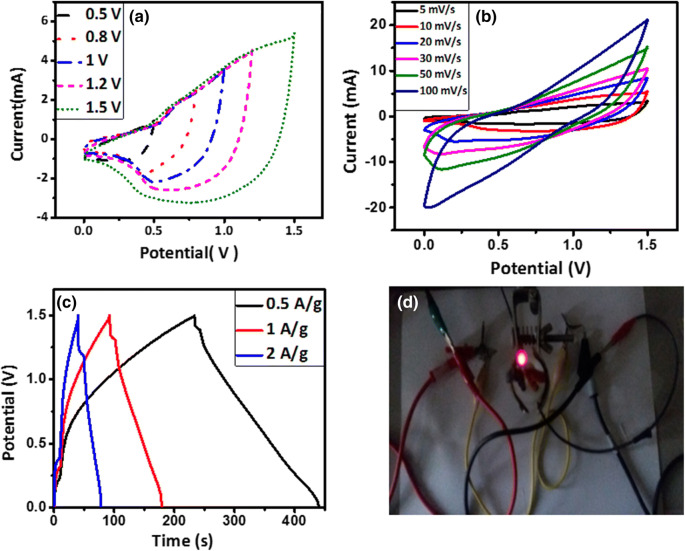
We observed that the electrode based on the prepared MnFe2O4 nanoparticles exhibited the highest specific capacitance and a very good stability. To demonstrate the real-world application of the electrode material, an asymmetric supercapacitor was assembled using the MnFe2O4 nanoparticles as the positive electrode, AC as the negative electrode (refer to the "Electrochemical measurements" section for the preparation method), and a filter paper wetted with the electrolyte as the separator. According to the specific capacitance of the AC electrode (150 F/g), and in order to achieve the maximum operating potential window and performance, the optimal mass ratio between the positive and negative electrodes () was balanced according to Eq. (7)4,56,57:
| 7 |
Accordingly, the weight of AC powder was calculated ~ 4 mg. The CV curves of the electrode in the potential windows of 0.5–1.5 V and at different scan rates are shown in Fig. 15a and b, respectively. We chose the potential window of 1.5 V for further tests because of its highest CV area. It is seen that the CV curves retain their rectangular shape without apparent distortions up to 100 mV/s, indicating the high rate capability of this asymmetric supercapacitor. Interestingly, the asymmetric cell presents a wide and stable operating potential window up to 1.5 V in the KOH electrolyte that should afford high energy densities. The GCD curves of the electrode at different current densities are also shown in Fig. 15c. Figure 15d shows a picture of the assembled asymmetric supercapacitor lighting up a red LED, indicating the real-world application of the electrode material.
Figure 15.
CV curves of the MnFe2O4//AC asymmetric device (a) at different potential windows at 10 mV/s and (b) at different scan rates. (c) GCD curves of the device at different current densities. (d) A picture of the assembled asymmetric supercapacitor lighting up a red LED.
DFT study
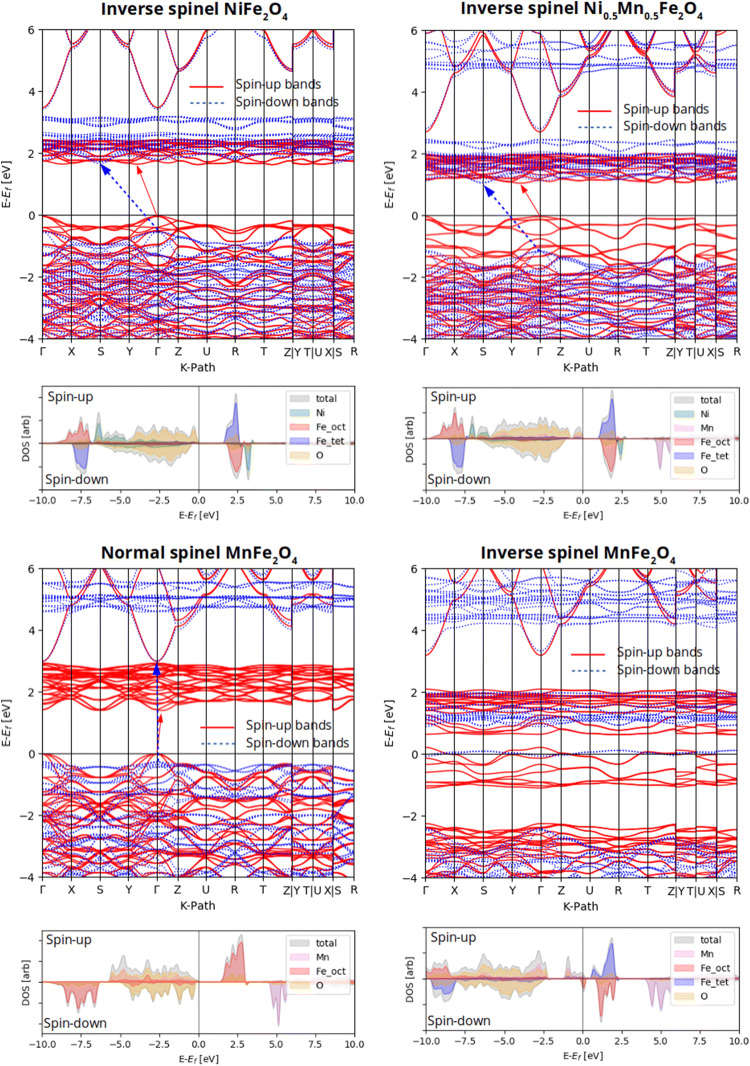
Nickel ferrite (NiFe2O4) and manganese ferrite (MnFe2O4) are both insulating, soft ferrimagnetic spinel ferrites. NiFe2O4 is configured in a fully inverse spinel structure, where Fe3+ ions occupy all the tetrahedral sites and half of the octahedral sites and Ni2+ ions occupy the other half of the octahedral sites58. On the other hand, MnFe2O4 crystallizes in a mixed-phase spinel structure59 with the almost low inversion degree of 0.2, where 80% and 20% of Mn2+ ions occupy the tetrahedral sites and octahedral sites, respectively, and Mn2+ and Fe3+ ions are distributed in the remaining tetrahedral and octahedral sites. Transport experiments have shown MnFe2O4 as an insulator with a small bandgap of 0.04–0.06 eV by60. To confirm the changes in geometrical and electronic properties of the samples, we performed a DFT study on NiFe2O4, Ni0.5Mn0.5Fe2O4, and MnFe2O4 structures. We considered 28-atom unit cells for all configurations as half of a simple cubic structure. Here, we considered an inverse spinel configuration for NiFe2O4 and Ni0.5Mn0.5Fe2O4. However, we considered both normal and inverse spinel configurations for MnFe2O4 (see Fig. 16). All the structures exhibited a ferrimagnetic character. To have a more clear understanding, we computed XRD patterns of the structure optimized by the DFT calculations, as shown in Fig. 17. It is seen that except inverse spinel MnFe2O4, the XRD patterns of all structures are largely similar to the experimentally obtained ones (Fig. 2). However, based on the shift in the position of the most-intense peak, it seems that the true XRD pattern of MnFe2O4 is a combination of normal and inverse spinel XRD patterns. Furthermore, it is seen that if one assumes the normal spinel structure for MnFe2O4, the changes in the lattice constants of a and c are consistent with the experimental XRD results (Fig. 2), confirming that the incremental substitution of Ni ions with Mn ions increases the cell volume. Figure 18 shows the electronic band structures and atom-projected density of states of the considered structures. It is seen that except inverse spinel MnFe2O4, the other structures are an insulator with different gaps for spin-up and spin-down states. However, when Co is incorporated into the structure, the structure becomes a conductor. The phenomenon and the increase of states near the Fermi level could help the structure to store charges, increasing the specific capacitance. It should be noted that the inverse spinel structure could not provide a true representation of the crystal structure of MnFe2O4, which predicts the structure as a conductor, which is not true experimentally. Lattice constants, spin-up gap, and spin-down gap of the considered structures calculated by DFT are also listed in Table 4. Furthermore, according to the atom-projected DOSs of normal and inverse MnFe2O4 spinel structures in Fig. 18, and considering that the true structure of MnFe2O4 is a combination of 20% inverse and 80% normal spinel structures, it could be said that the density of states near the fermi level of MnFe2O4 is higher than those of NiFe2O4 and Ni0.5Mn0.5Fe2O4, which could lead to a higher conductivity critical to supercapacitor applications.
Figure 16.
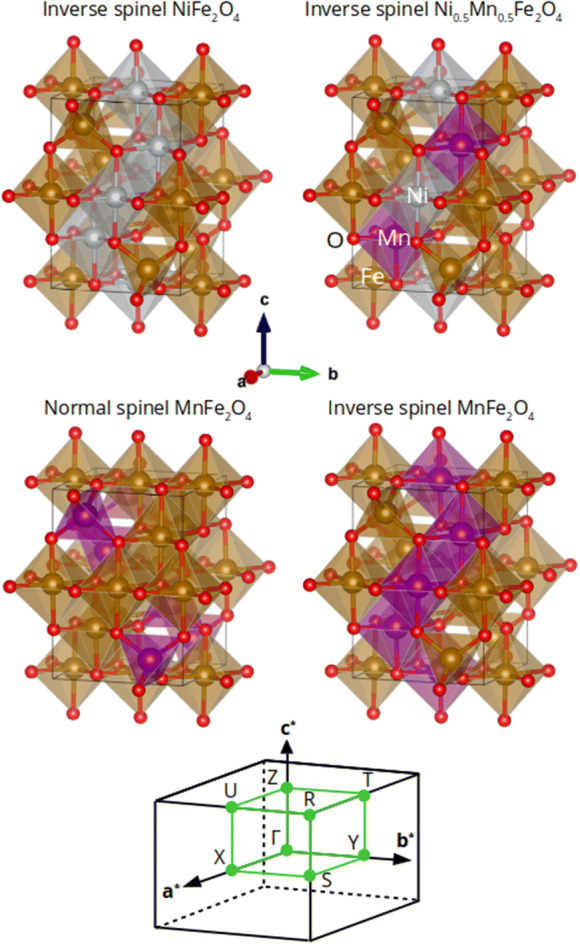
The considered unit cells of inverse NiFe2O4, inverse Ni0.5Mn0.5Fe2O4, and both normal and inverse MnFe2O4 spinel structures. The first Brillion zone and the k-path (in green) chosen to draw band structures are also shown in the bottom.
Figure 17.
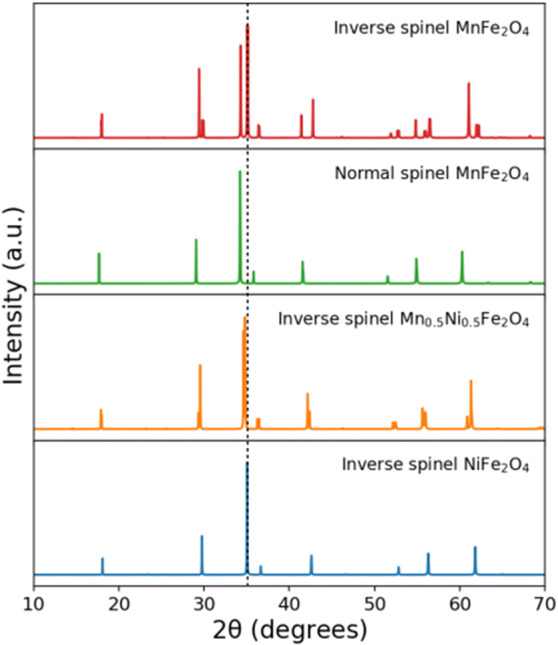
The computed XRD patterns of the crystal structures considered in this study.
Figure 18.
Electronic band structures and atom-projected density of states of the considered structures.
Table 4.
Lattice constants, spin-up gap, and spin-down gap calculated by DFT.
| a (Å) | c (Å) | Spin-up gap (eV) | Spin-down gap (eV) | |
|---|---|---|---|---|
| Inverse spinel NiFe2O4 | 6.00 | 8.49 | 1.6 (indirect) | 2.2 (indirect) |
| Inverse spinel Ni0.5Mn0.5Fe2O4 | 6.08 | 8.52 | 1 (indirect) | 2.1 (indirect) |
| Normal spinel MnFe2O4 | 6.14 | 8.68 | 1.4 (indirect) | 4.5 (direct) |
| Inverse spinel MnFe2O4 | 5.96 | 8.71 | 0 | 0 |
Conclusion
In summary, spinel Ni1−xMnxFe2O4 nanoparticles with x = 0, 0.2, 0.4, 0.6, 0.8, and 1 were synthesized by a simple hydrothermal method to study how the incremental substitution of Ni with Mn can affect their electrochemical properties as supercapacitor electrode materials. We observed that by substituting Ni with Mn, the inverse spinel structure of NiFe2O4 changed to the almost normal spinel structure of MnFe2O4 and the optical bandgap decreased, leading to both considerably enhanced electrochemical properties and cycling stability. The electrode based on the MnFe2O4 nanoparticles exhibited the highest specific capacitance of 1,221 F/g at the current density of 0.5 A/g, with the corresponding energy density and power density of 88.16 Wh/kg and 473.96 W/kg, respectively. The density functional theory study on the same structures confirmed the changes in their geometrical and electronic properties.
Acknowledgements
The authors would like to thank the Research Council of Tarbiat Modares University for financial support.
Author contributions
S.S. and K.R. wrote the manuscript text. K.R. performed DFT simulations. A.Y. is the supervisor of the Project.
Data availability
The datasets generated during and/or analyzed during the current study are available from the corresponding author on reasonable requests.
Competing interest
The authors declare no competing interests.
Footnotes
Publisher's note
Springer Nature remains neutral with regard to jurisdictional claims in published maps and institutional affiliations.
References
- 1.Dong L, et al. Flexible electrodes and supercapacitors for wearable energy storage: a review by category. J. Mater. Chem. A. 2016;4:4659–4685. [Google Scholar]
- 2.Liu C, Li F, Ma L-P, Cheng H-M. Advanced materials for energy storage. Adv. Mater. 2010;22:E28–E62. doi: 10.1002/adma.200903328. [DOI] [PubMed] [Google Scholar]
- 3.Qu G, et al. ZIF-67 derived hollow ni–co–se nano-polyhedrons for flexible hybrid supercapacitors with remarkable electrochemical performances. Chin. Chem. Lett. 2020 doi: 10.1016/j.cclet.2020.01.040. [DOI] [Google Scholar]
- 4.Ismail FM, Ramadan M, Abdellah AM, Ismail I, Allam NK. Mesoporous spinel manganese zinc ferrite for high-performance supercapacitors. J. Electroanal. Chem. 2018;817:111–117. [Google Scholar]
- 5.Low WH, Khiew PS, Lim SS, Siong CW, Ezeigwe ER. Recent development of mixed transition metal oxide and graphene/mixed transition metal oxide based hybrid nanostructures for advanced supercapacitors. J. Alloy. Compd. 2019;775:1324–1356. [Google Scholar]
- 6.Wang B, Guo P, Bi H, Li Q, Zhang G, Wang R, Liu J, Zhao XS. Electrocapacitive properties of MnFe2O4 electrodes in aqueous LiNO3 electrolyte with surfactants. Int. J. Electrochem. Sci. 2013;8:8966–8977. [Google Scholar]
- 7.Kuo S-L, Lee J-F, Wu N-L. Study on pseudocapacitance mechanism of aqueous MnFe2O4 supercapacitor. J. Electrochem. Soc. 2007;154:A34. [Google Scholar]
- 8.Rahimi K, Zafarkish H, Yazdani A. Reduced graphene oxide can activate the sunlight-induced photocatalytic effect of NiO nanowires. Mater. Des. 2018;144:214–221. [Google Scholar]
- 9.Yazdani A, Zafarkish H, Rahimi K. The variation of Eg-shape dependence of NiO nanoparticles by the variation of annealing temperature. Mater. Sci. Semicond. Process. 2018;74:225–231. [Google Scholar]
- 10.Zahraei F, Rahimi K, Yazdani A. Preparation and characterization of graphene/nickel oxide nanorods composite. Int. J. Nano Dimens. 2015;6:371–376. [Google Scholar]
- 11.Rahimi K, Yazdani A. Ethanol-sensitive nearly aligned ZnO nanorod thin films covered by graphene quantum dots. Mater. Lett. 2018;228:65–67. [Google Scholar]
- 12.Rahimi K, Yazdani A. Incremental photocatalytic reduction of graphene oxide on vertical ZnO nanorods for ultraviolet sensing. Mater. Lett. 2020;262:127078. [Google Scholar]
- 13.Rahimi K, Moradi M, Dehghan R, Yazdani A. Enhancement of sunlight-induced photocatalytic activity of ZnO nanorods by few-layer MoS2 nanosheets. Mater. Lett. 2019;234:134–137. [Google Scholar]
- 14.Eskandari M, Malekfar R, Buceta D, Taboada P. NiCo2O4-based nanostructured composites for high-performance pseudocapacitor electrodes. Colloids Surf. A Physicochem. Eng. Asp. 2020;584:124039. [Google Scholar]
- 15.Shi Y, et al. Nanostructured conductive polypyrrole hydrogels as high-performance, flexible supercapacitor electrodes. J. Mater. Chem. A. 2014;2:6086–6091. [Google Scholar]
- 16.Goljanian Tabrizi A, et al. Facile synthesis of a MnFe2O4/rGO nanocomposite for an ultra-stable symmetric supercapacitor. New J. Chem. 2017;41:4974–4984. [Google Scholar]
- 17.Zhang Y, Li L, Su H, Huang W, Dong X. Binary metal oxide: Advanced energy storage materials in supercapacitors. J. Mater. Chem. A. 2015;3:43–59. [Google Scholar]
- 18.Chen D, Wang Q, Wang R, Shen G. Ternary oxide nanostructured materials for supercapacitors: a review. J. Mater. Chem. A. 2015;3:10158–10173. [Google Scholar]
- 19.Farzana R, Hassan K, Sahajwalla V. Manganese oxide synthesized from spent Zn–C battery for supercapacitor electrode application. Sci. Rep. 2019;9:1–12. doi: 10.1038/s41598-019-44778-z. [DOI] [PMC free article] [PubMed] [Google Scholar]
- 20.Ramesh S, et al. Porous materials of nitrogen doped graphene oxide@SnO2 electrode for capable supercapacitor application. Sci. Rep. 2019;9:1–10. doi: 10.1038/s41598-019-48951-2. [DOI] [PMC free article] [PubMed] [Google Scholar]
- 21.Luo J-M, Gao B, Zhang X-G. High capacitive performance of nanostructured Mn–Ni–Co oxide composites for supercapacitor. Mater. Res. Bull. 2008;43:1119–1125. [Google Scholar]
- 22.Hong W, Lin L. Studying the substrate effects on energy storage abilities of flexible battery supercapacitor hybrids based on nickel cobalt oxide and nickel cobalt oxide@nickel molybdenum oxide. Electrochim. Acta. 2019;308:83–90. [Google Scholar]
- 23.Sun P, et al. Nickel-cobalt based aqueous flexible solid state supercapacitors with high energy density by controllable surface modification. J. Power Sources. 2019;427:56–61. [Google Scholar]
- 24.Sun P, et al. Hedgehog-inspired nanostructures for hydrogel-based all-solid-state hybrid supercapacitors with excellent flexibility and electrochemical performance. Nanoscale. 2018;10:19004–19013. doi: 10.1039/c8nr04919j. [DOI] [PubMed] [Google Scholar]
- 25.Bhujun B, Tan MTT, Shanmugam AS. Study of mixed ternary transition metal ferrites as potential electrodes for supercapacitor applications. Results Phys. 2017;7:345–353. [Google Scholar]
- 26.Sharifi S, Yazdani A, Rahimi K. Effect of Co2+ content on supercapacitance properties of hydrothermally synthesized Ni1xCoxFe2O4 nanoparticles. Mater. Sci. Semicond. Process. 2020;108:104902. [Google Scholar]
- 27.Gao H, Xiang J, Cao Y. Hierarchically porous CoFe2O4 nanosheets supported on Ni foam with excellent electrochemical properties for asymmetric supercapacitors. Appl. Surf. Sci. 2017;413:351–359. [Google Scholar]
- 28.Aparna ML, Grace AN, Sathyanarayanan P, Sahu NK. A comparative study on the supercapacitive behaviour of solvothermally prepared metal ferrite (MFe2O4, M = Fe Co, Ni, Mn, Cu, Zn) nanoassemblies. J. Alloys Compd. 2018;745:385–395. [Google Scholar]
- 29.Zhu Y, et al. Spinel NiCo2O4 for use as a high-performance supercapacitor electrode material: understanding of its electrochemical properties. J. Power Sources. 2014;267:888–900. [Google Scholar]
- 30.Vignesh V, Subramani K, Sathish M, Navamathavan R. Electrochemical investigation of manganese ferrites prepared via a facile synthesis route for supercapacitor applications. Colloids Surf. A Physicochem. Eng. Asp. 2018;538:668–677. [Google Scholar]
- 31.Elkholy AE, El-Taib Heakal F, Allam NK. Nanostructured spinel manganese cobalt ferrite for high-performance supercapacitors. RSC Adv. 2017;7:51888–51895. [Google Scholar]
- 32.Ismail FM, Ramadan M, Abdellah AM, Ismail I, Allam NK. Mesoporous spinel manganese zinc ferrite for high-performance supercapacitors. J. Electroanal. Chem. 2018;817:111–117. [Google Scholar]
- 33.Zate MK, et al. Synthesis and electrochemical supercapacitive performance of nickel–manganese ferrite composite films. J. Anal. Appl. Pyrolysis. 2015;116:177–182. [Google Scholar]
- 34.Giannozzi P, et al. QUANTUM ESPRESSO: a modular and open-source software project for quantum simulations of materials. J. Phys. Condens. Matter. 2009;21:395502. doi: 10.1088/0953-8984/21/39/395502. [DOI] [PubMed] [Google Scholar]
- 35.Vanderbilt D. Soft self-consistent pseudopotentials in a generalized eigenvalue formalism. Phys. Rev. B. 1990;41:7892–7895. doi: 10.1103/physrevb.41.7892. [DOI] [PubMed] [Google Scholar]
- 36.Perdew JP, Burke K, Ernzerhof M. Generalized gradient approximation made simple. Phys. Rev. Lett. 1996;77:3865–3868. doi: 10.1103/PhysRevLett.77.3865. [DOI] [PubMed] [Google Scholar]
- 37.Cococcioni M, de Gironcoli S. Linear response approach to the calculation of the effective interaction parameters in the LDA+U method. Phys. Rev. B. 2005;71:035105. [Google Scholar]
- 38.Momma K, Izumi F. VESTA 3 for three-dimensional visualization of crystal, volumetric and morphology data. J. Appl. Crystallogr. 2011;44:1272–1276. [Google Scholar]
- 39.Sivakami R, Dhanuskodi S, Karvembu R. Estimation of lattice strain in nanocrystalline RuO2 by Williamson–Hall and size-strain plot methods. Spectrochim. Acta A Mol. Biomol. Spectrosc. 2016;152:43–50. doi: 10.1016/j.saa.2015.07.008. [DOI] [PubMed] [Google Scholar]
- 40.Irfan H, Mohamed Racik K, Anand S. X-ray peak profile analysis of CoAl2O4 nanoparticles by Williamson–Hall and size-strain plot methods. Mod. Electron. Mater. 2018;4:31–40. [Google Scholar]
- 41.Sanpo N, Wang J, Berndt CC. Sol–gel synthesized copper-substituted cobalt ferrite nanoparticles for biomedical applications. J. Nano Res. 2013;25:110–121. doi: 10.1016/j.actbio.2012.10.037. [DOI] [PubMed] [Google Scholar]
- 42.Ehi-Eromosele CO, Ita BI, Iweala E, Adalikwu SA, Anawe PAL. Magneto-structural properties of Ni–Zn nanoferrites synthesized by the low-temperature auto-combustion method. Bull. Mater. Sci. 2015;38:1465–1472. [Google Scholar]
- 43.Bouhadouza N, et al. Structural and vibrational studies of NiAlxFe2−xO4 ferrites (0≤x≤1) Ceram. Int. 2015;41:11687–11692. [Google Scholar]
- 44.Ulpe AC, et al. Photoelectrochemistry of ferrites: theoretical predictions vs. experimental results. Zeitschrift für Physikalische Chemie. 2020;234:719–776. [Google Scholar]
- 45.Shadrokh Z, Yazdani A, Eshghi H. Solvothermal synthesis of Cu2Zn1−xFexSnS4 nanoparticles and the influence of annealing conditions on drop-casted thin films. Semicond. Sci. Technol. 2016;31:045004. [Google Scholar]
- 46.Hussein H, Yazdani A. Doping the bismuth into the host’s Cu2ZnSnS4 semiconductor as a novel material for thin film solar cell. Results Phys. 2019;12:1586–1595. [Google Scholar]
- 47.Otero-Lorenzo R, Ramos-Docampo MA, Rodríguez-González B, Comesaña-Hermo M, Salgueiriño V. Solvothermal clustering of magnetic spinel ferrite nanocrystals: a Raman perspective. Chem. Mater. 2017;29:8729–8736. [Google Scholar]
- 48.Singh S, Sahai A, Katyal SC, Goswami N. Structural, optical and vibrational study of zinc copper ferrite nanocomposite prepared by exploding wire technique. Mater. Sci. Pol. 2018;36:722–732. [Google Scholar]
- 49.Jesudoss SK, et al. Studies on the efficient dual performance of Mn1–xNixFe2O4 spinel nanoparticles in photodegradation and antibacterial activity. J. Photochem. Photobiol. B Biol. 2016;165:121–132. doi: 10.1016/j.jphotobiol.2016.10.004. [DOI] [PubMed] [Google Scholar]
- 50.Ansari MMN, Khan S. Structural, electrical and optical properties of sol-gel synthesized cobalt substituted MnFe2O4 nanoparticles. Phys. B Condens. Matter. 2017;520:21–27. [Google Scholar]
- 51.Hema E, Manikandan A, Karthika P, Antony SA, Venkatraman BR. A novel synthesis of Zn2+-doped CoFe2O4 spinel nanoparticles: structural, morphological, opto-magnetic and catalytic properties. J. Supercond. Nov. Magn. 2015;28:2539–2552. [Google Scholar]
- 52.Abrinaei F, Naseroleslami M. Nonlocal nonlinear optical response of PEGylated superparamagnetic Fe3O4 nanoparticles. Opt. Laser Technol. 2018;106:327–334. [Google Scholar]
- 53.Masoudpanah SM, Hasheminisari M, Ghasemi A. Magnetic properties and photocatalytic activity of ZnFe2−xLaxO4 nanoparticles synthesized by sol–gel autocombustion method. J. Sol–Gel Sci. Technol. 2016;80:487–494. [Google Scholar]
- 54.Pandit B, Dubal DP, Sankapal BR. Large scale flexible solid state symmetric supercapacitor through inexpensive solution processed V2O5 complex surface architecture. Electrochim. Acta. 2017;242:382–389. [Google Scholar]
- 55.Tamboli MS, et al. Mimics of microstructures of Ni substituted Mn1−xNixCo2O4 for high energy density asymmetric capacitors. Chem. Eng. J. 2017;307:300–310. [Google Scholar]
- 56.Raza W, et al. Recent advancements in supercapacitor technology. Nano Energy. 2018;52:441–473. [Google Scholar]
- 57.Hwang JY, et al. Boosting the capacitance and voltage of aqueous supercapacitors via redox charge contribution from both electrode and electrolyte. Nano Today. 2017;15:15–25. [Google Scholar]
- 58.McCurrie RA. Ferromagnetic Materials: Structure and Properties. Cambridge: Academic Press; 1994. pp. 126–127. [Google Scholar]
- 59.Szotek Z, et al. Electronic structures of normal and inverse spinel ferrites from first principles. Phys. Rev. B Condens. Matter Mater. Phys. 2006;74:1–12. [Google Scholar]
- 60.Flores AG, Raposo V, Torres L, Iñiguez J. Two-magnon processes and ferrimagnetic linewidth calculation in manganese ferrite. Phys. Rev. B Condens. Matter Mater. Phys. 1999;59:9447–9453. [Google Scholar]
Associated Data
This section collects any data citations, data availability statements, or supplementary materials included in this article.
Data Availability Statement
The datasets generated during and/or analyzed during the current study are available from the corresponding author on reasonable requests.


