Abstract
We propose an in-situ monitoring method of laser assisted ceramic additive manufacturing (AM) fabrication process using photoacoustic (PA) imaging technique. This method is potentially very practical and of low cost, as it can be easily implemented with little modification to the original AM system. A major advantage of this method is that it does not require any complex or expensive component to be installed, just need a microphone to be setup near the work-piece and a data processing program to analyse the acoustic data. By collecting the photoacoustic wave that produced by the laser scanning during the AM process, a spectrogram of the acoustic signal can be generated using short-time Fourier transform (STFT). The PA signal can be extracted by specifying the modulation frequency of the laser in the spectrogram. Combining with the scanning position of the laser beam, the PA image of the layer under processing can be obtained. Detection of two kinds of defects (metal defect and dried paste defect) have been demonstrated. Although there are many other kinds of possible defects in additive manufacturing processes, this method could be a practical and low cost way to monitor most of them with proper choice of parameters of the laser and detection system. The parameters of the system that can influence the PA image quality have also been discussed.
Keywords: Photoacoustic imaging, Ceramic additive manufacturing, In-situ monitoring
1. Introduction
Advanced ceramics are widely used and of great importance in current and future applications such as in energy, aerospace, environmental and defence industry. Comparing to traditional manufacturing method, additive manufacturing (AM) of ceramics has attracted a lot attention, not only because of the advantage of low cost of AM in small-scale manufacturing and prototyping, but also because that hard machining of complex three dimensional ceramics is both expensive and time-consuming [1-3]. As such, a lot of ceramic AM technologies have been developed, such as 3 dimensional printing (3DP), selective laser sintering (SLS), extrusion free-forming (EFF), laminated object manufacturing (LOM), etc. All of these techniques involves some kind of drying or sintering. Among them, laser is explicitly used in SLS technique, while it can also be employed in other methods for drying, binder-burnout or sintering. In this paper, we will discuss monitoring method that can be applied to the AM techniques that involves laser processing (laser assisted AM).
Although the AM tools and technology has advanced significantly in recent years, the quality insurance has always been a problem because of lack of in process monitoring and control. Inspection methods such as X-ray CT or optical tomography methods have been used to check internal part quality, but this can only be done after the part is fabricated [4]. In-situ monitoring of AM process can enable close loop control, detection of discontinuities/defects, assure quality and even help to understand the complex AM process. Most of the current in-situ monitoring technology are optical [4-6], they can be divided into several categories, including VIS/IR camera or high speed camera [7], Thermal imaging [8], interferometric (coherent or low coherent) imaging [9]. These methods usually need complex optical arrangement for illumination and beam collecting while not interfering with the AM components, especially optical components for laser assisted AM. Technology other than optical method has also been reported, such as ultrasound monitoring [10], but also need complex setup in the AM system. Laser ultrasound is another technology that uses laser to generate ultrasonic waves for on-destructive test (NDT), and its principle is similar to ultrasonic imaging, except that the generation or detection of the ultrasonic signal is from laser beams [11,12]. In this paper, we propose an easy to implement and cost effective method for in-situ monitoring of the laser assisted ceramic AM fabrication process with very little modification of a ceramic AM system, employing photoacoustic (PA) imaging technique.
PA imaging is based on PA effect, which refers to the generation of acoustic waves by modulated optical radiation [13]. Traditionally, the most common application of PA effect is for PA spectroscopy, where a PA spectrum is produced by measuring the PA signal amplitude over a range of optical excitation, which is basically a measurement of optical absorption spectrum based on acoustic signal. Other applications have also been reported such as monitoring of de-excitation processes, probing of thermos-elastic and other physical property of material, generation of mechanical motions, etc. [14]. In recent years, PA imaging and tomography have received a lot of attention, as it provides fine spatial resolution at depth beyond optical diffusion in living tissue for in-vivo imaging [15,16]. The advantage of PA imaging is that it provides fine spatial resolution, while distinguishing materials from their difference in optical absorption. In ceramic AM process, if laser drying or sintering process is involved, the part will be heated by the laser beam. If we modulate the laser beam, we will have the part generating acoustic wave according to the modulation frequency while being processed. Thus, the acoustic wave is kind of a ‘by-product’ of the fabrication process. However, we can collect this ‘by-product’ and use PA imaging technique to image the part being processed, which gives real time information of the part layer under fabrication. In this paper, we will show how this method is used for process monitoring and the detection of two kinds of defects (metal defect and dried paste defect). Although there are other kinds of defects, such as cracks and porosities, in principle they could also be detected using this method with proper choice of parameters, as long as the laser absorption property of the defects are different from the ceramic paste. To our best knowledge, this is the first work to develop a PA imaging system for AM process monitoring. Although it does not provide tomography image like in medical applications, it can provide layer by layer image information, which is valuable for monitoring of additive manufacturing process.
2. Working principle
2.1. The PA effect and signal
PA generation is generally due to PT heating effects. For direct PA generation, a semi-quantitative theory for small laser radius [14] shows that the peak PA pressure observed at distance r is
| (1) |
where P is the peak pressure, β is the linear thermal expansion coefficient, E is the laser pulse energy, α is the absorption coefficient for the material (which is a function of the laser wavelength), υ is the speed of sound, Cp is the specific heat of the material at constant pressure, and τL is the duration of the laser pulse.
From Eq. (1) we can see that, if the laser source is unchanged (meaning that laser pulse energy E and pulse duration τL are kept the same), the peak PA pressure observed at a specific distance is only affected by the material properties, namely β, α and Cp. If the property of the laser heated material has any change, or the laser pulse is hitting different materials, the peak pressure will change, and we will be able to obtain a different sound volume, while the sound pitch (frequency) will not change.
2.2. The AM system configuration
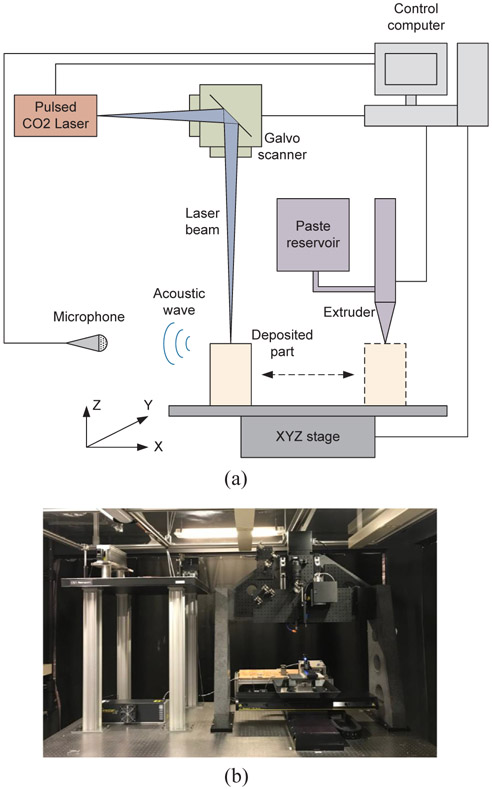
Fig. 1(a) shows the schematic of the laser assisted ceramic additive manufacturing system with Pa monitoring setup. The actual picture of the system is shown in Fig. 1(b). Let us first ignore the PA monitoring part (which is mainly a microphone connected to the control computer) and focus at the ceramic AM system. This system consists of a control computer, a ceramic paste extruder, a XYZ stage, a pulse CO2 laser (SynradFirestar V20), and a Galvo scanner (Scanlab, intelliSCAN III-14). The work-piece to be manufactured is extruded layer by layer with the extruder. After each layer is extruded, it is moved under the Galvo scanner, and sintered with a scanning CO2 laser beam. After this layer is sintered, it is moved back to the bottom of the extruder and the next layer is extruded, and then to the laser, etc. As we can see, a monitoring method to real-time characterize each layer of the part is highly desirable, so that we can find any defect during fabrication process of each layer.
Fig. 1.
(a) Schematic of the laser assisted ceramic additive manufacturing system with PA monitoring. (b) The picture of the actual system.
Here we propose a PA imaging method that utilizes the PA signal generated during the laser sintering process. With very little modification to the system, namely just set up a microphone near the manufactured part and connect it to the control computer (as shown in Fig. 1(a)), we are able to obtain the PA image of each layer in-situ.
2.3. Laser induced PA signal
The pulsed CO2 laser is controlled using PWM command with a repetition rate at 5 kHz. The PWM signal waveforms for 40% and 80% duty cycle is shown in Fig. 2. This command form means that when we change the laser power, we are only changing the duty cycle, but the repetition rate of 5 kHz remains the same. This is very important for the PA system, as the Laser power change will not affect the pitch (frequency) of the sound signal.
Fig. 2.
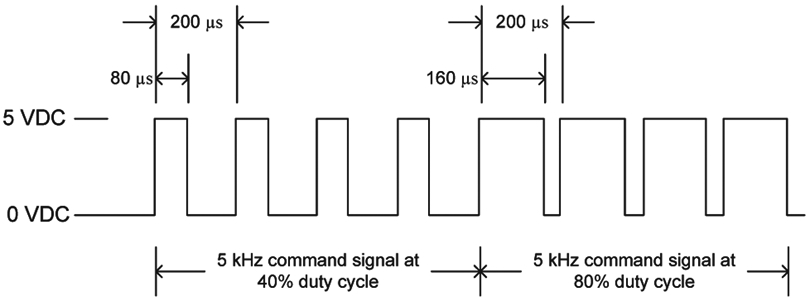
PWM waveform of the pulsed CO2 laser.
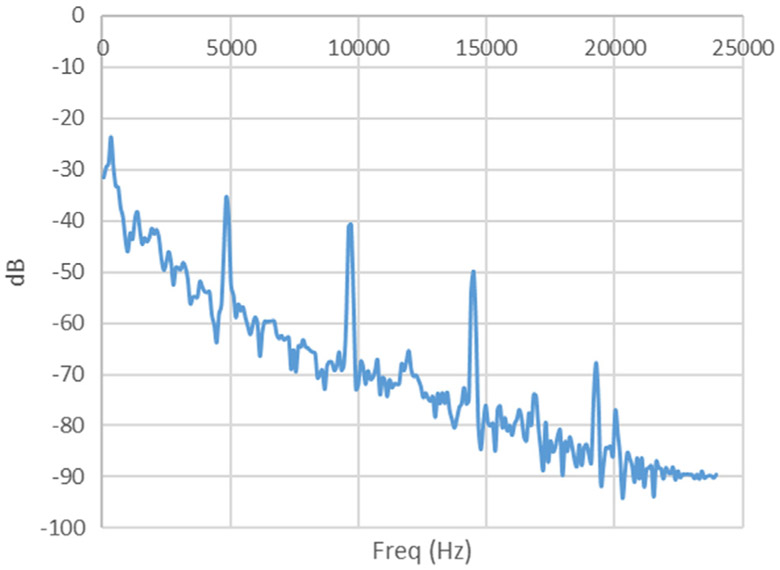
We here use the laser beam to scan on an extruded part with ceramic paste material. In this paper, the material is a kind of alumina paste that was prepared by mixing the alumina powder (A152SG Alumina, ALMATIS Inc., PA, USA) with the deionized water (DI-water) containing ammonium polyacrylate (Darvan 821A, Vanderbilt Micerals LLC., CT, USA), which was used as a dispersing agent. The volume ratio of the DI-water to the alumina powder was kept at 1. About 2 wt% of hydroxypropyl methylcellulose (HPMC) to the H2O content in the mixture was added into the obtained paste to adjust its viscosity. The laser power is set to 15% and the scanning speed is set to 20 mm/s. The acoustic signal is collected by the microphone of a cell phone (Huawei Mate 2). A section of the collected acoustic signal is analysed by FFT method, which is the average of 0.05 s long signal, with settings of 512 FFT points and Hamming window. The result is shown in Fig. 3. The reference is set to −110 dB.
Fig. 3.
Frequency components of recorded CO2 laser induced photoacoustic signal.
In the FFT analyzed acoustic signal, we can clearly observe several peaks at around 5, 10, 15 and 20 kHz. They come from the 5 kHz excitation of the CO2 laser pulses, and the higher order harmonics of the 5 kHz signal. This means that the acoustic signal mainly contains the frequency components of harmonics of 5 kHz.
3. Experiment
3.1. General process of imaging with PA signal
If we know the position of the laser beam at a certain time, and the sound peak pressure at that time, we will be able to match the sound peak pressure with the position information. As we know from Eq. (1), this will also indicate the material information at that position. This will finally provide a image according to the contrast of the material properties such as namely β, α andCp, if we combine all the sound peak pressure value with position information.
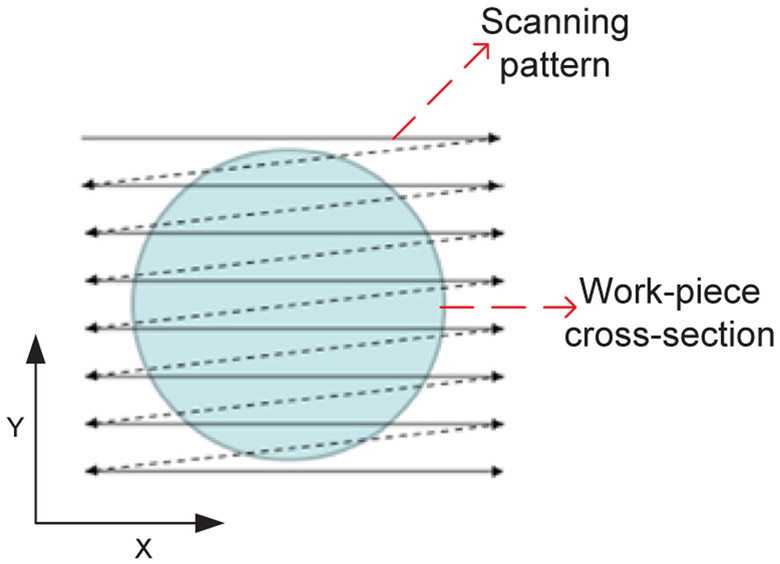
As the laser beam scanning pattern is realized by the Galvo scanner, which is in turn defined on the controlling computer, the position of the laser beam at a certain time can be easily calculated. In this experiment, the pattern used is raster scan path, which is shown in Fig. 4. In the figure, the work-piece under scanning is round shape, the scan is from left to right in the x direction when laser shutter is on (solid line with arrowhead), then the shutter goes off, and the beam position returns to the left with a y direction feed increment (dashed line with arrowhead). In most of our experiment in this paper, the laser scanning speed with shutter on is 20 mm/s, the returning speed with shutter off is 2000 mm/s, and the y direction feed increment is 0.1 mm.
Fig. 4.
Scanning path of the CO2 laser on a layer of extruded work-piece (assuming the layer of work-piece is round shape).
To obtain the sound peak pressure information as a function of time at specific frequencies, we need to calculate the spectrogram of the collected sound signal. This is done by short-time Fourier transform (STFT) of the sound data, and the result is an estimation of the short-term, time-localized frequency content of the acoustic signal, which indicate the peak sound pressure of different frequencies as a function of time.
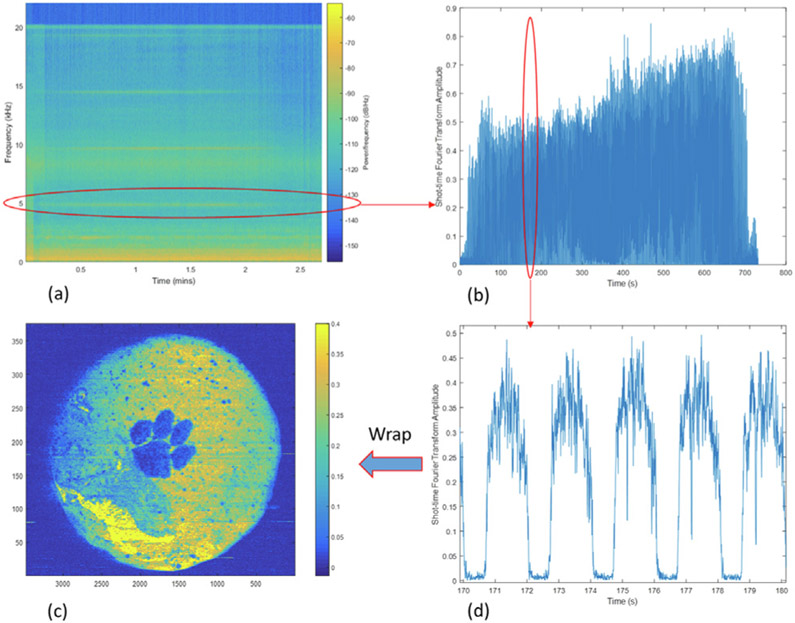
Fig. 5(a) shows the spectrogram of a complete sound data when scanning a layer of round shape work-piece with a small tiger paw pattern on it. In this figure, we can observe several horizontal ‘brighter’ lines occur at 5 kHz, 10 kHz, 15 kHz, 20 kHz, which indicate that the main acoustic signal is near these four frequencies. To extract the data out, we pick out one frequency of them, here we choose the fundamental frequency at 5 kHz. If we choose the other frequencies, the result will be very similar, because their relative magnitudes are in proportion to each other. We extract only the frequency 5 kHz data and we will obtain the STFT data (representing the peak sound pressure at 5 kHz) as a function of time. If we plot this function on time axis, we will have a curve shown in Fig. 5(b). Zoom in a small section of this figure, we can now see a quasi-periodic pattern as shown in Fig. 5(d). Because the scanned width is about 40 mm long, and the scanning speed is 20 mm/s (returning speed is much faster at 2000 mm/s), each period is about 2 s long, as shown in figure(d). In this figure, we can see that when the laser beam is hitting the work-piece, the STFT value (which indicating the sound intensity) is about 0.25 to 0.45, while when the laser beam is out of the margin of the work-piece, the STFT value is almost 0. The difference in the STFT value comes from the different material properties at different locations of the work-piece. We then combine the 5 kHz STFT function value with the position data calculated from the scanning control program, and the STFT value is wrapped up to an image as shown in Fig. 5(c). The contrast in the figure comes from the STFT value, which in turn indicating the material property difference at different locations of the work-piece.
Fig. 5.
General signal processing steps in obtaining the PA image. (a) Spectrogram of a complete sound data set when scanning a layer of work-piece. (b) Extracting only the data of 5 k Hz and plot it on time axis. (d) Zoom in view of a small section of (b). (c) Wrap up the signal in (b) according to laser scan position data, and the PA image is obtained.
3.2. Defect (metal) on the ceramic paste surface
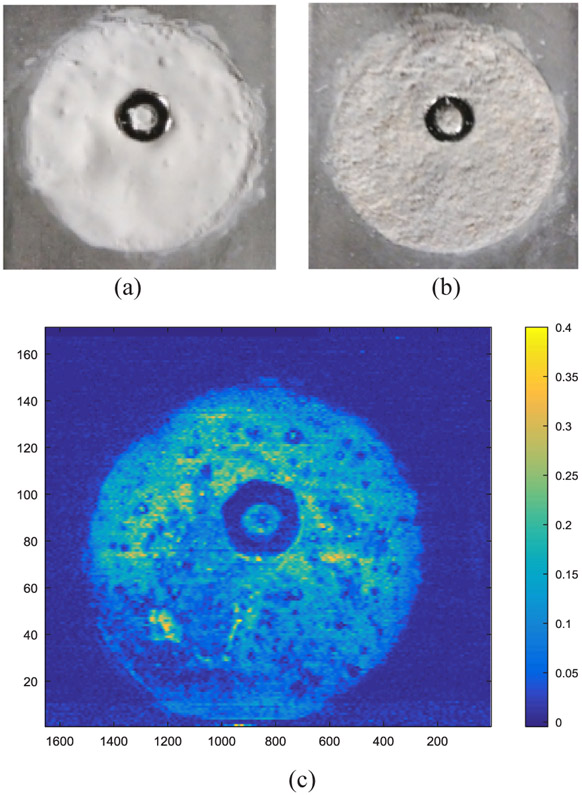
We first try to find defect on the surface of a ceramic paste layer using this method. Here we have a round shape work-piece of 20 mm outer diameter ceramic paste, and we put a metal hex nut with 3/16′ width across flats as defect on top of the paste, as shown in Fig. 6(a). This work-piece is moved under the laser scanner for CO2 laser heating process. The laser power is set to 3 W, the laser scanning speed with shutter on is 20 mm/s, the returning speed with shutter off is 2000 mm/s, and the vertical feed increment is 0.1 mm. After the laser heating, the work-piece is shown in Fig. 6(b). The acoustic signal is collected during the process, and then processed using the method proposed in Section 3.1. The resulted PA image is shown in Fig. 6(c). The unit of the x and y axis in the image is the number of points after data processing, which influences the image resolution. The detail of it will be discussed later in Section 3.6. The colour represents the value of the STFT calculation, and is indicated in the bar to the right of the image. Comparing the PA image (Fig. 6(c)) with the actual image (Fig. 6(a)), we can see that the defect (hex nut) can be clearly identified using the PA image. This experiment shows that different materials (defect) can be distinguished from the ceramic paste using PA imaging technique.
Fig. 6.
(a) Metal hex nut (as defect) on the surface of ceramic paste layer before laser scanning. (b) Metal hex nut (as defect) on the surface of ceramic paste layer after laser scanning. (c) The PA image obtained during the laser scanning process.
3.3. Scanned ceramic paste in un-scanned ceramic paste
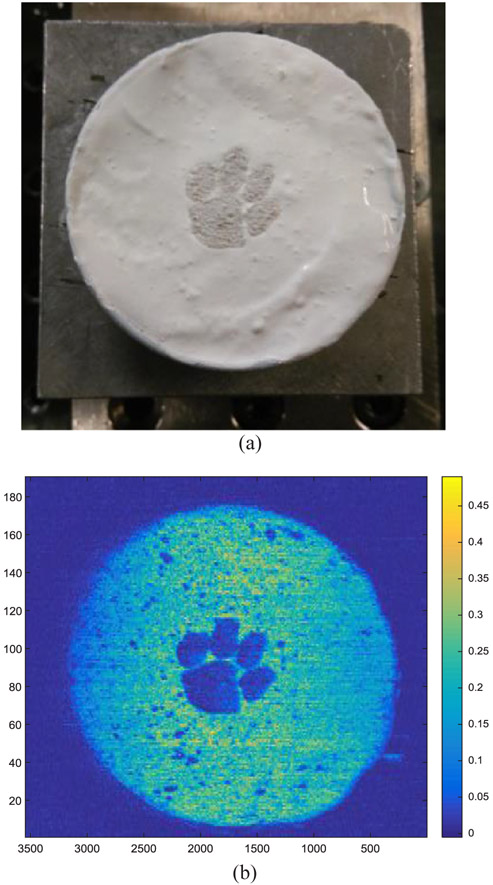
We then try to use this method to distinguish the ceramic paste that has been laser heated from the paste that has not been laser heated. A 20 mm outer diameter round shape ceramic paste is prepared, then put under the laser scanner. We first program the laser to scan a small tiger paw pattern on the paste. After this scanning, a tiger paw pattern of dried ceramic material can be observed on the wet paste, as shown in Fig. 7(a). Next, we scanned the whole work-piece under the laser beam, with the same parameters used before. After processing the collected sound signal, the resulted PA image is shown in Fig. 7(b). Comparing the PA image (Fig. 7(b)) with the actual image (Fig. 7(a)), we can see that the scanned dry ceramic pattern (tiger paw) can be clearly identified. This experiment shows that this method can distinguish laser treated ceramic paste from untreated paste.
Fig. 7.
(a) Laser scanned ‘tiger paw’ mark (as defect) in the middle of an unscanned layer of ceramic paste. (b) the PA image obtained when scan the work-piece in (a) again with CO2 laser.
3.4. Defect (metal) below the ceramic paste surface layer
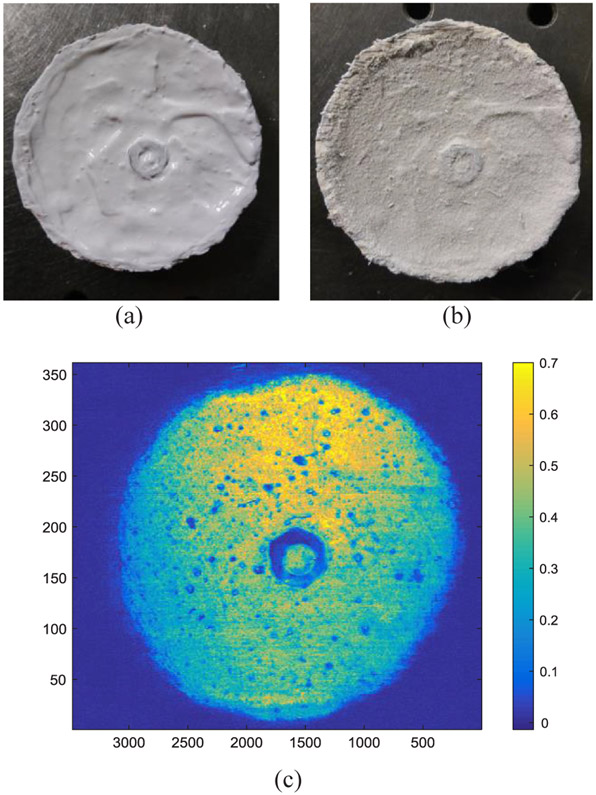
The next experiment tried to show that the defect can be still recognized after another layer of paste is covered on it. A 20 mm outer diameter round shape ceramic paste work-piece is prepared with a 3/16′ hex nut (serving as defect) on it, which is the same with the one in Section 3.2. Then another thin layer of ceramic paste is covered on it, as shown in Fig. 8(a). This work-piece is scanned under the laser and the sound signal is collected. Fig. 8(b) shows the work-piece after the laser treatment. The processed PA image is shown in Fig. 8(c). We can still identify the hex nut on the PA image, and at lower part of the hex nut, the contrast is not as big as upper part, maybe due to the fact that the covered layer at the lower part is thicker than the upper part of it. This experiment shows that even if the defect is covered by another layer of paste, it could still be identified, but the contrast of the image can be influenced by the thickness of the covered layer.
Fig. 8.
(a) Metal hex nut (as defect) below a layer of ceramic paste layer before laser scanning. (b) Metal hex nut (as defect) below a layer of ceramic paste layer after laser scanning. (c) The PA image obtained during the laser scanning process.
3.5. Sound intensity as a function of scanning parameters
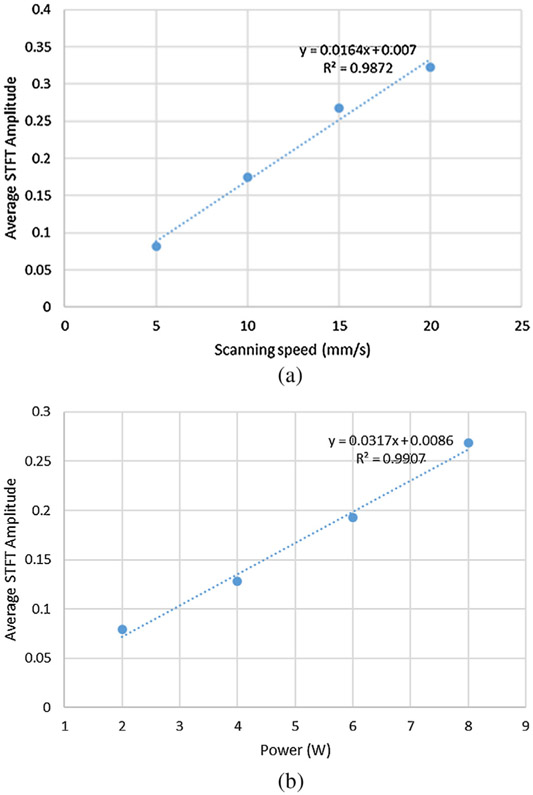
The sound intensity, represented by the STFT value at 5 kHz in the spectrogram, is a function of the material property of the ceramic paste, but will also be influenced by the laser scanning parameters, such as the laser power and the scanning speed when laser is hitting the paste. If we fix the laser power and change the scanning speed, or vice versa, the sound intensity will also change. The experiment result is shown in Fig. 9. When the laser power is fixed at 8 W, and the scanning speed is set to 5 mm/s, 10 mm/s, 15 mm/s, and 20 mm/s respectively, the average value of the STFT amplitude of the sound signal during the scan will increase almost in proportion to the scanning speed. Similarly, if we fix the scanning speed at 20 mm/s, and set the laser power to 2 W, 4 W, 6 W and 8 W respectively, the average value of the STFT amplitude of the sound signal during the scan will also increase with the power in direct proportion, as shown in Fig. 9(b).
Fig. 9.
(a) The sound intensity (represented by average STFT amplitude) at different laser scanning speed, while the laser power is fixed at B W laser power, (b) The sound intensity at different laser power, while the laser scanning speed is fixed at 20 mm/s scanning speed.
3.6. Discussion on image resolution
The image resolution is a major factor that influences the quality of the PA image. Suppose the horizontal scan is in x axis direction, and the vertical incremental feed is in y direction as shown in Fig. 4. As the image is wrapped up from the acoustic STFT signal, the image resolution in y axis is the same with the number of lines in y direction when scanning (Ny), which is determined by the total length in y and the step size of the raster scan.
The resolution in x direction actually depends on both the scanning speed of the laser, the sampling rate of the acoustic signal, and the parameters set in the STFT. The speed of the laser scan and the sampling rate determines how many data points can be collected in the acoustic signal. If the sampling rate is fixed, then the slower the scanning speed is, the longer the total scanning time will be, and hence we will obtain more data points. However, as we can see from Fig. 9(a), slower scanning speed will lead to weaker signal intensity which will reduce the SNR and harm the quality of the image. Thus, a proper scanning speed should be chosen. Once we have the acoustic data, the parameters of the STFT will determine how many data points can be obtained in the image in the x direction. If the window size and the number of overlap points in the STFT are Nwindow and Noverlap, and the total signal length is Nsignal, then the number of columns of the spectrogram data k will be
| (2) |
And this k is also the total number of data points we will obtain before wrapping up the image. If the number of lines in y direction is Ny, so the number of points in x direction in the image (Nx) will be Nx = k/Ny. From Eq. (2) we can see that k can be increased by making the window size Nwindow small, but it cannot be too small as the accuracy of the STFT will be influenced. In this paper, most of the STFT are using parameters of Nwindow = 512 and Noverlap = 256.
Besides resolution, the image quality also depends on the contrast. The contrast comes from the differences of the acoustic signal intensity, which in turn is decided by material property, laser wavelength and the sound intensity. Ceramic paste and defects have different absorption coefficients at the laser wavelength, thus produce sounds in different intensity.
4. Conclusion
In this paper, we have proposed a method for in-situ defects monitoring of the laser assisted ceramic AM fabrication process with very little modification of a ceramic AM system, employing photoacoustic imaging technique. The principle of PA imaging is discussed, the method for data processing is introduced, and the capability of detecting several kinds of defects is demonstrated. Several factors that can influence the signal and image quality have been discussed, including the scanning speed, laser power and STFT parameters. This method can obtain a complete image of the layer after each complete laser scan on the layer is finished. The main advantage of it is that almost no modification is needed for the current AM system, because a simple microphone near the work-piece and a data processing program are all that needed for this monitoring system. Although we only demonstrated two kinds of defects, other kinds of defects, such as cracks and porosities, could also be detected using this method with proper choice of parameters, as long as the laser absorption property of the defects are different from the paste. The study of crack, grain size and porosity will be carefully investigated in follow up research.
HIGHLIGHTS.
Novel photoacoustic imaging technique for laser assisted additive manufacturing is proposed.
Proof-of-concept experiments are performed and PA images are obtained.
Only a microphone is needed as additional hardware, the cost is low for this method.
Acknowledgements
This study is supported by the Department of Energy under grant DE-FE00012272.
References
- [1].Travitzky N, Bonet A, Dermeik B, Fey T, Filbert-Demut I, Schlier L, Schlordt T, Greil P, Additive manufacturing of ceramic-based materials, Adv. Eng. Mater 16 (2014) 729–754, 10.1002/adem.201400097. [DOI] [Google Scholar]
- [2].Eckel ZC, Zhou C, Martin JH, Jacobsen AJ, Carter WB, Schaedler TA, Additive manufacturing of polymer-derived ceramics, Science 80- (2015) 351 (accessed May 16, 2017). [DOI] [PubMed] [Google Scholar]
- [3].Schwentenwein M, Homa J, Additive manufacturing of dense alumina ceramics, Int. J. Appl. Ceram. Technol 12 (2015) 1–7, 10.1111/ijac.12319. [DOI] [Google Scholar]
- [4].Clijsters S, Craeghs T, Buis S, Kempen K, Kruth J-P, In situ quality control of the selective laser melting process using a high-speed, real-time melt pool monitoring system, Int. J. Adv. Manuf. Technol 75 (2014) 1089–1101, 10.1007/s00170-014-6214-8. [DOI] [Google Scholar]
- [5].Everton SK, Hirsch M, Stravroulakis P, Leach RK, Clare AT, Review of in-situ process monitoring and in-situ metrology for metal additive manufacturing, Mater. Des 95 (2016) 431–445, 10.1016/j.matdes.2016.01.099. [DOI] [Google Scholar]
- [6].Grasso M, Colosimo BM, Process defects and in situ monitoring methods in metal powder bed fusion: a review, Meas. Sci. Technol 28 (2017) 044005, 10.1088/1361-6501/aa5c4f. [DOI] [Google Scholar]
- [7].Abdelrahman M, Reutzel EW, Nassar AR, Starr TL, Flaw detection in powder bed fusion using optical imaging, Addit. Manuf 15 (2017) 1–11, 10.1016/j.addma.2017.02.001. [DOI] [Google Scholar]
- [8].Dinwiddie RB, Dehoff RR, Lloyd PD, Lowe LE, Ulrich JB, Thermographic in-situ process monitoring of the electron-beam melting technology used in additive manufacturing, in: Stockton GR, Colbert FP (Eds.), International Society for Optics and Photonics, 2013, p. 87050K. [Google Scholar]
- [9].Neef A, Seyda V, Herzog D, Emmelmann C, Schönleber M, Kogel-Hollacher M, Low coherence interferometry in selective laser melting, Phys. Procedia 56 (2014) 82–89, 10.1016/J.PHPRO.2014.08.100. [DOI] [Google Scholar]
- [10].Rieder H, Dillhöfer A, Spies M, Bamberg J, Hess T, Ultrasonic online monitoring of additive manufacturing processes based on selective laser melting, AIP Conf. Proc 2015, pp. 184–191. [Google Scholar]
- [11].Scruby CB, Drain LE, Laser ultrasonics: techniques and applications, CRC Press, New York, 1990. [Google Scholar]
- [12].Pétillon O, Dupuis JP, David D, Voillaume H, Trétout H, Laser Ultrasonics: A Non Contacting NDT System, in: Thompson DO, Chimenti DE (Eds.), Rev. Prog. Quant. Nondestruct. Eval vol. 14, Springer, US, Boston, MA, 1995, pp. 1189–1195. [Google Scholar]
- [13].Sigrist MW, Laser generation of acoustic waves in liquids and gases, J. Appl. Phys 60 (1986) R83–R122, 10.1063/1.337089. [DOI] [Google Scholar]
- [14].Tam AC, Applications of photoacoustic sensing techniques, Rev. Mod. Phys 58 (1986) 381–431, 10.1103/RevModPhys.58.381. [DOI] [Google Scholar]
- [15].Xu M, Wang LV, Photoacoustic imaging in biomedicine, Rev. Sci. Instrum 77 (2006) 041101, 10.1063/1.2195024. [DOI] [Google Scholar]
- [16].Wang LV, Hu S, Photoacoustic tomography: in vivo imaging from organelles to organs, Science 335 (2012) 1458–1462, 10.1126/science.1216210. [DOI] [PMC free article] [PubMed] [Google Scholar]


