

Abstract
Background
Evidence suggests high-volume facilities achieve better rectal cancer outcomes.
Methods
Logistic regression was used to evaluate association of facility type with treatment after adjusting for patient demographics, stage and co-morbidities. SEER-Medicare beneficiaries who were diagnosed with stage II/III rectal adenocarcinoma at age ≥66 years from 2005–2009 and had Parts A/B Medicare coverage for ≥1 year pre- and post-diagnosis plus a claim for cancer-directed surgery were included. Institutions were classified according to National Cancer Institute (NCI)-designation, presence of residency program, or medical school affiliation.
Results
2,300 subjects (average age=75) met criteria. Greater proportions of those treated at NCI-designated facilities received transrectal ultrasound (TRUS) or magnetic resonance imaging (MRI)-pelvis (62.1% vs. 29.9%), neoadjuvant chemotherapy (63.9% vs. 41.8%), and neoadjuvant radiation (70.8% vs. 46.3%), all p<.0001. On multivariate analysis, odds ratios (95% confidence intervals) for receiving TRUS or MRI, neoadjuvant chemotherapy, or neoadjuvant radiation among beneficiaries treated at NCI-designated facilities were 3.51 (2.60–4.73), 2.32 (1.71–3.16), and 2.66 (1.93–3.67), respectively. Results by residency and medical school affiliation were similar in direction to NCI-designation.
Conclusions
Those treated at hospitals with an NCI-designation, residency program, or medical school affiliation received more guideline-concordant care. Initiatives involving provider education and virtual tumor boards may improve care.
Keywords: Rectal Cancer, Surveillance, Epidemiology, and End Results, Medicare, Guideline-Concordant Care
Introduction
Many rectal cancer patients are operated on at low-volume hospitals, with low volume being variably defined as anywhere from <2 to <150 rectal resections/year [1–3]. Analyses of Cancer Care Outcomes Research and Surveillance (CanCORS) surgeon survey data found among surgeons treating patients with colorectal cancer, the mean number of resections per month was 3.1; <50% were likely to be rectal resections. Furthermore, colorectal surgeons and surgical oncologists were more likely than general surgeons to report high volumes of colorectal cancer resections (≥5 resections per month) [4].
Some studies have shown better outcomes for patients treated by higher volume surgeons [3,5–7] and hospitals [3,5–6]. However, findings have been inconsistent [3,8–9], and major reviews are based on patients treated in the 1990s, prior to widespread use of more advanced surgical techniques, such as total mesorectal excision (TME). Given that mechanisms underlying possible volume-outcome relationships have not been fully elucidated, we examined differences in intermediary measures that act as quality of care indicators and should, based on best available data, translate into the best outcomes. These measures included: 1) guideline-concordant clinical staging with transrectal (or endorectal) ultrasound (TRUS) or magnetic resonance imaging (MRI) of the pelvis, computed tomography (CT) of the chest, abdomen, and pelvis, and carcinoembryonic antigen (CEA) testing prior to treatment; and 2) guideline-concordant treatment of stages II/III rectal cancer with neoadjuvant chemoradiation and total mesorectal excision (TME) [10]. We evaluated utilization of recommended staging and treatment for Medicare beneficiaries with American Joint Commission on Cancer Stage II/III rectal cancer, and examined the impact of patient and hospital characteristics on receipt of guideline-concordant care.
Materials and Methods
Data Sources
We conducted a retrospective analysis of Medicare beneficiaries residing in Surveillance, Epidemiology, and End Results (SEER) regions diagnosed with Stage II/III rectal cancer using SEER-Medicare data. The National Cancer Institute’s (NCI) SEER program collects information from eighteen registries covering 28% of the United States (U.S.) population, while Medicare is a federally-funded program that provides health insurance to 97% of people age ≥65 in the U.S [11].
The following SEER-Medicare files were used to define the study population and derive key variables: Patient Entitlement and Diagnosis Summary File (PEDSF), Medicare Provider Analysis and Review (MEDPAR) File, Medicare Outpatient File, National Claims History (NCH), Durable Medical Equipment (DME), Home Health Agency (HHA) and Part D Event (PDE) files, along with the Hospital Provider file [11].
Study Population
Figure 1 displays inclusion/exclusion criteria. Included subjects were diagnosed with histologically confirmed stage II or III rectal adenocarcinoma (C209) between 2005–2009 (with known month of diagnosis), age ≥66 (to ensure one year of previous claims information), not diagnosed at death or autopsy, continuously enrolled in Parts A and B Medicare Fee-For-Service plans for ≥1 year prior to diagnosis (for identification of co-morbidities) through one year post-diagnosis or until death, have no previous cancers, have no subsequent cancers within one year of rectal cancer diagnosis, live ≥90 days post-diagnosis (to ensure opportunity to receive treatment) and have a MEDPAR facility claim for rectal cancer-directed surgery identified by our algorithm (Online Only Table 1).
Figure 1.
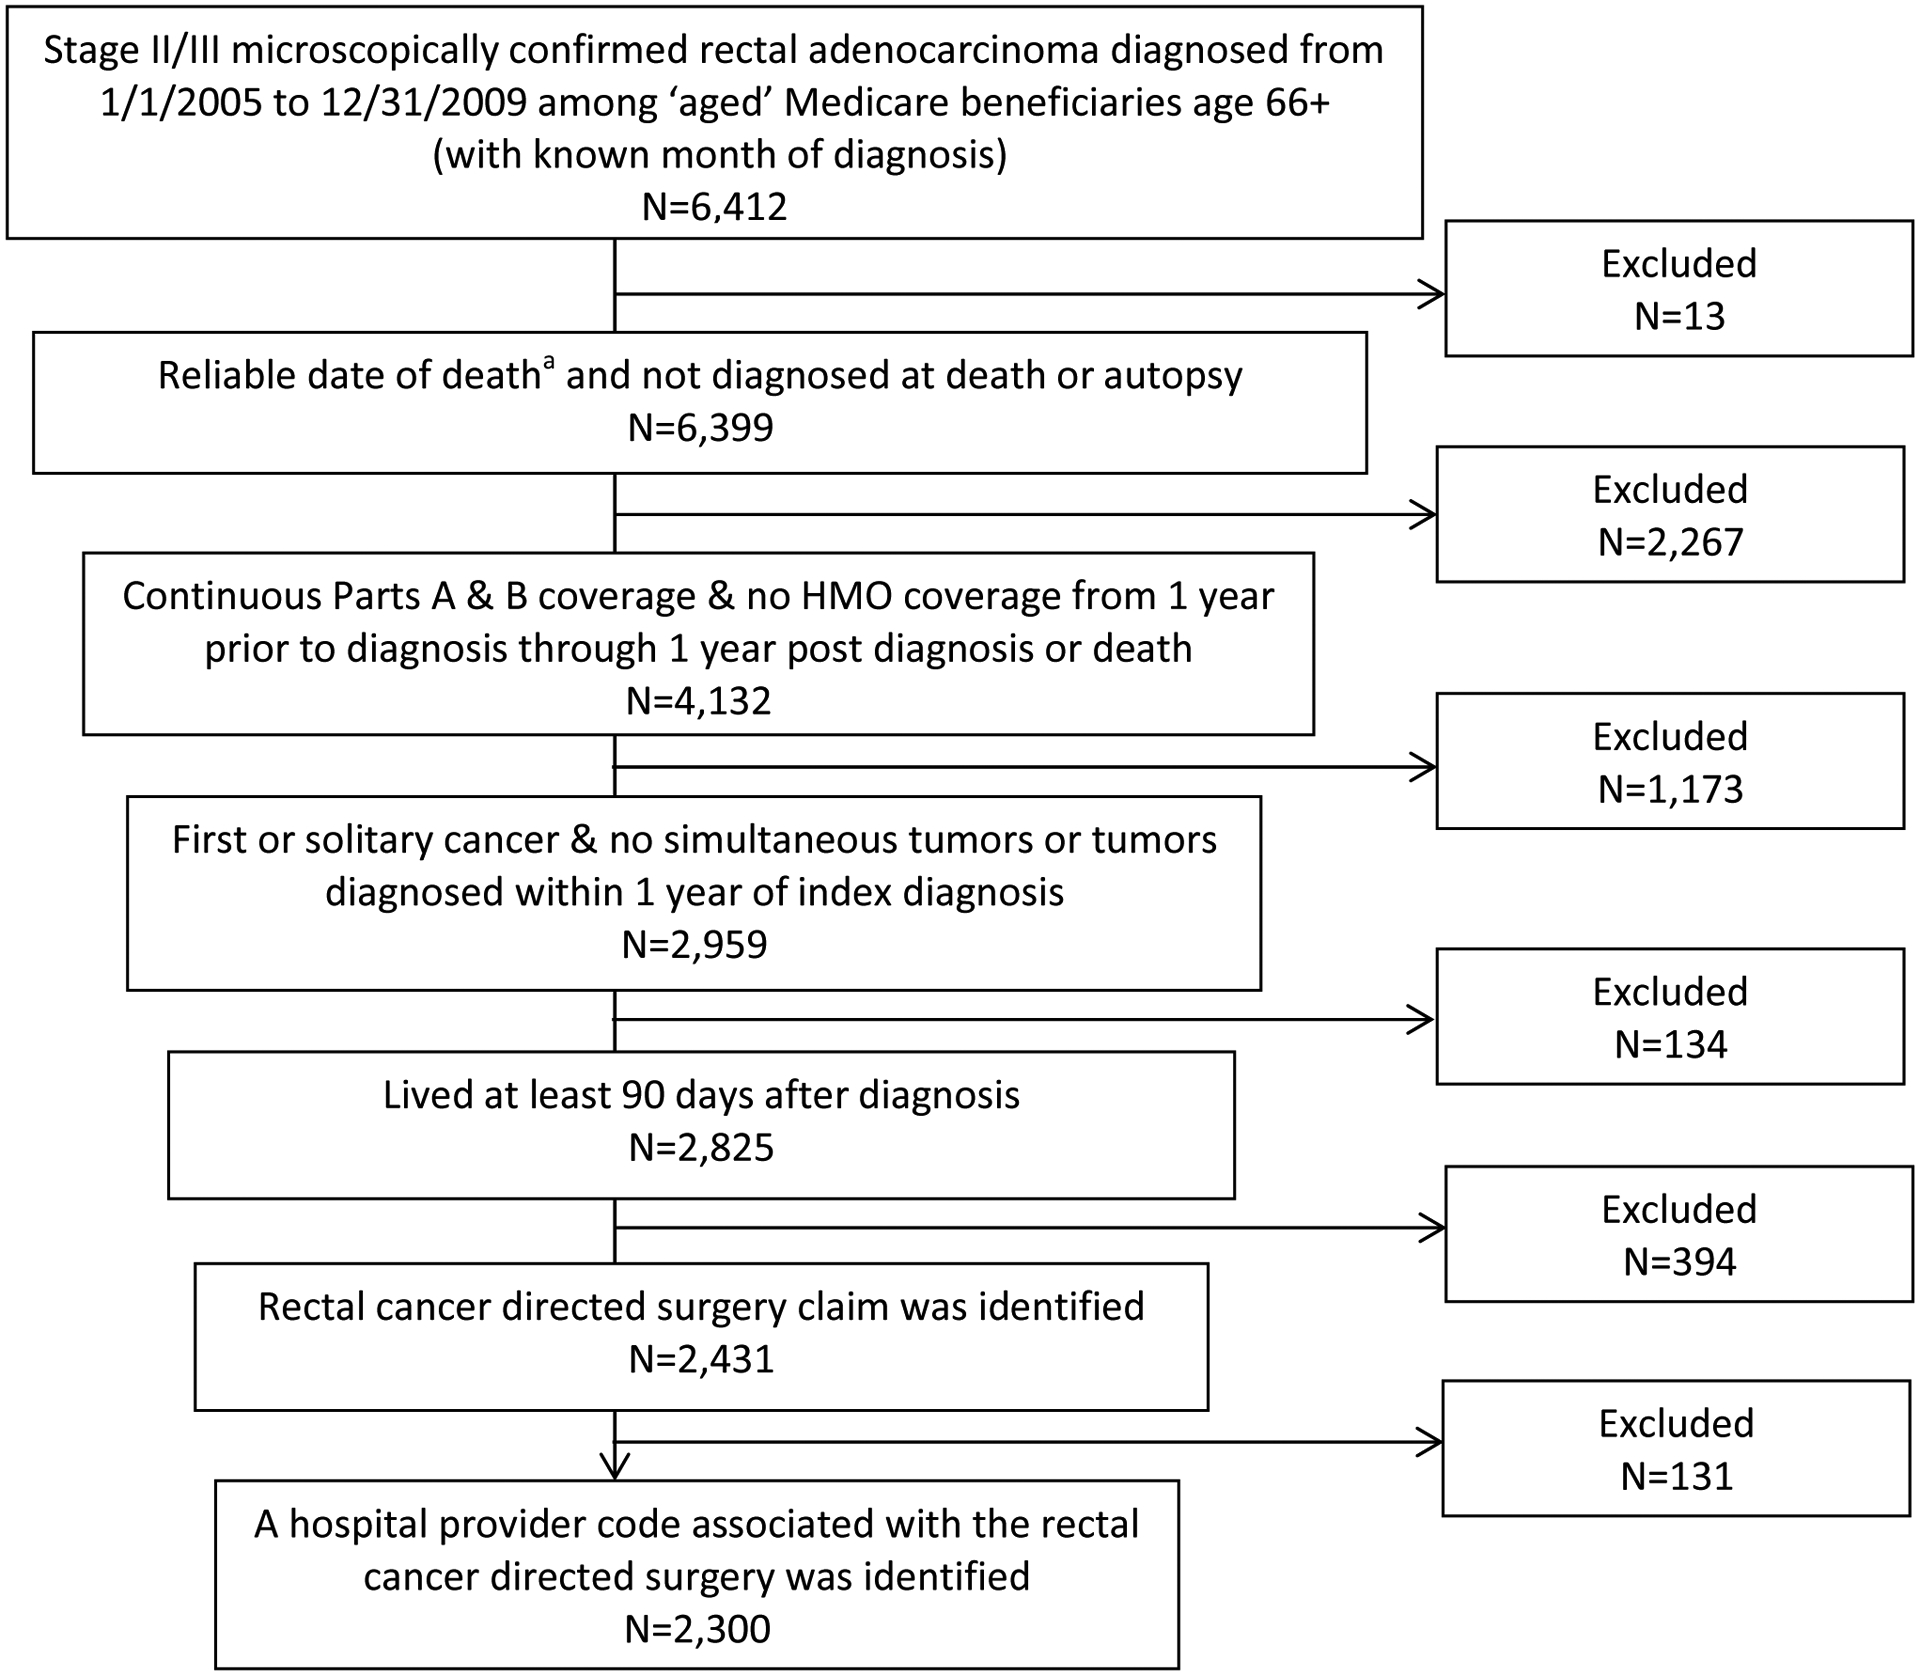
Flowchart of study population
a The date of death was considered unreliable if the subject died before cancer diagnosis or if death was reported in the SEER data but not the Medicare data.
Study Variables
Age, gender, race, marital status, cancer stage, and month/year of diagnosis were extracted from the PEDSF. Date of birth and cancer diagnosis were assigned as the first day of their respective months because only year and month were available. Subjects were classified as residing in rural or urban areas based on Rural–Urban Commuting Area (RUCA) categories of their ZIP code [12]. Co-morbidities were determined by applying the modified Charlson algorithm to inpatient, outpatient, and professional Medicare claims occurring one year prior to diagnosis [13,14]. Surgery for obstruction or perforation was defined based on the following ICD-9 diagnosis codes occurring during hospitalization for rectal cancer directed surgery: 560.89, 560.9, 569.83 [8]. Local excision or destruction were defined with the following codes: CPT code 45170 or 45190 and/or ICD-9 procedure code 48.3, with no other codes indicating more extensive surgery present.
The treating facility was the hospital where the beneficiary received their first cancer-directed surgery. Hospitals were categorized as an NCI-designated cancer center (NCI-DCC) if they achieved a clinical or comprehensive cancer center designation during the study period. Hospitals were also categorized as having a residency program (RP) and by extent of medical school affiliation (MSA): major, limited, or none. These categorizations were derived from the Hospital File based on data submitted to the Centers for Medicare and Medicaid Services in the Healthcare Cost Reports and the Provider of Service survey.
Online Only Table 1 lists the codes and files used to identify imaging, CEA testing, surgery, chemotherapy and radiation. Use of the following imaging or pre-treatment studies were examined from the month prior to diagnosis through the first date of radiation, chemotherapy, or surgery: TRUS, MRI-pelvis, MRI-abdomen, CT-pelvis, CT-abdomen, CT-chest, x-ray-chest, and CEA testing. Positron emission tomography (PET), which is not guideline recommended for staging, was examined as a potential marker of over-utilization. Sphincter preservation, receipt of chemotherapy, and receipt of radiation were examined from diagnosis through one year post-diagnosis. Receipt of chemotherapy and radiation was categorized in the following non-mutually exclusive ways: 1) any vs. none; 2) neoadjuvant vs. adjuvant. Pre-treatment variables, including CEA test, TRUS, MRI, CT, and PET, were identified in the NCH or Outpatient files using CPT codes. Surgery was identified from CPT or ICD-9 procedure codes in the NCH, Outpatient, and MEDPAR files, as well as by SEER Primary Site Surgery Codes in the PEDSF file. Surgeries were classified as sphincter preserving vs. non-sphincter preserving using a hierarchical algorithm; professional CPT codes from the NCH file were considered the best source of information when available, followed by a combination of SEER surgery codes and ICD-9 procedure codes. Radiation was identified from the NCH, Outpatient, and MEDPAR files and chemotherapy was identified from the NCH, Outpatient, MEDPAR, HHA, DME, and PDE files.
Statistical Analysis
Global Pearson’s chi-square tests for independence were used to assess differences between groups in bivariate analyses. Logistic regression was used to determine the association between hospital characteristics and receipt of pre-treatment or treatment services after adjusting for patient factors. Models were adjusted for all variables listed in Table 1 except obstruction and local excision/destruction. All statistical tests were two-sided with a P-value of <.05 considered statistically significant. This study was approved by the University of Iowa Institutional Review Board.
Table 1.
Characteristics of Medicare recipients with Stage II/III rectal adenocarcinoma by hospital type
| Overall Population | NCI Designation | Resident Programa | Medical School Affiliationa | |||||||||
|---|---|---|---|---|---|---|---|---|---|---|---|---|
| Yes | No | P* | Yes | No | P* | Major | Limited | None | P* | |||
| N | 2,300 | 219 | 2,081 | 1,229 | 1,070 | 613 | 571 | 1,115 | ||||
| Age | Mean(SD) | 75.7(6.6) | 74.2(5.9) | 75.7(6.7) | .0013 | 75.6(6.6) | 75.5(6.7) | .59 | 75.4(6.6) | 75.7(6.5) | 75.6(6.7) | .71 |
| 66–69 | 525 (22.8%) | 30.6% | 22.0% | .02 | 23.2% | 22.3% | .03 | 24.8% | 21.7% | 22.2% | .47 | |
| 70–74 | 598 (26.0%) | 25.1% | 26.1% | 24.0% | 28.3% | 23.7% | 25.4% | 27.6% | ||||
| 75–79 | 527 (22.9%) | 22.8% | 22.9% | 24.9% | 20.7% | 24.3% | 23.3% | 22.0% | ||||
| 80+ | 650 (28.3%) | 21.5% | 29.0% | 27.9% | 28.7% | 27.2% | 29.6% | 28.2% | ||||
| Gender | Female | 1,096 (47.7%) | 41.6% | 48.3% | .06 | 48.7% | 46.5% | .31 | 46.2% | 51.7% | 46.5% | .09 |
| Stage | II (vs. III) | 1,048 (45.6%) | 44.8% | 45.7% | .79 | 46.5% | 44.5% | .34 | 45.8% | 46.4% | 44.9% | .83 |
| Charlson Count | 0 | 1,350 (58.7%) | 60.3% | 58.5% | .55 | 58.3% | 59.2% | .79 | 58.4% | 58.7% | 58.8% | .99 |
| 1 | 598 (26.0%) | 26.9% | 25.9% | 26.0% | 26.1% | 26.4% | 25.6% | 26.6% | ||||
| 2+ | 352 (15.3%) | 12.8% | 15.6% | 15.8% | 14.8% | 15.2% | 15.8% | 15.2% | ||||
| Surgery for Obstruction | Yes | 60 (2.6%) | -- | -- | .23 | 2.5% | 2.7% | .81 | 2.3% | 3.2% | 2.5% | .62 |
| Local Excision or Destruction | Yes | 46 (2.0%) | -- | -- | .18 | 2.3% | 1.7% | .31 | -- | -- | -- | .10 |
| Raceb | White | 1,947 (84.7%) | 84.0% | 84.7% | .35 | 84.0% | 85.4% | .19 | 83.7% | 84.1% | 85.5% | .15 |
| Asian | 105 (4.6%) | 6.4% | 4.4% | 4.2% | 5.0% | 3.8% | 4.2% | 5.2% | ||||
| Other/Unknown | 248 (10.8%) | 9.6% | 10.9% | 11.8% | 9.6% | 12.6% | 11.7% | 9.3% | ||||
| Marital Statusc | Single | 259 (11.3%) | 9.1% | 11.5% | .21 | 11.2% | 11.3% | .61 | 13.2% | 9.6% | 11.0% | .03 |
| Married | 1,210 (52.6%) | 58.0% | 52.0% | 51.5% | 53.9% | 51.6% | 50.3% | 54.4% | ||||
| Divorced | 192 (8.3%) | 9.6% | 8.2% | 8.8% | 7.8% | 7.0% | 11.4% | 7.4% | ||||
| Widowed | 639 (27.8%) | 23.3% | 28.3% | 28.5% | 27.0% | 28.2% | 28.7% | 27.1% | ||||
| Ruralitya | Rural (vs. urban) | 444 (19.3%) | 17.8% | 19.5% | .55 | 15.5% | 23.7% | <.0001 | 12.9% | 19.5% | 22.8% | <.0001 |
| Registryd (Row %) | Detroit | 148 (6.4%) | -- | -- | -- | 84.5% | 15.5% | <.0001 | 83.1%e | 16.9% | <.0001 | |
| Connecticut | 153 (6.7%) | -- | -- | 85.6% | 14.4% | 82.4% | 17.7% | |||||
| Iowa | 124 (5.4%) | -- | -- | 83.1% | 16.9% | 66.1% | 33.9% | |||||
| New Jersey | 359 (15.6%) | -- | -- | 70.8% | 29.3% | 62.1% | 37.9% | |||||
| San Jose | 47 (2.0%) | -- | -- | 53.2% | 46.8% | 59.6% | 40.4% | |||||
| New Mexico | 43 (1.9%) | -- | -- | 53.5% | 46.5% | 58.1% | 41.9% | |||||
| Seattle | 120 (5.2%) | -- | -- | 45.8% | 54.2% | 49.2% | 50.8% | |||||
| Kentucky | 166 (7.2%) | -- | -- | 43.4% | 56.6% | 51.2% | 48.8% | |||||
| San Francisco | 93 (4.0%) | -- | -- | 50.5% | 49.5% | 49.5% | 50.5% | |||||
| Los Angeles | 177 (7.7%) | -- | -- | 56.5% | 43.5% | 43.5% | 56.5% | |||||
| Utah | 40 (1.7%) | -- | -- | 55.0% | 45.0% | 42.5% | 57.5% | |||||
| Louisiana | 143 (6.2%) | -- | -- | 32.9% | 67.1% | 42.0% | 58.0% | |||||
| Greater California | 439 (19.1%) | -- | -- | 34.0% | 66.0% | 34.3% | 65.8% | |||||
| Georgia | 248 (10.8%) | -- | -- | 30.7% | 69.4% | 33.5% | 66.5% | |||||
1 missing Resident program and med school affiliation; 4 missing rural/urban status.
African Americans were combined with other/unknown due to small cell sizes when stratified by facility (~6% overall were African American).
Those with unknown marital status were combined with single subjects due to small cell sizes by facility (~3% overall were unknown).
Hawaii combined with Greater California; Atlanta and Rural Georgia combined with Greater Georgia due to small numbers;
Major and Limited Medical School Affiliation Categories combined.
P values calculated using a two-sided Pearson Chi-Square test; -- Data suppressed due to small numbers.
Results
Characteristics of the study population by hospital type are presented in Table 1. The 2,300 subjects meeting all study criteria had an average age of 76; 52.3% were male, and 45.6% had stage II disease vs. 54.4% with stage III. Over half (58.7%) had no co-morbid conditions identified by the modified Charlson algorithm, 26.0% had one condition, and 15.3% had two or more. NCI-DCCs treated 9.5% of patients, while 53.4% were treated at a facility with an RP, and 26.7% and 24.8% at a facility with a major or limited MSA, respectively.
There were no statistically significant differences between patient characteristics by presence of an RP at the treating facility or by extent of MSA, with the exception that higher proportions of urban patients received surgery at hospitals with RPs and major MSAs compared to rural patients, and a slightly higher proportion of those who received surgery at hospitals with RPs were over age 75 compared to those who had surgery at hospitals without RPs. Conversely, those treated at NCI-DCCs were younger than those treated at non-designated facilities.
Table 1 also displays the row percent of cases and the global Pearson’s chi-square p-value by SEER Registry and by RP and MSA (major and limited affiliations combined). Due to small numbers, patients by registry and NCI-DCC status could not be displayed, and some registries had to be combined with those in geographic proximity. There was wide variation in the proportion of cases receiving surgery at an RP or MSA facility by Registry, ranging from >80% of cases in Detroit and Connecticut to approximately 30% in Georgia. Hospitals categorized as being an NCI-DCC or having an RP or MSA had approximately twice the average number of beds and discharges compared to those with no NCI-DCC designation, RP, or MSA (data not shown).
Pre-treatment imaging, CEA test, and treatment received by hospital type are presented in Table 2. Sixty-two percent of those who received surgery at an NCI-DCC had MRI or TRUS compared to 29.9% in non-designated facilities (p<0.0001). Results were similar for RP or MSA. Pelvic CT receipt was similar across facility types (84.4% overall), though small differences reached statistical significance by presence of RP and MSA. Differences between facility types in receipt of chest CT or chest X-ray were not statistically significant. CEA testing was performed statistically significantly more often among patients treated in facilities classified as NCI-DCC (71.7% vs. 55.2%; p<0.0001), or having an RP or MSA compared to those who were not.
Table 2.
Number (%) of subjects receiving staging and treatment by facility classification
| Overall Population | NCI Designation | Resident Program | Medical School Affiliation | ||||||||
|---|---|---|---|---|---|---|---|---|---|---|---|
| Yes | No | P* | Yes | No | p* | Major | Limited | None | p* | ||
| N | 2,300 | 219 | 2,081 | 1,229 | 1,070 | 613 | 571 | 1,115 | |||
| Clinical Staging | |||||||||||
| TRUS or Pelvic MRI | 758 (33.0) | 136 (62.1) | 622 (29.9) | <.0001 | 482 (39.2) | 276 (25.8) | <.0001 | 285 (46.5) | 175 (30.6) | 298 (26.7) | <.0001 |
| Pelvic CT | 1,942 (84.4) | 194 (88.6) | 1,748 (84.0) | .07 | 1,056 (85.9) | 885 (82.7) | .03 | 547 (89.2) | 482 (84.4) | 912 (81.8) | .0002 |
| PET | 432 (18.8) | 58 (26.5) | 374 (18.0) | .0022 | 243 (19.8) | 188 (17.6) | .18 | 129 (21.0) | 109 (19.1) | 193 (17.3) | .16 |
| Abdominal CT or MRI | 1,973 (85.8) | 199 (90.9) | 1,774 (85.2) | .02 | 1,075 (87.5) | 897 (83.8) | .01 | 556 (90.7) | 489 (85.6) | 927 (83.1) | <.0001 |
| Chest CT or X-ray | 1,707 (74.2) | 168 (76.7) | 1,539 (74.0) | .37 | 910 (74.0) | 796 (74.4) | .85 | 461 (75.2) | 415 (72.7) | 830 (74.4) | .59 |
| CEA Test | 1,306 (56.8) | 157 (71.7) | 1,149 (55.2) | <.0001 | 734 (59.7) | 571 (53.4) | .0021 | 370 (60.4) | 330 (57.8) | 605 (54.3) | .04 |
| Chemotherapy | |||||||||||
| Received neoadjuvant chemotherapy | 1,010 (43.9) | 140 (63.9) | 870 (41.8) | <.0001 | 586 (47.7) | 424 (39.6) | 0.0001 | 312 (50.9) | 247 (43.3) | 451 (40.4) | 0.0001 |
| Received any chemotherapy | 1,645 (71.5) | 183 (83.6) | 1,462 (70.3) | <.0001 | 892 (72.6) | 752 (70.3) | 0.22 | 453 (73.9) | 404 (70.8) | 787 (70.6) | .31 |
| % neoadjuvant among those who received any chemotherapy | 61.4 | 76.5 | 59.5 | <.0001 | 65.7 | 56.4 | 0.0001 | 68.9 | 61.1 | 57.3 | 0.0003 |
| Radiation Therapy | |||||||||||
| Received neoadjuvant radiation | 1,119 (48.7) | 155 (70.8) | 964 (46.3) | <.0001 | 655 (53.3) | 463 (43.3) | <.0001 | 354 (57.7) | 274 (48.0) | 490 (43.9) | <.0001 |
| Received any radiation | 1,616 (70.3) | 180 (82.2) | 1,436 (69.0) | <.0001 | 880 (71.6) | 735 (68.7) | .13 | 457 (74.6) | 396 (69.4) | 762 (68.3) | .02 |
| % neoadjuvant among those who received any radiation | 69.2 | 86.1 | 67.1 | <.0001 | 74.4 | 63.0 | <.0001 | 77.5 | 69.2 | 64.3 | <.0001 |
| Sphincter Preserving Surgery | 1,562 (67.9) | 150 (68.5) | 1,412 (67.9) | .85 | 848 (69.0) | 714 (66.7) | .24 | 429 (70.0) | 381 (66.7) | 752 (67.4) | .43 |
P values calculated using a two-sided Pearson Chi-Square test.
A statistically significantly higher proportion of patients who received surgery at facilities categorized as an NCI-DCC or as having an RP or MSA received neoadjuvant chemotherapy and radiation. Major MSA facilities had a higher proportion receiving neoadjuvant chemotherapy or radiation (50.9% and 57.7%, respectively) than limited MSA facilities (43.3% and 48.0%, respectively) and non-MSA facilities (40.4% and 43.9%, respectively). Differences were greatest between those who received surgery at an NCI-DCC vs. those who did not (neoadjuvant chemotherapy: 63.9% vs. 41.8%, p<.0001; neoadjuvant radiation: 70.8% vs. 46.3%, p<.0001). A higher proportion of those treated at NCI-DCCs received chemotherapy and radiation at any point during treatment. While statistically significantly more patients treated at a facility with an MSA received any radiation therapy, no differences were seen by RP affiliation or MSA for chemotherapy receipt. There was no difference in the proportion receiving sphincter-preserving surgery by facility type (67.9% overall).
On multivariate analysis (Table 3), odds of receiving recommended staging studies were greater among those treated in facilities categorized as NCI-DCCs or having an RP or major MSA after adjusting for age, gender, race, marital status, Charlson co-morbidity count, rurality and registry. Differences by NCI-DCC were most pronounced. Patients treated at NCI-DCCs were statistically significantly more likely to receive TRUS or pelvic MRI, pelvic CT, and abdominal CT or MRI (Odds Ratio (OR), 95% Confidence Interval (CI): 3.51, 2.60–4.73; 1.57, 1.01– 2.45; 1.80, 1.10–2.93, respectively). Odds of receiving PET, which is not formally recommended for rectal cancer staging, were also higher among NCI-DCCs (OR: 1.52, 95% CI: 1.08–2.12). There were no differences by facility type in odds of receiving chest imaging by CT or X-ray.
Table 3.
Odds of receiving selected rectal cancer pre-treatment and treatment services by hospital characteristics, adjusted for patient characteristics*
| NCI Designation | Resident Program | Medical School Affiliation | ||||||
|---|---|---|---|---|---|---|---|---|
| Yes vs. No | Yes vs. No | Major vs. None | Limited vs. None | |||||
| Service | ORa | 95% CIa | ORa | 95% CIa | ORa | 95% CIa | ORa | 95% CIa |
| Clinical Staging | ||||||||
| TRUS or Pelvic MRI | 3.51 | 2.60–4.73 | 1.75 | 1.44–2.14 | 2.19 | 1.75–2.74 | 1.20 | 0.94–1.52 |
| Pelvic CT | 1.57 | 1.01–2.45 | 1.18 | 0.92–1.52 | 1.68 | 1.23–2.31 | 1.16 | 0.87–1.55 |
| PET | 1.52 | 1.08–2.12 | 1.37 | 1.08–1.73 | 1.41 | 1.08–1.86 | 1.33 | 1.01–1.75 |
| Abdominal CT or MRI | 1.80 | 1.10–2.93 | 1.20 | 0.93–1.55 | 1.72 | 1.24–2.40 | 1.15 | 0.85–1.54 |
| Chest CT or X-ray | 1.28 | 0.91–1.79 | 1.00 | 0.81–1.23 | 1.07 | 0.84–1.37 | 0.92 | 0.72–1.17 |
| Any imaging above | 2.30 | 0.82–6.42 | 1.03 | 0.64–1.64 | 1.15 | 0.65–2.04 | 0.95 | 0.55–1.61 |
| CEA Test | 1.90 | 1.39–2.61 | 1.38 | 1.15–1.66 | 1.34 | 1.08–1.67 | 1.18 | 0.95–1.47 |
| Chemotherapy | ||||||||
| Any chemotherapy received | 1.79 | 1.20–2.69 | 1.14 | 0.92–1.43 | 1.18 | 0.91–1.54 | 1.02 | 0.79–1.31 |
| Neoadjuvant chemotherapy received | 2.32 | 1.71–3.16 | 1.45 | 1.20–1.75 | 1.52 | 1.21–1.90 | 1.15 | 0.92–1.44 |
| Radiation Therapy | ||||||||
| Any radiation received | 1.72 | 1.18–2.51 | 1.15 | 0.93–1.42 | 1.31 | 1.01–1.68 | 1.09 | 0.86–1.39 |
| Neoadjuvant radiation | 2.66 | 1.93–3.67 | 1.60 | 1.32–1.94 | 1.76 | 1.40–2.20 | 1.24 | 0.99–1.55 |
| Sphincter preserving surgery | 1.06 | 0.78–1.44 | 1.13 | 0.93–1.37 | 1.16 | 0.92–1.46 | 1.00 | 0.80–1.25 |
Adjusted for age, gender, race, marital status, stage, Charlson count, rurality and registry; P values calculated using a two-sided Wald test.
OR=Odds Ratio, 95% CI=95% Confidence Interval
Odds of having a pre-treatment CEA were statistically significantly greater among facilities categorized as NCI-DCCs (OR: 1.90, 95% CI: 1.39–2.61). Odds of receiving neoadjuvant chemotherapy were also greater in NCI-DCCs (OR: 2.32, 95% CI: 1.71–3.16) as were odds of receiving neoadjuvant radiation (OR: 2.66, 95% CI: 1.93–3.67). There were no statistically significant differences in sphincter preserving surgery by facility type.
Discussion
Our results demonstrate patients who received surgery at NCI-DCCs or hospitals with RPs or MSAs are more likely to receive guideline-concordant care after adjusting for patient demographics and number of co-morbidities. It is possible that for some patients, clinical staging results are interpreted as Stage I disease and surgery is performed as first-line therapy, but surgical pathology results subsequently indicate Stage II or III disease. This highlights the need for thorough guideline-based clinical staging studies, namely TRUS or MRI-pelvis, for which utilization was lower than anticipated.
However, multivariate models showed these centers were also more likely to use PET, a potential marker of over-utilization. Given the current focus on healthcare cost, value, and quality, examining use of services that are not guideline recommended to indicate over-treatment or utilization will become increasingly important as healthcare organizations work to improve quality while decreasing costs. While some evidence supports use of PET for stage II/III rectal cancer patients as it may identify more disseminated disease and indicate the need for more extensive therapy, or be used to clarify equivocal findings on CT or MRI [15–17], it is not currently recommended in NCCN guidelines [8].
Even among those receiving surgery at NCI-DCCs, only 62.1% of patients had a claim for TRUS or MRI-pelvis prior to treatment (vs. 29.9% treated in facilities without NCI designation). Although it is possible some patients who did not receive TRUS or MRI-pelvis were administered PET as an initial imaging study, in this current analysis, <15% of those who did not receive TRUS or MRI-pelvis received PET instead. Other studies have found surgeon- reported underuse of TRUS/MRI in the loco-regional staging of rectal cancer [18–20]. It is possible surgeons practicing in lower-volume centers may not be as familiar with the value of TRUS or MRI over CT in loco-regional staging, or may lack access to these imaging modalities.
The proportion of patients with CEA testing was also lower than anticipated, but not inconsistent with other data sources. SEER began collecting CEA values as a site-specific factor for cases diagnosed in 2010, and it was reported that 54.0% of colorectal cancer cases have known CEA values [21]. This is comparable to our estimate of 56.8% among Medicare beneficiaries diagnosed with Stages II/III rectal cancer. Again, those receiving treatment at NCI-DCCs or facilities with an RP or MSA had significantly higher rates of testing.
According to SEER data for all ages of stage II/III rectal cancer patients who received cancer-directed surgery, the proportion of those receiving neoadjuvant radiation has been steadily increasing over the last several years, from 48% in 2005 to 59% in 2010 [22]. Our analyses showed 43.9% and 48.7% of SEER-Medicare patients ≥66 years received neoadjuvant chemotherapy and radiation, respectively. This is lower than the 74.1% of stage II/III rectal cancer patients who received neoadjuvant chemoradiation in a recent National Cancer Data Base (NCDB) study [23]. This discrepancy may be largely explained by their finding that the average age of those receiving neoadjuvant chemoradiation was 59.9 years of age vs. 65.1 for those not receiving it [23], while our sample includes only patients ≥66 years. Furthermore, the NCDB study found those receiving neoadjuvant therapy were more likely to have private insurance [23], while this current study was comprised of Medicare beneficiaries. Finally, the NCDB contains data from predominantly academic medical centers with Commission on Cancer accreditation, with a relatively low proportion of data from smaller community hospitals [23,24].
Our results suggest larger medical centers more rapidly adopted neoadjuvant treatment guidelines than smaller community hospitals. These results are consistent with the aforementioned NCDB study which found 54.4% of those treated at comprehensive community hospitals (>500 cancer cases/year) received neoadjuvant chemoradiation, as compared to only 9.4% of those treated at community hospitals (100–500 cancer cases/year) [23].
No differences were detected in the proportion of patients receiving sphincter-preserving surgery by facility type. Other studies have found higher surgeon volume, specialty training, and greater rectal cancer resection volume for the hospital leads to improved sphincter preservation rates [3,6,25–29]. However, it is possible that patients with lower-lying tumors are more likely to be referred to sub-specialists at higher-volume centers; of those, many patients will still not be able to have their sphincters preserved even after neoadjuvant chemoradiation. SEER-Medicare data does not contain the location of the tumor so this could not be examined.
We found a small proportion of rectal cancer patients ≥66 years were treated at an NCI-DCC (9.5%). This is comparable to the 12.2% of patients estimated to receive care at very high-volume hospitals in a SEER-Medicare analysis of rectal cancer cases diagnosed from 1992–1999 [8]. Other studies found even smaller proportions (4.2–5.9%) of rectal cancer patients received surgery at an NCI-DCC [30,31].
It has been reported previously that patients treated at NCI-DCCs for rectal cancer are more likely to be younger (as we found), Black, and have fewer co-morbidities [31]; these patients may be more able to travel longer distances to NCI-DCCs. Where patients receive treatment is also heavily dependent on physician referral patterns, which we will examine in depth in a future study. It is possible that physicians are more likely to refer younger, healthier patients to NCI-DCC for more extensive treatment they are likely to withstand and benefit from, whereas older, more morbid patients are referred to local facilities for less extensive treatment. As a very small proportion of patients receive rectal cancer treatment at NCI-DCCs, NCI-DCC education and partnership initiatives with local community hospitals would likely improve the care of rectal cancer patients who receive care at non-NCI-DCCs as well as further the NCI-DCC program mission of developing effective approaches to care and research dissemination initiatives [32].
Internationally, several European countries have established Rectal Cancer Centers of Excellence, which centralize care in high-volume, multidisciplinary centers and have reduced variation in care and improved short- and long-term outcomes for rectal cancer patients [33]. The Optimizing the Surgical Treatment of Rectal Cancer (OSTRiCh) consortium was recently formed with the goal of establishing similar Rectal Cancer Centers of Excellence within the U.S [34].
Several limitations of this study warrant consideration. Our population only included people ≥66 years residing in SEER regions, so results may not generalize to younger patients and those living in other areas. Many variables were derived from administrative claims data, so there could be misclassification based on erroneous or inconsistent coding. However, agreement was good between claims-based variables and SEER variables derived from medical record reviews when comparisons could be made, such as with radiation (93%). Patient preferences were not assessed, which could account for some variation in staging and treatment practices. Furthermore, due to overlap between types of institutions (e.g., all NCI-DCCs included in analysis have residency programs and only one has no MSA), we are unable to determine which specific (or combination) of designation(s) is a driver of guideline-concordance.
Conclusion
In summary, Medicare-aged patients with stage II/III rectal cancer often do not receive guideline-recommended care, and care received appears to vary by facility characteristics. These process measures could be potential drivers of volume associated morbidity and mortality differences reported in previous studies [3,5–7,25–29]. Our findings are consistent with other studies showing a substantial proportion of rectal cancer patients do not appear to be receiving care at NCI-DCCs or other large academic centers. Virtual tumor boards have been explored to share expertise of high-volume centers with smaller, low-volume hospitals [34]. These and other evidence-based initiatives, as well as greater accountability and education initiatives for community healthcare settings, in partnership with larger centers, could serve as a catalyst to improve quality in rectal cancer care in the U.S.
Supplementary Material
Grant Support and Other Assistance:
This work was supported by a pilot award from the University of Iowa Holden Comprehensive Cancer Center, which is supported in part by the National Cancer Institute at the National Institutes of Health (P30 CA086862). Technical assistance was provided by the University of Iowa Holden Comprehensive Cancer Center Population Research Core.
Footnotes
This work has been previously presented in part as an abstract E-poster at the American Society of Colon and Rectal Surgeons Annual Scientific Meeting, Hollywood, FL, May 17–21, 2014 and as an abstract poster presentation at the American College of Epidemiology Annual Meeting, Silver Spring, MD, September 8–9, 2014.
References
- 1.Stitzenberg KB, Sigurdson ER, Egleston BL, Starkey RB, Meropol NJ. Centralization of cancer surgery: implications for patient access to optimal care. J Clin Oncol. 2009;27:4671–4678. [DOI] [PMC free article] [PubMed] [Google Scholar]
- 2.Stitzenberg KB, Meropol NJ. Trends in centralization of cancer surgery. Ann Surg Oncol. 2010;17:2824–2831. [DOI] [PubMed] [Google Scholar]
- 3.Salz T, Sandler RS. The effect of hospital and surgeon volume on outcomes for rectal cancer surgery. Clin Gastroenterol Hepatol. 2008;6:1185–1193. [DOI] [PMC free article] [PubMed] [Google Scholar]
- 4.Rogers SO Jr., Ayanian JZ, Ko CY, Kahn KL, Zaslavsky AM, Sandler RS, Keating NL. Surgeons’ volume of colorectal cancer procedures and collaborative decision-making about adjuvant therapies. Ann Surg. 2009;250:895–900. [DOI] [PMC free article] [PubMed] [Google Scholar]
- 5.Archampong D, Borowski DW, Dickinson HO. Impact of surgeon volume on outcomes of rectal cancer surgery: a systematic review and meta-analysis. Surgeon. 2010;8:341–352. [DOI] [PubMed] [Google Scholar]
- 6.Nugent E, Neary P. Rectal cancer surgery: volume-outcome analysis. Int J Colorectal Dis. 2010;25:1389–1396. [DOI] [PubMed] [Google Scholar]
- 7.Schrag D, Panageas KS, Riedel E, Cramer LD, Guillem JG, Bach PB, Begg CB. Hospital and surgeon procedure volume as predictors of outcome following rectal cancer resection. Ann Surg. 2002;236:583–592. [DOI] [PMC free article] [PubMed] [Google Scholar]
- 8.Billingsley KG, Morris AM, Green P, Dominitz JA, Matthews B, Dobie SA, Barlow W, Baldwin LM. Does surgeon case volume influence nonfatal adverse outcomes after rectal cancer resection? J Am Coll Surg. 2008;206:1167–1177. [DOI] [PMC free article] [PubMed] [Google Scholar]
- 9.Bilimoria KY, Bentrem DJ, Talamonti MS, Stewart AK, Winchester DP, Ko CY. Risk-based selective referral for cancer surgery: a potential strategy to improve perioperative outcomes. Ann Surg. 2010;251:708–716. [DOI] [PubMed] [Google Scholar]
- 10.National Comprehensive Cancer Network. NCCN Clinical Practice Guidelines in Oncology: Rectal Cancer;Version 3.2014. [DOI] [PubMed]
- 11.National Cancer Institute. SEER-Medicare Linked Database. http://appliedresearch.cancer.gov/seermedicare/. Accessed Oct 9, 2015.
- 12.University of Washington WWAMI Rural Health Research Center. Rural-Urban Commuting Areas (RUCA) Version 1.11. http://depts.washington.edu/uwruca/ruca-uses.php. Accessed Oct 9, 2015.
- 13.Charlson ME, Pompei P, Ales KL, MacKenzie CR. A new method of classifying prognostic comorbidity in longitudinal studies: development and validation. J Chronic Dis. 1987;40:373–383. [DOI] [PubMed] [Google Scholar]
- 14.Klabunde CN, Potosky AL, Legler JM, Warren JL. Development of a comorbidity index using physician claims data. J Clin Epidemiol. 2000;53:1258–1267. [DOI] [PubMed] [Google Scholar]
- 15.Davey K, Heriot AG, Mackay J, Drummond E, Hogg A, Ngan S, Milner AD, Hicks RJ. The impact of 18-fluorodeoxyglucose positron emission tomography-computed tomography on the staging and management of primary rectal cancer. Dis Colon Rectum. 2008;51:997–1003. [DOI] [PubMed] [Google Scholar]
- 16.Gearhart SL, Frassica D, Rosen R, Choti M, Schulick R, Wahl R. Improved staging with pretreatment positron emission tomography/computed tomography in low rectal cancer. Ann Surgical Oncol. 2006;13:397–404. [DOI] [PubMed] [Google Scholar]
- 17.Heriot AG, Hicks RJ, Drummond EG, Keck J, Mackay J, Chen F, Kalff V. Does positron emission tomography change management in primary rectal cancer? A prospective assessment. Dis Colon Rectum. 2004;47:451–458. [DOI] [PubMed] [Google Scholar]
- 18.Charlton ME, Lin C, Jiang D, Stitzenberg KB, Halfdanarson TR, Pendergast JF, Chrischilles EA, Wallace RB. Factors associated with use of preoperative chemoradiation therapy for rectal cancer in the Cancer Care Outcomes Research and Surveillance Consortium. Am J Clin Oncol. 2013;36:572–579. [DOI] [PMC free article] [PubMed] [Google Scholar]
- 19.Hyman N, Healey C, Osler T, Cataldo P Understanding variation in the management of rectal cancer: the potential of a surgeon-initiated database. Am J Surg. 2007;194:559–562. [DOI] [PubMed] [Google Scholar]
- 20.McMullen TP, Easson AM, Cohen Z, Swallow, CJ. The investigation of primary rectal cancer by surgeons: current pattern of practice. Can J Surg. 2005;48:19–26. [PMC free article] [PubMed] [Google Scholar]
- 21.Chen VW, Hsieh MC, Charlton ME, Ruiz BA, Karlitz J, Altekruse SF, Ries LA, Jessup JM. Analysis of stage and clinical/prognostic factors for colon and rectal cancer from SEER Registries: AJCC and collaborative stage data collection system. Cancer. 2014;120:3793–806. [DOI] [PMC free article] [PubMed] [Google Scholar]
- 22.Surveillance, Epidemiology, and End Results (SEER) Program (www.seer.cancer.gov) Research Data (1973–2010), National Cancer Institute, Division of Cancer Control and Population Sciences, Surveillance Research Program, Surveillance Systems Branch, released April 2013, based on the November 2012 submission.
- 23.Monson JR, Probst CP, Wexner SD, Remzi FH, Fleshman JW, Garcia-Aguilar J, Chang GJ, Dietz DW. Failure of evidence-based cancer care in the United States: the association between rectal cancer treatment, cancer center volume, and geography. Ann Surg. 2014;260:625–631. [DOI] [PubMed] [Google Scholar]
- 24.American College of Surgeons. About the National Cancer Data Base. https://www.facs.org/quality-programs/cancer/ncdb/about. Accessed Oct 11, 2015.
- 25.Meyerhardt JA, Tepper JE, Niedzwiecki D, Hollis DR, Schrag D, Ayanian JZ, O’Connell MJ, Weeks JC, Mayer RJ, Willett CG, MacDonald JS, Benson AB 3rd, Fuchs CS. Impact of hospital procedure volume on surgical operation and long-term outcomes in high-risk curatively resected rectal cancer: findings from the Intergroup 0114 Study. J Clin Oncol. 2004;22:166–174. [DOI] [PubMed] [Google Scholar]
- 26.Paquette IM, Kemp JA, Finlayson SR. Patient and hospital factors associated with use of sphincter-sparing surgery for rectal cancer. Dis Colon Rectum. 2010;53:115–120. [DOI] [PubMed] [Google Scholar]
- 27.Purves H, Pietrobon R, Hervey S, Guller U, Miller W, Ludwig K. Relationship between surgeon caseload and sphincter preservation in patients with rectal cancer. Dis Colon Rectum. 2005;48:195–202. [DOI] [PubMed] [Google Scholar]
- 28.Ricciardi R, Roberts PL, Read TE, Baxter NN, Marcello PW, Schoetz DJ. Who performs proctectomy for rectal cancer in the United States? Dis Colon Rectum. 2011;54:1210–1215. [DOI] [PubMed] [Google Scholar]
- 29.Ricciardi R, Roberts PL, Read TE, Baxter NN, Marcello PW, Schoetz DJ. Presence of specialty surgeons reduces the likelihood of colostomy after proctectomy for rectal cancer. Dis Colon Rectum. 2011;54:207–213. [DOI] [PubMed] [Google Scholar]
- 30.In H, Neville BA, Lipsitz SR, Corso KA, Weeks JC, Greenberg CC. The role of National Cancer Institute-designated cancer center status: observed variation in surgical care depends on the level of evidence. Ann Surg. 2012;255:890–895. [DOI] [PMC free article] [PubMed] [Google Scholar]
- 31.Paulson EC, Mitra N, Sonnad S, Armstrong K, Wirtalla C, Kelz RR, Mahmoud NN. National Cancer Institute designation predicts improved outcomes in colorectal cancer surgery. Ann Surg. 2008;248:675–686. [DOI] [PubMed] [Google Scholar]
- 32.National Cancer Institute. NCI-Designated Cancer Centers. http://www.cancer.gov/research/nci-role/cancer-centers. Accessed Oct 11, 2015.
- 33.Dietz DW. Multidisciplinary management of rectal cancer: the OSTRICH. J Gastrointest Surg. 2013;17:1863–1868. [DOI] [PubMed] [Google Scholar]
- 34.Marshall CL, Petersen NJ, Naik AD, Vander Velde N, Artinyan A, Albo D, Berger DH, Anaya DA. Implementation of a regional virtual tumor board: A prospective study evaluating feasibility and provider acceptance. Telemed J E Health. 2014;20:705–711. [DOI] [PMC free article] [PubMed] [Google Scholar]
Associated Data
This section collects any data citations, data availability statements, or supplementary materials included in this article.