Abstract:
The presence of gaseous air emboli in the vasculature has the potential to cause significant morbidity and mortality. Once viewed as a rare complication of high-risk surgeries, air embolism is now also being associated with even minor and routine procedures such as peripheral venous catheterization. With increasing recognition, various preventive measures have emerged, the most important of which is the use of air-eliminating filters. However, studies on these devices are currently lacking. Therefore, in this present study, we aimed to evaluate the effectiveness of two commercially available filters in removing air within intravenous (IV) lines. An IV infusion system was created, designed to resemble standard conditions used in real clinical practice. Testing was completed using a .9% NaCl solution at room temperature with a flow rate set at 75 mL/h and involving three different filter orientations. The test bed was configured to inject air every 2 minutes with volumes ranging between 5 and 600 μL. The two filter models tested were GVS .2-μM and Braun SUPOR membrane air-eliminating filters. Data was collected at pre-filter and post-filter sites. The Braun SUPOR membrane filter (B Braun, Bethlehem, PA) reduced air micro-emboli by 100.0% (p < .0001) both by volume and count compared with −.6 ± 3.5% by volume and −.8 ± 1.5% by count for the control. The reduction seen with the GVS .2-μM filter was 99.8 ± .2% (p < .0001) by volume and 86.2 ± 21.1% (p < .0001) by count compared with the control. There was no statistically significant difference in the removal efficacy between the two filter models. As the use of air-eliminating filters becomes a common standard of care, establishing the validity of the commercially available filter models is important to minimize the risk of vascular air embolism.
Keywords: micro-emboli, filter, infusion, in vitro test
INTRODUCTION
When gas is introduced into the vasculature, devastating and even life-threatening complications can result. If air enters the arterial system, massive strokes can occur. The use of cardiopulmonary bypass (CPB) during surgery, for instance, has been associated with arterial cerebral micro-emboli, which has been shown to result in a deterioration in the patient’s neurocognitive functioning. Cerebral micro-embolism following CPB has been linked to a postoperative cognitive decline, particularly in the domains of memory and motor speed (1–4). On the other hand, air lodged in the venous system can compromise the pulmonary and cardiovascular circulation, causing pulmonary hypertension or myocardial ischemia (1). The proposed pathogenesis is that the air lodged in the pulmonary system results in arterial vasoconstriction and activates an inflammatory response, leading to increased pulmonary arterial pressure. This, in turn, creates resistance to right ventricular outflow, which decreases left ventricular preload and, thus, cardiac output. Furthermore, air that initially enters the venous system can travel to the arterial circulation through a patent foramen ovale (PFO) or atrial-septal defect. Given that PFOs exist in about 20–30% of the adult population, venous air embolism poses an even greater risk of devastating complications for these people (1,5).
The incidence of vascular air embolism (VAE) is estimated to be one in 772. However, the exact number is thought to be higher because many cases go undetected or are easily misdiagnosed (6). In addition to the clinical risks, VAE following medical or surgical procedures poses significant financial consequences. Complications associated with VAE costs the healthcare system, on average, $66,007 per incident, and its medical claims have the highest median compensation (7–9).
Even a small volume of air in the vasculature may be unsafe. Lethal doses of air emboli have been estimated at 3–5 mL/kg, but there have been reports of fatal incidences with even 100 mL of air administered at high speed and clinical complications from air bubbles as little as <1 μL (1,10). Fortunately, most cases of air embolism are modifiable and are, thus, cited as never-events according to the Center for Medicare and Medicaid (7).
Incorporating filters into the CPB circuit has become a recommended standard of care and an important part of preventing VAE (11–13). Air-eliminating filters are designed to detect and automatically remove gaseous emboli within the intravenous (IV) infusion devices. However, currently, there is only one Food and Drug Administration-approved air filtration device that serves this purpose, ClearLine IV (ClearLine MD, Woburn Ma, MA). Although many different models are coming onto the market, clinical data on the use of these filters is limited (1). Therefore, by testing these alternatives, we will be able to offer a broader set of options with newer designs that may have superior efficacy or availability.
The GVS SpeedFlow® (GVS Filtration Inc., Bologna, Italy) .2-μm filter (TCBINF044G; TrueCare Biomedix USA Inc., South Miami, FL) and Braun SUPOR membrane (REF473036, PFE2000; B Braun) are two commercially available air-eliminating filters. Both filters are suited for use in IV systems. The GVS SpeedFlow® 0.2-μm filter model consists of a hydrophilic HI-FLO polyethersulfone membrane and diethylhexylphthalate (DEPH) and is latex free, with a filter body measuring 40.2 mm and a pore size of 0.2 μm; the effective filtration area is 10.0 cm2. This filter model is designed to handle a water flow rate >32 mL/min at 80 cm water head pressure and has been tested for its air eliminating function (14). The Braun .2-micron SUPOR membrane filter is a low volume, DEPH and latex-free, .8-mL priming volume, 50/cs filter that also allows for elimination of air (15).
To optimize the utilization of air-eliminating filters in the clinical setting and to avoid the negative consequences of air embolism, we aimed to evaluate the effectiveness of these two commercially available air-eliminating filter models: GVS SpeedFlow® 0.2 μm filter and Braun SUPOR membrane.
MATERIAL AND METHODS
Test Bed Specification
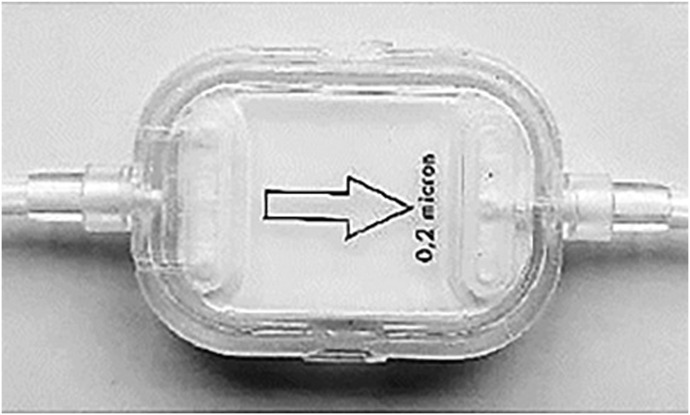
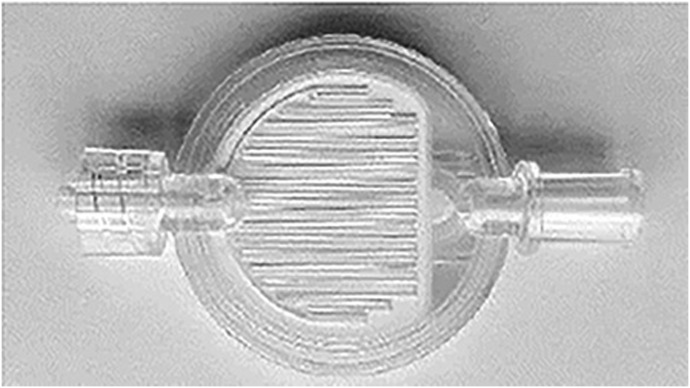
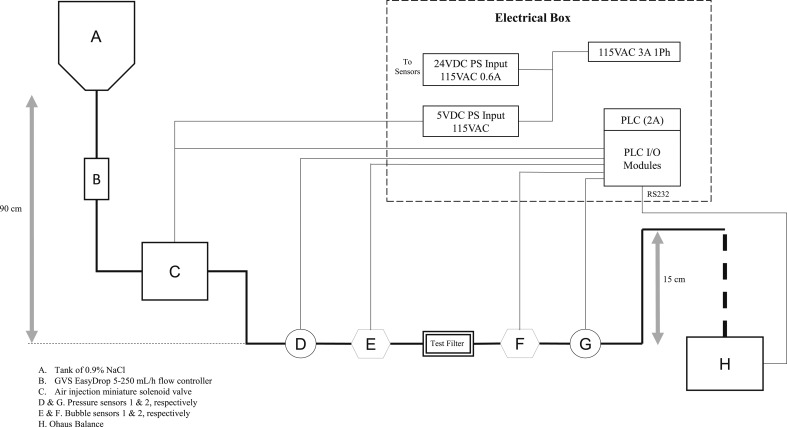
The test bed was constructed to evaluate the ability of air-eliminating filters to detect and remove air from an IV line containing a .9% NaCl solution. The components of the test bed system included the following: a tank of .9% NaCl, IV flow regulator (GVS EasyDrop), Ohaus Adventurer Pro balance, air injection solenoid valve (Aiyima 43239-208146 2-Pos 3-Way), digital ultrasonic bubble detector (A330 Bubble Sensor; Strain Measurement Devices, Wallingford, CT), pressure sensors (Automation Direct, PTD25-20-0100WCH), air-eliminating filter (test filter), programmable logic circuit (Productivity 2000 Programmable Logic Circuit [PLC]; Automation Direct P2-550), and air chamber (polyvinyl chloride). The two air filters were tested individually: either the GVS SpeedFlow® 0.2-μm filter (TCBINF044G; TrueCare) or SUPOR membrane (REF 473036, PFE2000; B Braun) model (Figures 1 and 2). The .9% NaCl tank was placed approximately 90 cm above the filter to simulate the hanging of IV bag above a patient’s heart. The Productivity 2000 PLC was connected to the bubble and pressure sensors, balance, and air injection valve for data acquisition. The final tubing exit was placed 15 cm above the air-eliminating filters to maintain a pressure of 12.4–14.5 mmHg (.24–.28 psi) at the filter exit. This target pressure was chosen to be slightly greater than the typical peripheral venous pressure. The accuracy of the pressure gauges is .75% of full range and is, therefore, ±1.4 mmHg (Figure 3).
Figure 1.
GVS SpeedFlow® 0.2-μm filter (TCBINF044G; TrueCare).
Figure 2.
B Braun 0.2-μm SUPOR filter (REF473036, PFE2000).
Figure 3.
Test bed schematic.
Intervention
The test bed was configured to inject air every 2 minutes. The fluid flow target was set at 75 mL/h using GVS EasyDrop and measured gravimetrically by the Ohaus Adventurer Pro balance. Each filter was tested in three different orientations relative to the plane of fluid flow: horizontal, vertical-flow down, and vertical-flow up. The operational performance of the test bed was initially verified without the test filter to ensure the accuracy of the two sensors before the filter test experiments.
Data Analysis
Two bubble sensors (A330 Bubble Sensor; Strain Measurement Devices) were positioned with one proximal [Sensor 1] and the other distal [Sensor 2] to the air-eliminating filter. Data were recorded and processed automatically using the Productivity 2000 PLC (Automation Direct P2-550, Cumming, GA) at a rate of once every 70 ms. The device counts air bubbles ranging as low as 3 μL with no maximum limit.
The primary outcome was defined as percent removal, calculated according to the following equation, which was used to determine the efficacy of the filter in eliminating air within the circuit. The difference in the volume or count of air detected at the pre-filter and post-filter sensors was compared with the volume or count of air measured at the pre-filter sensor [Sensor 1].
Statistical Analysis
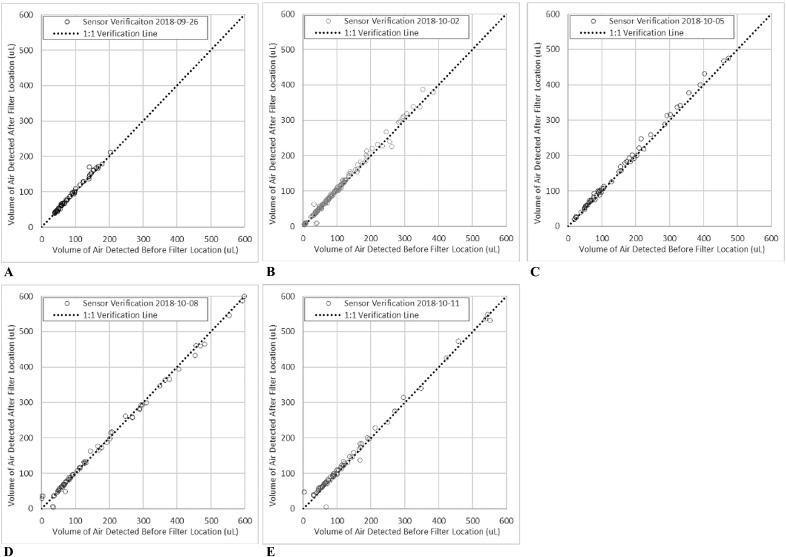
To verify the validity of the test bed and sensors used, the data collected were analyzed using a regression model and the coefficient of determination (r2) was calculated. The volume of air detected at Sensor 1 was plotted against the volume of air detected at Sensor 2. Assuming a 1:1 linear correlation, the data points were compared to determine any variability between the two sensors in detecting the volume of air. To determine the efficacy of each filter, descriptive statistics of the percent removal based on the count and volume of air bubbles were performed to show the differences in air detected before and after the filter. Differences between the pre- and post-filter data were plotted for the distribution of data. For normally distributed data, a two-tailed student’s t test or Welch’s unequal variances t test was applied. Results are presented as mean (SD), and a p value ≤ .05 was considered statistically significant. Statistical analysis was performed using SPSS version 26 (IBM Corporation, New York, NY) software.
RESULTS
Verification of Test Bed’s Operational Performance
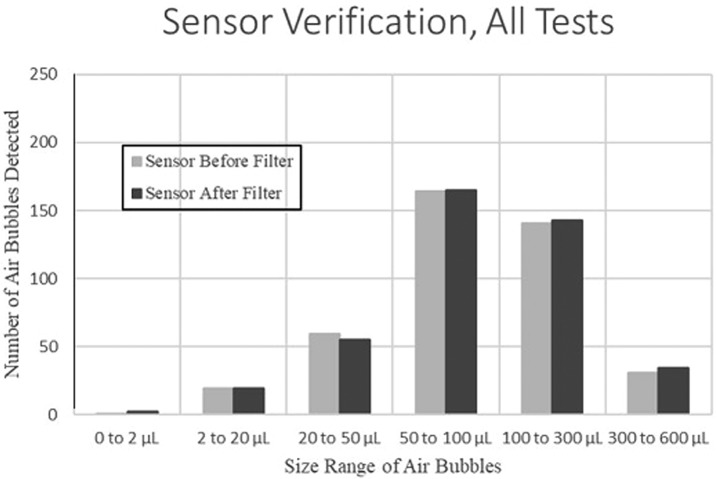
The study was conducted from September 2018 to October 2018. The volumes of air passing the two bubble sensors were compared multiple times (Figure 4). Under the preset testing conditions, the change in volumes of air measured at Sensor 1 and at Sensor 2 was within 20% of each other for 96% of the samples (Table 1). Most of the variation greater than this occurred for air volumes less than 20 μL, which was lower than the test objectives. In addition, the total number of air bubbles detected at each sensor was within 1% of each other, with minor variation in the number of bubbles per volume range (Figure 5).
Figure 4.
Sensor verification on (A) September 26, 2018, (B) October 02, 2018, (C) October 05, 2018, (D) October 08, 2018, and (E) November 11, 2018.
Table 1.
Sensor verification results with coefficient of determination, r2 values.
| Test Date | Sample Size | r2 Value | Percentage of Air Bubbles Detected at Sensor 1 and 2 with Δvolume < ±20% |
|---|---|---|---|
| September 26 | 60 | 99.1 | 100% |
| October 2 | 148 | 99.0 | 98% |
| October 5 | 63 | 99.6 | 100% |
| October 8 | 73 | 99.5 | 92% |
| October 11 | 82 | 99.4 | 93% |
Figure 5.
Number of air bubbles detected at the sensor before [Sensor 1] and after [Sensor 2] the filter.
Variations in Testing Conditions
At a targeted fluid flow rate of 75 mL/h, the actual average flow rate varied from 65 to 74 mL/h. The target pressure at the filter exit was 12.4–14.5 mmHg, but the actual average ranged from 13.4 to 14.5 mmHg. The fluid temperature varied from 20 to 24°C.
Efficacy of Air Removal
The results of removal efficacy based on the volume and count of detectable air bubbles are summarized in Tables 2 and 3. For each filter, there were more than 400 air bubbles greater than 20 μL introduced and detected before the air-eliminating filter [Sensor 1], whereas no bubbles greater than 20 μL were detected after [Sensor 2] (Table 4).
Table 2.
Efficacy of air bubble removal based on volume at a flow rate of 75 mL/h.
| Filter Model | Percentage Removed (%)* | 95% Confidence Interval |
|---|---|---|
| TCBINF044G | 99.8 ± .2†‡ | 99.6–100.0 |
| REF473036 | 100.0 ± .0† | 100.0–100.0 |
| Control | −.6 ± 3.5 | −4.9–3.7 |
*Results denote means ± SD.
†p < .0001 compared with the control group.
‡p > .05 compared with the REF473036 filter model group.
Table 3.
Efficacy of air bubble removal based on counts at a flow rate of 75 mL/h.
| Filter Model | Percentage Removed (%)* | 95% Confidence Interval |
|---|---|---|
| TCBINF044G | 86.2 ± 21.1†‡ | 64.1–108.3 |
| REF473036 | 100.0 ± .0† | 100.0–100.0 |
| Control | −.8 ± 1.5 | −2.7–1.0 |
*Results denote means ± SD.
†p < .0001 compared with the control group.
‡p > .05 compared with the REF473036 filter model group.
Table 4.
Summary of all bubble sensor data pre [Sensor 1] and post [Sensor 2] air-eliminating filter location. Values in bold highlight whether bubbles were detected after passing through the filter.
| Filter | Orientation | Test Date (2018) | Bubble Count per Range of Volume, n | Total Volume (µL) | Total Air Bubbles, n | % Air Passing through Filter | Flow Rate (mL/h) | Filter Exit Pressure (psi) | |||||||||||||
|---|---|---|---|---|---|---|---|---|---|---|---|---|---|---|---|---|---|---|---|---|---|
| 0 to 2 µL | 2 to 20 µL | 20 to 50 µL | 50 to 100 µL | 100 to 300 µL | 300 to 600 µL | ||||||||||||||||
| Sensor | Sensor | Sensor | Sensor | Sensor | Sensor | Sensor | Average | Standard Deviation | |||||||||||||
| 1 | 2 | 1 | 2 | 1 | 2 | 1 | 2 | 1 | 2 | 1 | 2 | 1 | 2 | ||||||||
| Sensor verification | September 26 | 0 | 2 | 0 | 0 | 10 | 10 | 32 | 31 | 16 | 17 | 0 | 0 | 4,998 | 5,122 | 58 | 102 | 72 | 4.3 | .27 | |
| TCBINF044G(1) | Horizontal—membrane up | September 26 | 0 | 25 | 2 | 0 | 24 | 0 | 14 | 0 | 57 | 0 | 1 | 0 | 12,868 | 41 | 98 | .3 | 73 | 4.3 | .27 |
| TCBINF044G(2) | Vertical—flow down | September 28 | 0 | 28 | 0 | 0 | 11 | 0 | 9 | 0 | 26 | 0 | 8 | 0 | 9,141 | 43 | 54 | .5 | 71 | 6.9 | .26 |
| TCBINF044G(2) | Vertical—flow up | September 28 | 0 | 0 | 1 | 3 | 10 | 0 | 0 | 0 | 19 | 0 | 24 | 0 | 14,182 | 29 | 54 | .2 | 74 | 6.1 | .26 |
| Sensor verification | October 2 | 0 | 0 | 14 | 16 | 28 | 23 | 49 | 49 | 51 | 53 | 5 | 7 | 3,899 | 3,922 | 147 | 101 | 69 | 6.5 | .26 | |
| TCBINF044G(3) | Vertical—flow up | October 3 | 0 | 0 | 2 | 0 | 14 | 0 | 10 | 0 | 44 | 0 | 2 | 0 | 11,231 | 0 | 72 | .0 | 65 | 7.4 | .26 |
| TCBINF044G(3) | Vertical—flow down | October 3 | 0 | 0 | 0 | 0 | 10 | 0 | 12 | 0 | 27 | 0 | 3 | 0 | 6,924 | 0 | 52 | .0 | 71 | 4.6 | .26 |
| TCBINF044G(3) | Horizontal—membrane up | October 3 | 0 | 0 | 2 | 0 | 16 | 0 | 33 | 0 | 27 | 0 | 3 | 0 | 8,499 | 0 | 81 | .0 | 73 | 7.6 | .26 |
| Sensor verification | October 5 | 0 | 0 | 1 | 0 | 6 | 7 | 25 | 24 | 22 | 22 | 8 | 9 | 8,478 | 8,331 | 62 | 98 | 68 | 6.6 | .26 | |
| REF473036(1) | Horizontal—grated up | October 8 | 0 | 0 | 0 | 0 | 5 | 0 | 11 | 0 | 25 | 0 | 0 | 0 | 5,231 | 0 | 41 | .0 | 69 | 7.3 | .27 |
| REF473036(1) | Vertical—flow down | October 8 | 0 | 0 | 0 | 0 | 10 | 0 | 11 | 0 | 23 | 0 | 1 | 0 | 5,176 | 0 | 45 | .0 | 72 | 5.3 | .28 |
| REF473036(1) | Vertical—flow up | October 8 | 0 | 0 | 2 | 0 | 6 | 0 | 20 | 0 | 23 | 0 | 0 | 0 | 5,148 | 0 | 51 | .0 | 71 | 5.5 | .28 |
| Sensor verification | October 8 | 1 | 0 | 2 | 2 | 6 | 8 | 28 | 27 | 24 | 25 | 12 | 11 | 8,104 | 7,810 | 73 | 96 | 71 | 5.3 | .28 | |
| REF473036(2) | Vertical—flow up | October 10 | 0 | 0 | 46 | 0 | 17 | 0 | 20 | 0 | 24 | 0 | 12 | 0 | 10,549 | 0 | 119 | .0 | 72 | 5.7 | .28 |
| REF473036(2) | Vertical—flow down | October 10 | 0 | 0 | 14 | 0 | 7 | 0 | 24 | 0 | 26 | 0 | 4 | 0 | 8,104 | 0 | 75 | .0 | 71 | 5.9 | .28 |
| REF473036(2) | Horizontal—grated up | October10 | 0 | 0 | 3 | 0 | 6 | 0 | 16 | 0 | 4 | 0 | 0 | 0 | 1953 | 0 | 29 | .0 | 65 | 9.2 | .27 |
| REF473036(3) | Horizontal—grated up | October 10 | 0 | 0 | 7 | 0 | 4 | 0 | 15 | 0 | 22 | 0 | 6 | 0 | 7,410 | 0 | 54 | .0 | 71 | 5.2 | .26 |
| REF473036(3) | Vertical—flow down | October 11 | 0 | 0 | 0 | 0 | 6 | 0 | 15 | 0 | 20 | 0 | 5 | 0 | 6,408 | 0 | 46 | .0 | 74 | 5.5 | .27 |
| REF473036(3) | Vertical—flow up | October 11 | 0 | 0 | 1 | 0 | 3 | 0 | 15 | 0 | 19 | 0 | 8 | 0 | 7,120 | 0 | 46 | .0 | 71 | 5.6 | .26 |
| Sensor verification | October 11 | 0 | 0 | 2 | 1 | 9 | 7 | 30 | 34 | 28 | 26 | 6 | 7 | 5,956 | 6,266 | 75 | 105 | 72 | 7.4 | .27 | |
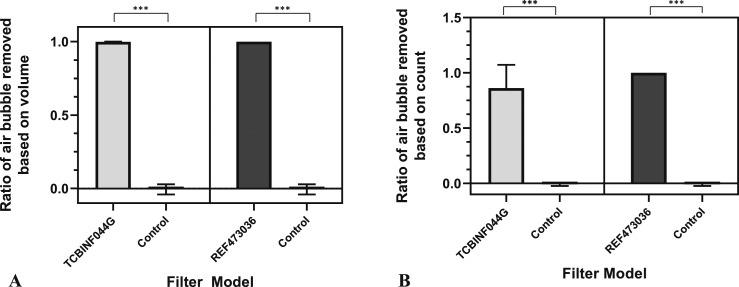
The range of volumes of bubbles detected by the sensors is between 1.5 and 600 μL. For the model TCBINF044G, three air bubbles were detected after the filter [Sensor 2] with volumes of 6, 8, and 15 μL. In addition, 53 bubbles with volumes <2 μL were detected at Sensor 2. The average relative ratio of the volume of air removed using the TCBINF044G filter was 99.86% compared with .11% in the control (no filter) (p < .0001). Similarly, the average percentage of the number of air bubbles removed based on count showed that this model eliminated 88.52% of air bubbles compared with −.17% in control (p < .0001) (Figure 6).
Figure 6.
Efficacy of air bubbles removed based on volume (A) and count (B).
With the model REF473036, no air bubbles of any volume were detectable after the filter [Sensor 2], although more than 500 bubbles were detected before the filter [Sensor 1]. The average percentage of air bubbles removed based on both volume and count showed 100% removal efficacy. These results were statistically significant compared with the control for both volume and count (p < .0001) (Figure 6). However, between the two filter models, there was no statistically significant difference in removal efficacy by volume nor count (p > .05).
DISCUSSION
Since the early 19th century, VAEs have been recognized as potentially life-threatening events but were more often regarded as rare complications of very high-risk procedures such as sitting craniotomies. With the advancement in medical technology and increased awareness, VAEs have now been described within numerous different clinical context, including laparoscopic surgeries and routine IV catheterization (16). The consequences of air bubbles lodged within the circulatory system can be substantial, possibly leading to ischemia of major organs such as the lungs, heart, and brain. As a result, efforts at earlier detection through careful clinical monitoring and timely use of diagnostic testing such as the transesophageal echocardiography have led to improvements. However, effective preventative measures remain limited (1,6).
For instance, placing the patient in a lateral decubitus or Trendelenburg position while inserting a central venous catheter is nowadays a common practice. The idea is to shift any possible air bubbles present within the right ventricular outflow tract to the right atrium to prevent cardiopulmonary collapse. But, this method is not always reliable (1,16). In addition, although warming IV fluids immediately before their administration can be highly effective at reducing formation of air bubbles within the tubing, practical barriers and work flow limit its success (1,17). Therefore, alternative preventive control measures are needed.
In this regard, the use of air-eliminating filters has become a promising option to counteract some of these pitfalls and now a recommended standard of practice (13). Previous studies with commercially available filters have shown their potential benefit in reducing not only the number of air micro-emboli within the circulation but also postsurgical neurologic deficits (12,18). Although there is currently one Food and Drug Administration-approved air-eliminating filter, ClearLine IV (ClearLine MD), attempts at finding alternative filter models with superior efficacy are warranted, given the potential consequences of air micro-embolism. Thus, the goal of this study was to determine whether some of the commercially available filters could achieve complete or near-complete elimination of air bubbles within the infusion circuit with the potential to reduce embolic injury.
We tested two commercial air-eliminating filters using a circuit model designed to mimic a standard IV infusion system at three different configurations to account for changes in patient positioning. Under these conditions, both filter models were found to be highly effective at removing air bubbles of 5–600 μL in size within the circuit. The GVS 0.2 μm TCBINF044G model removed 99.8% by volume of air bubbles in the circuit, although by count, the percent removal was 86.2%. In comparison, the Braun SUPOR membrane REF473036 model was able to completely remove all air bubbles that passed through the filter.
The lower removal efficacy of the TCBINF044G model may be a result of its lower sensitivity in detecting smaller air bubbles because all the air bubbles detected beyond the filter were less than 20 μL in size. Alternatively, these air bubbles could have been present downstream of the filter at the start of the test, which were unable to be detected and removed properly.
Results from this study are significant in that both filter models showed complete removal of air bubbles >20 μL in size, which is much smaller than the volume of air reported to be fatal (1,10,16). In addition, the test circuit in our experiment was designed to closely mirror the IV infusion pumps used in real clinical settings, also taking into account the positional changes that frequently occur when these lines are connected to patients. The findings obtained under these testing conditions, therefore, support the possibility that these two air-eliminating filter models may offer favorable clinical outcomes.
A possible limitation of our study is that despite our efforts to model the standard conditions for an IV infusion, these settings might not be the conditions in which air-eliminating filters are prone to fail. For instance, the Braun SUPOR membrane filter is designed to handle low-volume flow; however, the average fluid flow rate in our study ranged from 65 to 74 mL/h. Nevertheless, both of the filter models tested in our study are currently being used in real clinical settings; therefore, our study’s testing conditions were designed to mimic the clinical situation, which is also in line with our objectives. Taking these limitations into consideration, further investigations are needed in close collaboration with medical professionals who have identified instances of improper functioning of air-eliminating filters. Moving forward, high-quality clinical trials will help determine whether the efficacy of these filter models can also be seen in actual practice and whether their use translates to improved clinical outcomes for patients.
REFERENCES
- 1.Brull SJ, Prielipp RC. Vascular air embolism: A silent hazard to patient safety. J Crit Care . 2017;42:255–63. [DOI] [PubMed] [Google Scholar]
- 2.Baker AJ, Naser B, Benaroia M, et al. Cerebral microemboli during coronary artery bypass using different cardioplegia techniques. Ann Thorac Surg . 1995;59:1187–91. [DOI] [PubMed] [Google Scholar]
- 3.Selnes OA, McKhann GM. Neurocognitive complications after coronary artery bypass surgery. Ann Neurol. 2005;57:615–21. [DOI] [PubMed] [Google Scholar]
- 4.Doganci S, Gunaydin S, Kocak OM, et al. Impact of the intensity of microemboli on neurocognitive outcome following cardiopulmonary bypass. Perfusion. 2013;28:256–62. [DOI] [PubMed] [Google Scholar]
- 5.Muth CM, Shank ES. Gas embolism. N Engl J Med. 2000;342:476–82. [DOI] [PubMed] [Google Scholar]
- 6.McCarthy CJ, Behravesh S, Naidu SG, et al. Air embolism: Diagnosis, clinical management and outcomes. Diagnostics (Basel). 2017;7:E5. [DOI] [PMC free article] [PubMed] [Google Scholar]
- 7.Rowland HT. When never happens: Implications of Medicare’s never-event policy. Marquette Elder’s Advi. 2009;10:341–82. [Google Scholar]
- 8.Bhananker SM, Liau DW, Kooner PK, et al. Liability related to peripheral venous and arterial catheterization: A closed claims analysis. Anesth Analg. 2009;109:124–9. [DOI] [PubMed] [Google Scholar]
- 9.Domino KB, Bowdle TA, Posner KL, et al. Injuries and liability related to central vascular catheters: A closed claims analysis. Anesthesiology. 2004;100:1411–8. [DOI] [PubMed] [Google Scholar]
- 10.Wilkins RG, Unverdorben M. Accidental intravenous infusion of air: A concise review. J Infus Nurs. 2012;35:404–8. [DOI] [PubMed] [Google Scholar]
- 11.Baker RA, Bronson SL, Dickinson TA, et al. Report from AmSECT’s international consortium for evidence-based perfusion: American society of extracorporeal technology standards and guidelines for perfusion practice: 2013. J Extra Corpor Technol. 2013;45:156–66. [PMC free article] [PubMed] [Google Scholar]
- 12.Riley JB. Arterial line filters ranked for gaseous micro-emboli separation performance: An in vitro study. J Extra Corpor Technol . 2008;40:21–6. [PMC free article] [PubMed] [Google Scholar]
- 13.Shann KG, Likosky DS, Murkin JM, et al. An evidence-based review of the practice of cardiopulmonary bypass in adults: A focus on neurologic injury, glycemic control, hemodilution, and the inflammatory response. J Thorac Cardiovasc Surg . 2006;132:283–90. [DOI] [PubMed] [Google Scholar]
- 14.Product Collection - Healthcare Filters & Components. IV and liquid filters. Italy: GVS ® S.p.A.;2015;16–9. [Google Scholar]
- 15.Product Catalog. IV administration sets. Bethlehem, PA: B. Braun Medical; 2014;.E17. [Google Scholar]
- 16.Mirski MA, Lele AV, Fitzsimmons L, et al. Diagnosis and treatment of vascular air embolism. Anesthesiology. 2007;106:164–77. [DOI] [PubMed] [Google Scholar]
- 17.Varga C, Luria I, Gravenstein N. Intravenous air: The partially invisible phenomenon. Anesth Analg. 2016;123:1149–55. [DOI] [PubMed] [Google Scholar]
- 18.Pugsley W, Klinger L, Paschalis C, et al. The impact of microemboli during cardiopulmonary bypass on neuropsychological functioning. Stroke. 1994;25:1393–9. [DOI] [PubMed] [Google Scholar]


