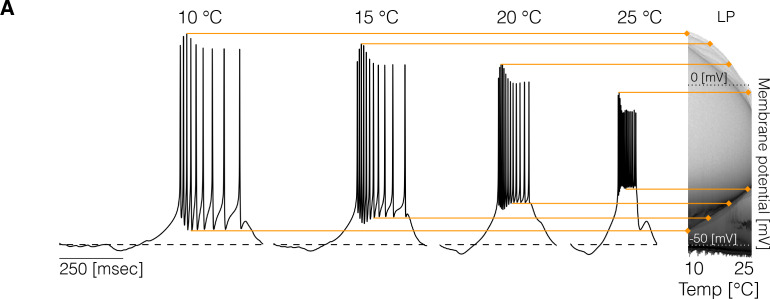
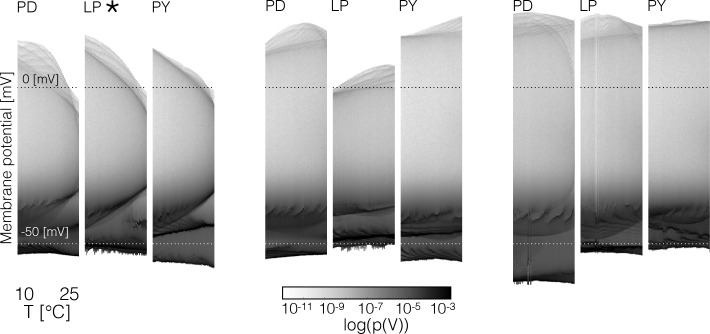
Figure 2. Changes in membrane potential over temperature.
(left) Representative traces of the cell in one model at different temperatures. (right) Membrane potential distribution at each temperature. The gray scale indicates the proportion of time the cell spends at that potential. The distribution facilitates inspecting how features such as the total amplitude of the oscillations and spiking thresholds change with temperature.


