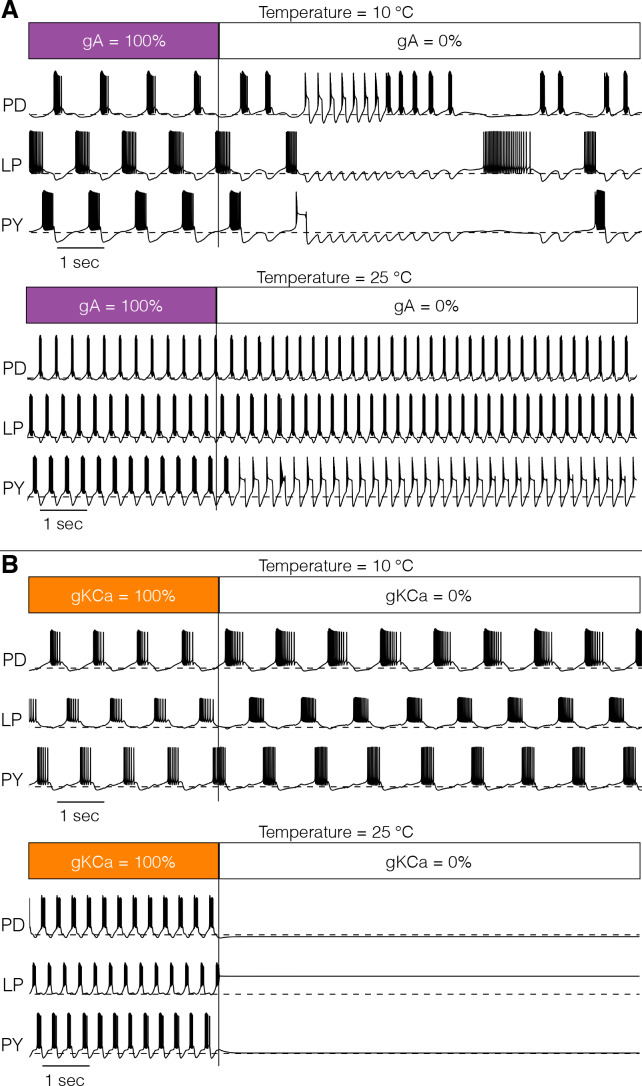
Figure 9. Response to perturbations at different temperatures.
The response of the models to extreme perturbations can be different at different temperatures. The figure shows the responses of models to the same perturbation at two different temperatures. (A) (top) Membrane potential over time at 10°C. The first 4 s correspond to the control condition with all currents intact. At we removed the current. (bottom) Same perturbation performed at 25°C (same model as in Figure 4). (B) Same protocol as in A but removing the current in a different model (Figure 7A).

