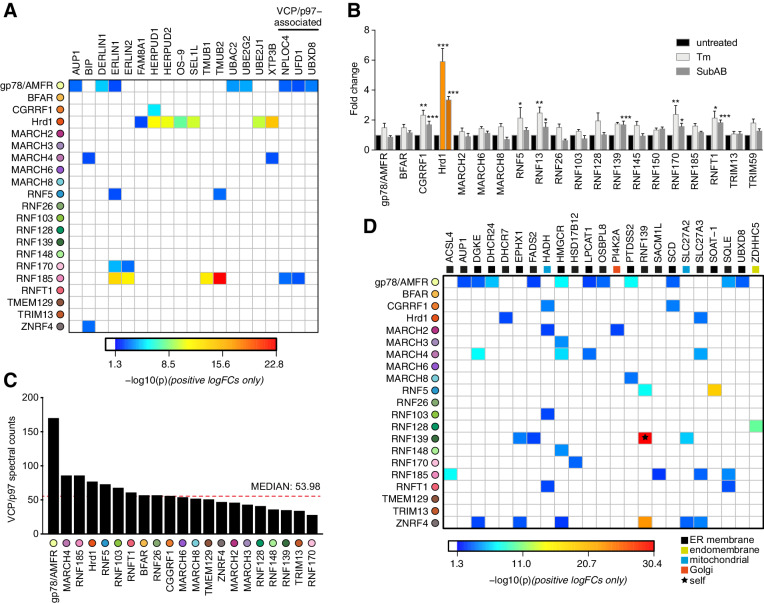
Figure 3. Functional associations of E3 and HCIPs.
(A) Heat map depicting established ERAD components found as HCIPs with the panel of ER-resident E3s, with colours of individual interactors corresponding to their calculated p-values. (B) Transcriptional analysis of parental Flp-In293 cells determined by NanoString. Data depict fold change of E3 transcripts measured from tunicamycin-treated (Tm, 500 ng/mL, 8 hr) and SubAB-treated (SubAB, 10 ng/mL, 8 hr) cells when compared to untreated. Mean and S.E.M. are shown from three biological repeats (n = 3). *p<0.05, **p<0.01, ***p<0.001. Detailed statistical analysis can be found in Supplementary file 1, Table 12. Hrd1 is highlighted in orange for reference. (C) Absolute number of spectral counts detected for VCP/p97 for each ER-resident E3 determined by SINQ analysis. The dotted red line shows the median spectral counts for reference (D) Heat map representing the association between proteins involved in lipid regulation (synthesis; metabolism and transport) and E3 baits. Colours associated with individual interactors correspond to their calculated p-values.


