Abstract
Ligands bound to protein assemblies provide critical information for function, yet are often difficult to capture and define. Here we develop a top-down method, “Nativeomics”, unifying “omics” (lipidomics, proteomics, metabolomics) analysis with native mass spectrometry to identify ligands bound to membrane protein assemblies. By maintaining the link between proteins and ligands we define the lipidome/metabolome in contact with membrane porins and a mitochondrial translocator to discover potential regulators of protein function.
Keywords: Native mass spectrometry, top-down mass spectrometry, protein-ligand binding, membrane proteins, structural biology, endogenous ligands, Nativeomics, lipids, de-orphanisation
Determining the chemical identity of lipids, metabolites and cofactors in direct contact with protein assemblies is a substantial challenge, brought sharply into focus by the plethora of images from electron microscopy and crystallography with unassigned or poorly resolved ligand density1,2. Current strategies to identify small molecule binders usually rely on large-scale screening3, or involve chemical extraction of unknown molecules and analysis using “omics methods” (proteomics, lipidomics, metabolomics)4. These approaches often require some prior knowledge of ligand chemistry and, significantly, extraction severs the link between binding partners. Inferred ligands must subsequently be confirmed by incubation with the original protein/complex, precluding identification of multiple concomitant interactions, and rationalizing why numerous receptors remain “orphan” with no known endogenous ligands5.
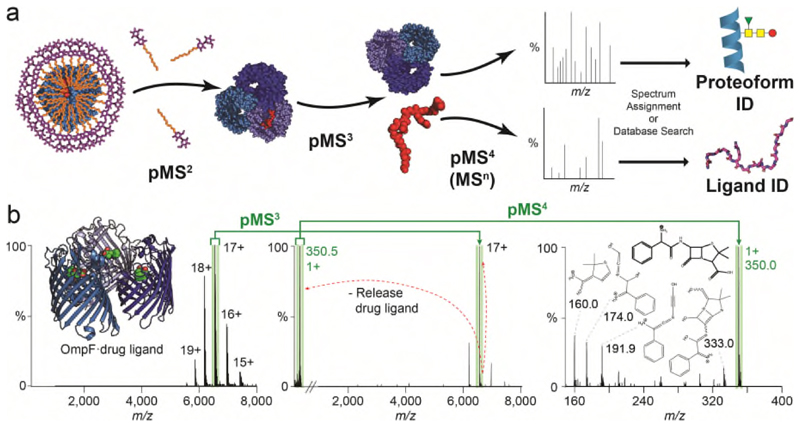
Native mass spectrometry (nMS) allows endogenous ligands to be directly observed bound to soluble and membrane proteins. However, mass measurement alone is often insufficient to deduce the chemical properties of a ligand e.g. lipid class, let alone define isomers e.g. different hydrocarbon chain lengths or unsaturation6; both of which are important for membrane protein function7 and properties of the lipid bilayer8. To identify bound ligands without prior extraction/separation, we require an nMS platform capable of detecting intact protein-ligand assemblies (>tens of kDa) while simultaneously enabling complex dissociation and selection then fragmentation of ligands (<1,500 Da). This requires multiple rounds of MS (MSn), which has until now been largely restricted to small molecule “omics” applications9, or to identifying proteins in assemblies using pseudo MS3 (pMS3)10,11. For membrane assemblies following ionisation of detergent-encapsulated proteins (MS1), a critical activation step is first required to remove micelles (pMS2) (Figure 1a, Extended Data Figure 1). Subsequent identification of ligands, either de novo or via spectral matching and database searching, requires at least four rounds of MS (pMS4) (Supplementary Table 1).
Figure 1. Nativeomics defines ligands bound to the trimeric membrane porin OmpF through progressive dissection using multiple stages of MSn.
(a) Schematic of the Nativeomics workflow to identify ligands or proteoform components of membrane protein assemblies. The protein-ligand complex is released from its encapsulating detergent micelle MS (pMS2) and the assembly isolated and dissociated to release proteoforms and ligands (pMS3) for selection and fragmentation (pMS4 up to MSn). Identification is achieved through spectral matching or database searching. The protein assembly is illustrated by blue spheres, with subunits coloured in different shades. Ligand is represented by red spheres or lines. (b) OmpF (PDB 4GCP) bound to drug ligand ampicillin is released from detergent micelles (pMS2), the 17+ charge state (green) isolated for activation and the ligand released at m/z 350.5 (pMS3). Isolation and fragmentation of the ligand (pMS4) yields characteristic ions that identify ampicillin following database searching or spectral matching. See Online Methods for MS parameters.
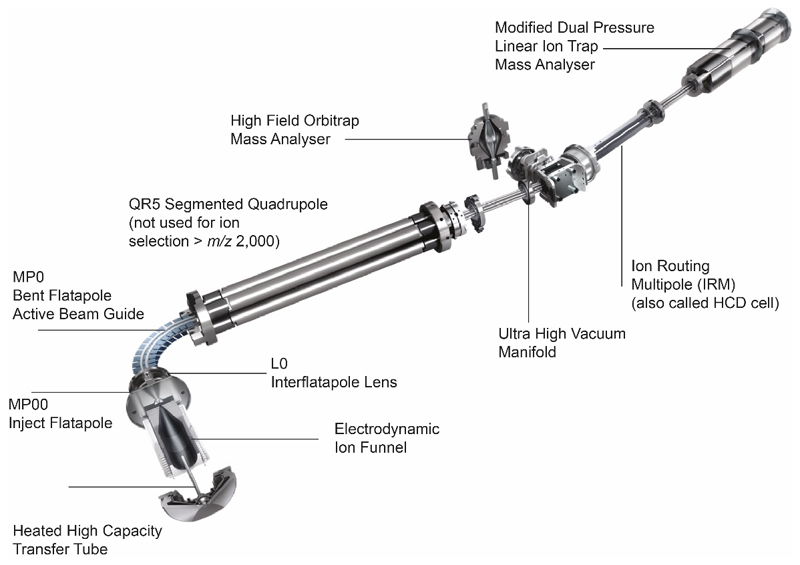
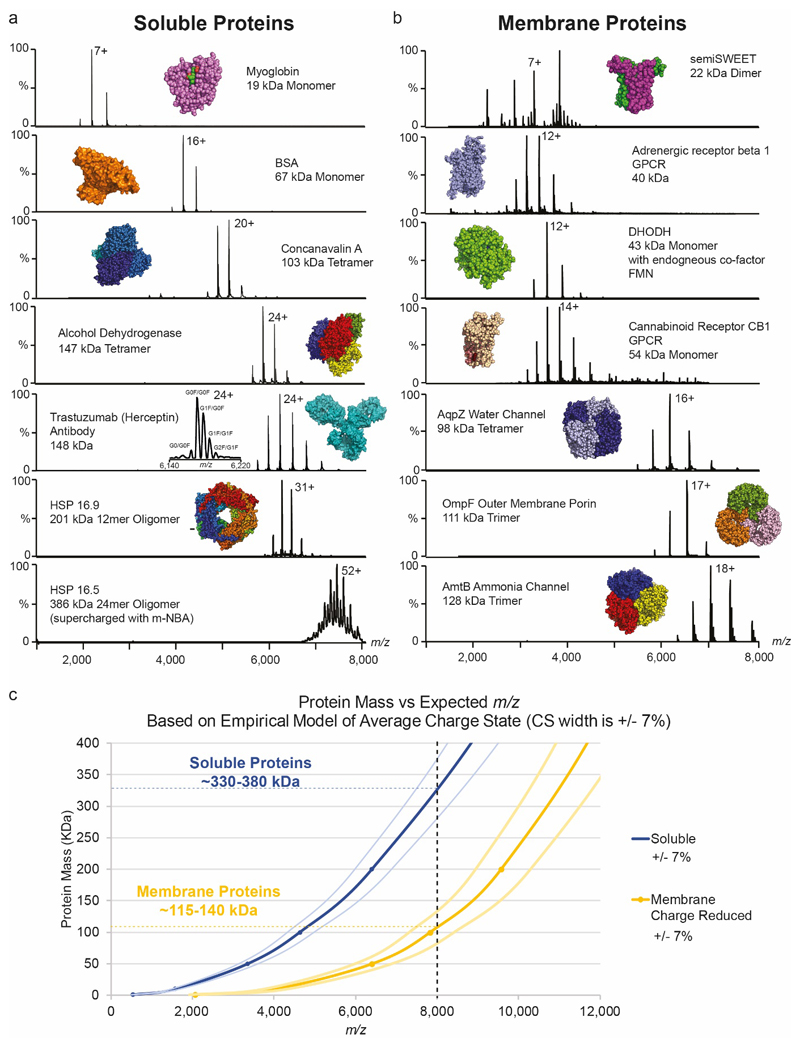
To realise this approach, we developed a new tribrid Orbitrap MS instrument, combining modifications necessary for nMS of protein complexes with the ability to perform MSn (Extended Data Figure 2). Briefly, we increased activation energies in the source/inlet region and ion routing multipole (IRM), increased the pressure in the IRM and enhanced the tuning of optics. Simultaneous transmission of ions across both high (> m/z 4,000) and low (< m/z 1,000) ranges, together with activation and selection, required alterations to ion trap operation (Online Methods). Crucially, with these modifications, we can perform nMS of both soluble and membrane assemblies and retain non-covalently bound ligands (Extended Data Figure 3, Supplementary Figures 1-3).
To highlight the potential of this “Nativeomics” platform, in which we combine nMS with “omics”based methods, we selected the E. coli outer membrane porin F (OmpF) because of its promiscuity and critical role in controlling access into bacterial cells. Since trimeric OmpF can control threading of a cytotoxic colicin, be regulated by lipid binding12, and mediate internalisation of antibiotics13 three different OmpF complexes can be formed and subsequently disrupted to release chemically diverse ligands for characterisation via MSn.
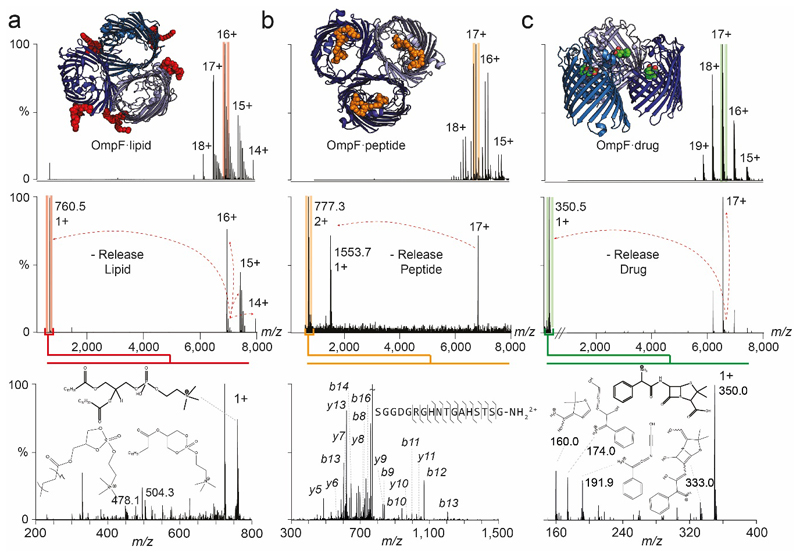
Considering first lipid binding to OmpF we released the protein from detergent micelles (pMS2) and isolated a charge state (16+) with associated lipids (pMS3). Activation promoted release of a ligand (m/z 760.5±0.1 Da), a mass consistent with at least ten phospholipids from three families (Online Methods). Fragmentation (pMS4) however defined only one lipid - phosphatidylcholine 16:0/18:1 (Extended Data Figure 4, Supplementary Figure 4). Turning to OmpF in complex with a bacteriocin derived peptide ColE9 (OBS1), three peptide-binding sites were maintained after release from detergent micelles (pMS2). Selection and activation of the peptide-bound trimer (17+) yielded ion (m/z 777.3) (pMS3) for fragmentation (pMS4) yielding b and y ions enabling assignment to ColE9 residues 2 to 18 (Extended Data Figure 4, Supplementary Figure 5). In the third case, OmpF was incubated with ampicillin. After (pMS2) the 111 kDa complex (17+) was selected releasing a ligand (m/z 360.5) (pMS3) for subsequent fragmentation (pMS4). Spectral matching assigned fragments to ampicillin (Figure 1b, Supplementary Figure 6). Together these examples demonstrate that a membrane porin bound to chemically diverse ligands (lipid, peptide, drug), can be maintained, isolated, dissociated and fragmented to yield fingerprint spectra that discriminate between potential ligand structures in databases.
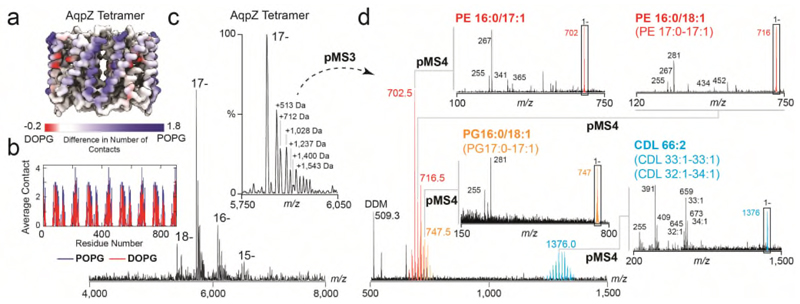
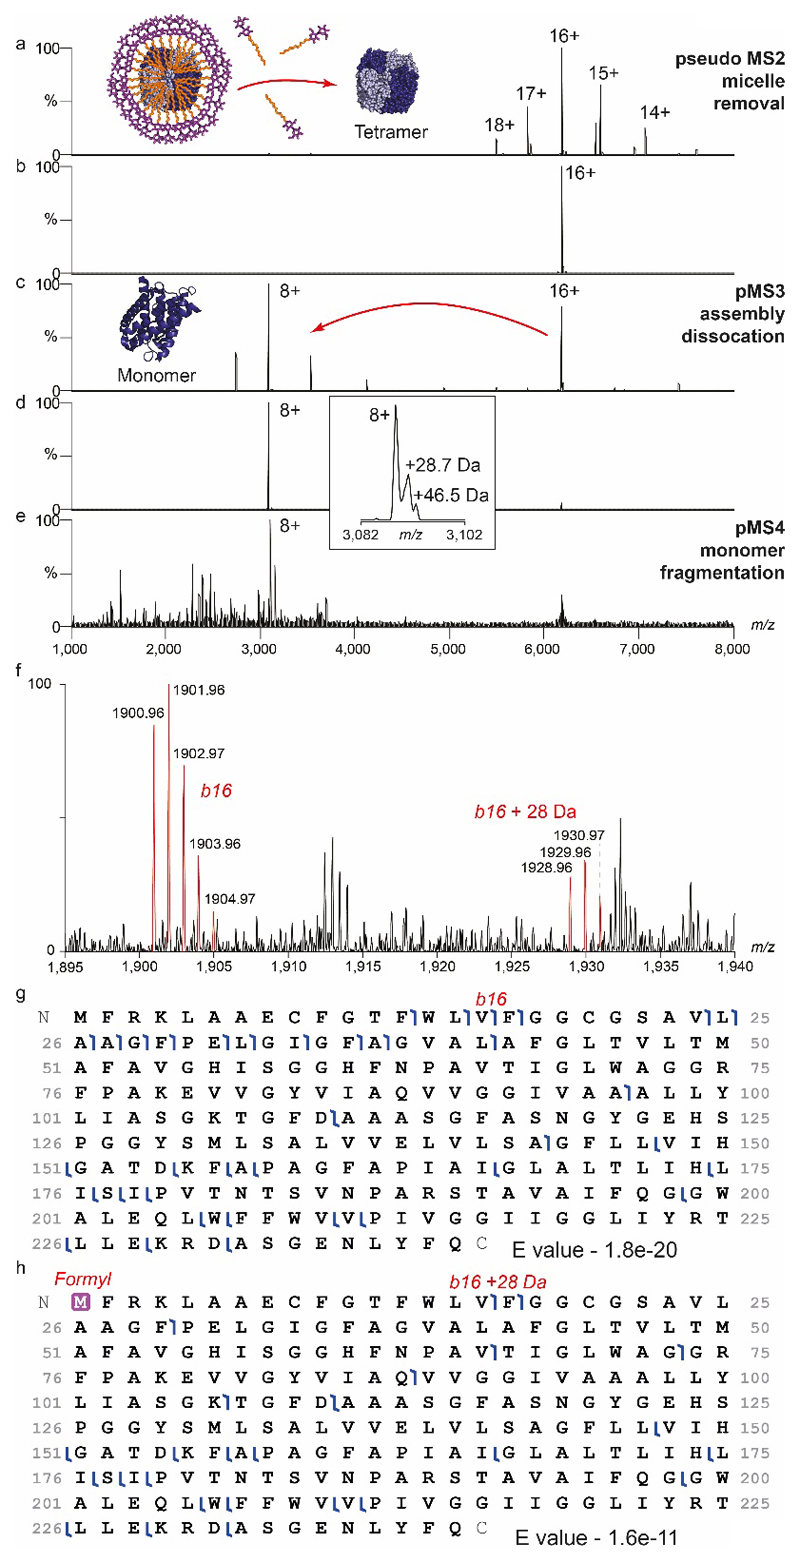
Having established proof-of-concept, we investigated aquaporin Z (AqpZ), a water channel present in E. coli membranes, for which specific lipids have been implicated in functional regulation14. Following release from detergent micelles tetrameric AqpZ, purified with endogenous lipids, displayed multiple adducts and potential protein variants (Figure 2c). Selecting and dissociating the tetramer (pMS3) revealed monomeric proteoforms for top-down fragmentation (MS4) yielding b and y ions confirming that ~30-40% of AqpZ harbours an N-terminal formylation, a modification reported previously15 (Extended Data Figure 5).
Figure 2. Nativeomics and MD simulations define the structure of endogenous lipids bound directly to aquaporin Z.
(a) Result of MD simulations of lipid binding to AqpZ performed in mixed lipid bilayers containing PG 16:0/18:1 (POPG) or 16:0/18:0 (DOPG). AqpZ is coloured according to the difference in the number of contacts between POPG (blue) and DOPG (red), averaged over the trajectories of POPG contacts. (b) Plot of the average number of contacts lipids make per AqpZ residue. (c) nMS spectrum of AqpZ acquired in negative ion polarity. Removal of detergent micelles (pMS2) reveals AqpZ charge state (17-) bound to multiple endogenous ligands. Peaks corresponding to a heterogenous mixture of multiple ligands bound to apo protein are annotated with their apparent additional mass (Da). (inset) Isolation and activation releases bound ligands (pMS3), yielding at least 46 distinct species from m/z 500-1500 and three distinct families of ligands (red, orange and blue). (d) Selection and fragmentation of individual released ligands in negative ion polarity (pMS4) produces spectra indicative of lipids. Fragment ions define the unsaturation and asymmetry of chain length through spectral matching with LIPIDMAPS20. Predominant lipids are PE 16:0-17:1, PG 16:0/18:1 and CDL 33:1-33:1 and distributions can therefore be assigned to cohorts of PE (red), PG (orange) and CDL (blue) lipids. See Online Methods for MS parameters and Supplementary Figure 8 for complete MS dataset. Lipid identification is representative of two independent protein preparations.
Concentrating on the adduct peaks associated with AqpZ (17-) we selected a wide m/z window and released multiple low m/z species (Figure 2 c,d, Supplementary Figure 7). Systematic selection and fragmentation (up to MS6) revealed families of lipids: phosphatidylethanolamine (PE) 30-32:0, 31-36:1, 34-39:2, phosphatidylglycerol (PG) - 30-32:0, 32:36:1, 34-38:2, and cardiolipin (CDL) - 62-71:0-3, as well dimers of PE-PG and detergent adducts (Fig. 2c,d, Supplementary Figure 8). Fragmentation of the most intense PE (16:0/17:1) and PG (16:0/18:1), in negative ion polarity, revealed their chain length asymmetry and extent of unsaturation; the average chain length of PG and PE lipids identified here being shorter than previously reported for larger annular belts or in bulk membranes.16 This difference may be rationalised since Nativeomics interrogates lipids in direct contact with proteins, rather than in extended shells.
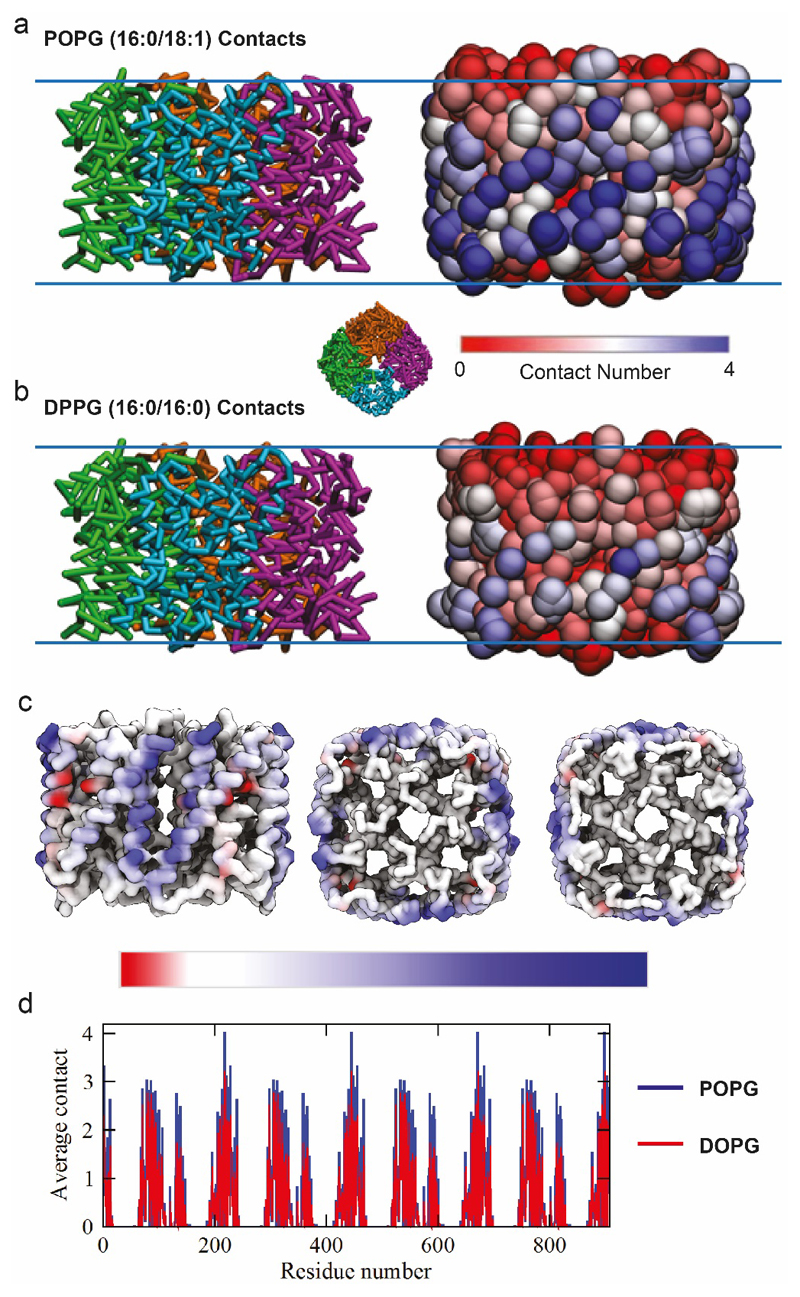
Intrigued by this preference for shorter chain unsaturated lipids, we carried out MD simulations for AqpZ in PE/PG mixed lipid bilayers containing either POPG 16:0/18:1 or DOPG 16:0/18:0. The average number of contacts between aquaporin residues and POPG was consistently higher than for DOPG over the simulation time course (100 ns) (Figure 2a, b Extended Data Figure 6). Since the only difference is in unsaturation of the tail this suggests that POPG 16:0/18:1 is pre-organised to form more favourable interactions with the protein surface than DOPG 16:0/18:0. Given that lipids can control water transport14 we speculate that PG, with shorter chain lengths and unsaturation, could play a role in regulating channel permeability within the membrane.
We next extended our approach to the outer mitochondrial membrane translocator protein, (TSPO) - a critical drug-target up-regulated under various pathological conditions, and for which ambiguous electron density has been assigned to ligands1. A dimeric crystal structure of the protein from Rhodobacter sphaeroides (RsTSPO), a bacterial homologue harbouring an A147T mutation associated with neurological disease, revealed a binding site for a porphyrin derivative and several surface associated mono-oleins1. Intriguingly the length of electron density, between helix 1 of one monomer and helix 4 of the other, is not fully satisfied and is longer than any known components present in the crystallisation conditions. This could imply a continuous transport pathway, occupied by several ligands simultaneously, or a novel ligand not yet considered, making this an ideal case for our Nativeomics platform.
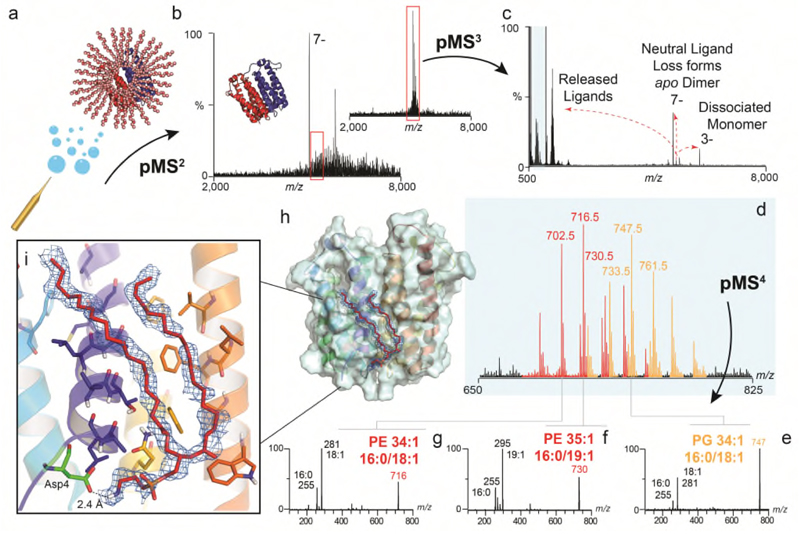
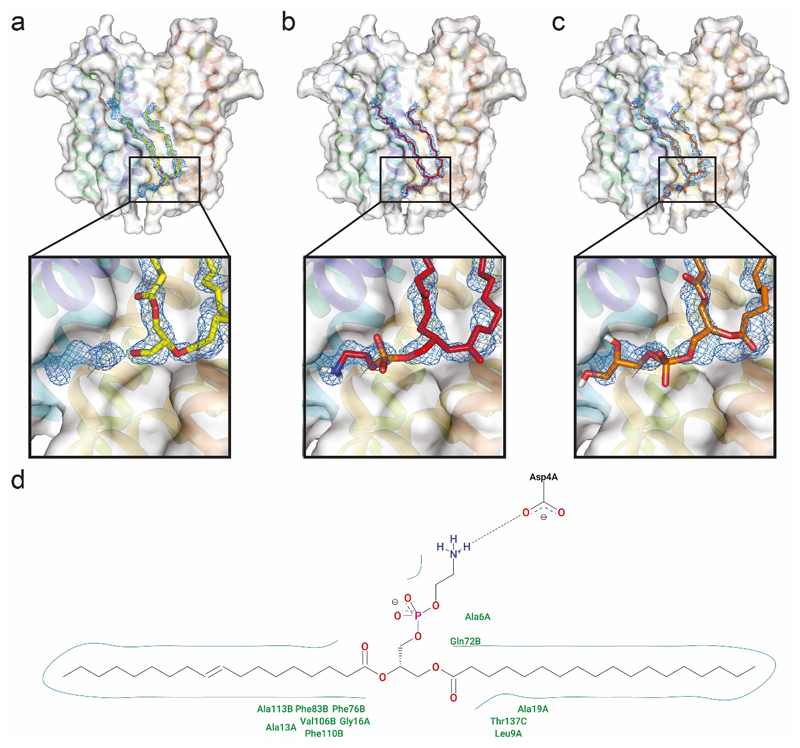
Following expression of TSPO in E. coli, we extracted the protein and performed Nativeomics. We observed multiple detergent adducts adhering to the TSPO dimer together with an unknown ligand (+716 Da) (Figure 3, Supplementary Figure 9). Isolation of the ligand-bound protein dimer, and dissociation (pMS3), revealed detergent clusters and a series of homologous lipids centred at m/z 716, primarily PE species (from 32:1 to 36:2). Negative ion pMS4 revealed the component tail lengths; of interest is PE 16:0/19:1 due to its highly asymmetric acyl chains. The predominant PE bound to TSPO dimers however is PE 34:1 (16:0/18:1). We therefore fitted PE, and as a comparison PG (16:0/18:1), into the electron density in the TSPO crystal structure (Figure 3, Extended Data 7). The PE-model features a deeper penetration of the electron density by the tails and lipid head group, which also interacts favourably with nearby amino acids, while the terminal amine interacts with Asp4. Other homologous PEs with different acyl tails (e.g. 16:0/19:1 and 18:1/18:1) can also be accommodated within the electron density, suggesting that phospholipid modelling is improved by defining the headgroup, side chain asymmetry and chain length distribution. Our results suggest a specific lipid binding site and contribute to growing evidence that implicates TSPO in lipid transport17.
Figure 3. Identification of unknown ligands bound to TSPO and subsequent fitting of PE 16:0/18:1 into unresolved electron density in the X-ray structure.
(a) Schematic showing electrospray and release of the TSPO dimer from detergent micelles in negative ion polarity (subunits red and blue cartoon, with detergent micelle orange spheres) (b) Native mass spectrum of the TSPO dimer (pMS2) and isolation of the 7- charge state (red box) (inset). (c) Collisional activation (pMS3) yields dissociated monomer, apo dimer produced from neutral ligand loss, and multiple ligands at low m/z (blue box). (d) Zoom of low m/z region showing two peak series corresponding to multiple lipids PE (red) and PG (orange). (e-g) Isolation and subsequent fragmentation of released lipids (pMS4) defines the hydrocarbon chain length and extent of unsaturation. (h) Fitting of the most abundant PE lipid identified - PE (16:0/18:1) (red sticks) into the electron density (blue mesh) in the TSPO A139T crystal structure (each monomer in blue and yellow helices) (PDB 4UC1). Critical protein-lipid interactions are shown (zoom box) with PE interacting favourably with surrounding amino acids through hydrophobic interactions and the headgroup terminal amine forming a hydrogen-bonded interaction with the carboxylic acid side chain of Asp4 (green sticks). Other homologous PEs with different acyl tails (e.g. 16:0/19:1 and 18:/18:1) can also be accommodated within this density. See Online Methods for MS parameters and Supplementary Figure 9 for complete MS dataset. Lipid identification is representative of two independent protein preparations.
Previously reported methods provide invaluable information on protein-ligand interactions. Thermal shift assays and collision-induced unfolding yield stability measurements of membrane proteins in the presence of lipids added following purification18,19. In a recent landmark study, combining bioinformatic and genetic screening, as well as synthesis of >200 peptides for three independent screening platforms, several GPCRs were successfully deorphanised3. However, an important distinction between Nativeomics and the methods outlined above, is that there is no selection of lipids or peptides to test, rather it is the native endogenous ligand(s) that are captured and interrogated within the environment of the folded protein assembly. Potential limitations of Nativeomics include failure to capture, ionise or fragment ligands or to characterise a novel ligand not yet described in databases. Importantly, however, Nativeomics can be deployed to characterise proteoforms and associated lipid, metabolite and protein binding partners, in a single “discovery-mode” top-down experiment, maintaining the essential link between ligand and protein throughout. Many applications are made possible by this platform, including defining unknown electron density in high-resolution maps and uncovering key metabolites, endogenous ligands and cofactors within the large body of membrane protein transporters and receptors for which no function is currently assigned.
Online Methods
Expression, purification and preparation of proteins for native mass spectrometry
Soluble proteins myoglobin (Sigma M1882), bovine serum albumin (Sigma A2153), concanavalin A (Sigma C2010) and alcohol dehydrogenase (Sigma A7011) were purchased from Sigma Aldrich, UK and reconstituted in water or PBS buffer at approximately 1 mg/mL. Antibody Herceptin (Roche) was reconstituted in PBS buffer at approximately 1 mg/mL. Prior to mass spectrometry all proteins were buffer exchanged by size exclusion chromatography (SEC) into 100 mM – 1 M ammonium acetate pH 6.8-7.5 using P6 Biospin columns (BioRad) and concentrations adjusted to 5-10 μM protein complex. Multiple buffer exchanges were sometimes performed to achieve sufficient desalting.
HSP 16.9 AND 16.5 were expressed, purified and prepared for native MS as previously described21,22.
Vibrio sp. N418 semiSWEET was expressed in a pJexpress411 vector containing sequences for a 3C protease cleavage site and a histidine tag (DNA2.0) and purified as previously described23. semiSWEET was exchanged into 200 mM ammonium acetate containing 2×critical micelle concentration (CMC) tetraethylene glycol monooctyl ether (C8E4) detergent (Generon, Berkshire, UK) using a P6 biospin column (BioRad) for nMS analysis.
Human DHODH was N-terminally His6-tagged with a 30-residue N-terminal deletion to remove the mitochondrial localization sequence and a putative transmembrane helix (theoretical molecular mass 42,420 Da) and was expressed and purified as described.24 Proteins were stored at a concentration of approximately 10 μM in 20 mM phosphate buffer, pH 8.0, containing 10 mM lauryldimethylamine-N-Oxide (DDAO/LDAO) detergent (Generon, Berkshire, UK) before exchange into 100mM ammonium acetate pH 7.5, 2×CMC LDAO for nMS analysis.
Cannabinoid Receptor CB1 and Beta-1- Adrenergic Receptor were expressed and purified as previously described25,26, where LMNG and DDM were used for purification respectively. Prior to MS analysis both proteins were buffer exchanged as previously described27.
OmpF was expressed and purified as described previously28 before being exchanged into 100-200 mM ammonium acetate 2×CMC C8E4 detergent for nMS by preparative SEC using a 3mL Superdex 200 Increase 15/150 size column.
E. coli Aquaporin Z (AqpZ) was expressed and purified as described previously29 in 2×CMC DDM detergent before being buffer exchanged into SEC buffer containing 2×CMC C8E4 detergent using Superdex 200 Increase 10/300 column then into 200mM ammonium acetate 2×CMC C8E4 detergent, or directly into 200mM ammonium acetate 2×CMC C8E4 detergent. This resulted in a preparation of AqpZ devoid of lipid or retaining significant amount of endogenous lipid bound to the assembly respectively. Experiments to determine endogenous lipids bound to AqpZ were repeated twice from two distinct protein preparations.
E. coli Ammonia channel (AmtB) was expressed and purified as described previously29 in 2×CMC DDM detergent before being buffer exchanged using preparative SEC using a 24 mL Superdex 200 Increase 10/300 column into buffer containing 2×CMC C8E4 detergent, before being buffer exchanged into 200mM ammonium acetate, 2×CMC C8E4 detergent.
For generation of the Rhodobacter sphaeroides TSPO A139T mutant, the wild type Rs TSPO gene was cut from the pET29 vector (containing the C-terminal 6-His tag) at NdeI and XhoI cloning sites. The gBlock gene fragment (Integrated DNA Technologies) encoding the TSPO A139T mutant (excluding the first two M residues) was then inserted into the vector between the same cloning sites using an In-Fusion cloning kit (Clonetech). TSPO A139T was expressed by the auto-induction method and purified as previously described30 (including the trypsin tag cleavage), with DM detergent replaced by 2×CMC DDM detergent during all purification steps, before being exchanged into 2×CMC C8E4 for nMS. Experiments to determine endogenous lipids bound to TSPO were repeated twice from two distinct protein preparations.
Preparation of Proteins for Native Mass Spectrometry
Soluble proteins were buffer exchanged to 200 mM ammonium acetate using P6 Biospin columns (Bio-Rad). Membrane proteins were buffer exchanged to 200 mM ammonium supplemented with 2×CMC detergent prior to nMS analysis as described in detail above. Protein concentrations were adjusted to 1-10 μM complexes concentration and introduced into the mass spectrometer using gold coated glass capillaries prepared in-house as previously described31. For identification of ligands bound to AqpZ and TSPO, the total protein complex concentration was between 1-5 μM. Complexes and dissociated ligands were visible over a dynamic range of ~2 orders of magnitude total intensity, with a conservative estimate on the dynamic range for Nativeomics to be >500 nM. These factors will strongly depend on the ionisation efficiency of both the complex and the ligand. We expect a similar dynamic range and sensitivity for other membrane protein-ligand assemblies.
Optimisation and Operation of Orbitrap Eclipse Platform for Native and Multistage MS (Nativeomics)
Mass spectra were recorded on an Orbitrap Eclipse tribrid mass spectrometer (Thermo Fisher Scientific) equipped with a Nano Flex NG nanospray source and offline nanospray source head. The Orbitrap Eclipse mass spectrometer is a quadrupole/Linear Ion Trap Orbitrap tribrid mass spectrometer, similar in architecture to the Orbitrap Fusion and Lumos tribrid mass spectrometers9 (Thermo Fisher Scientific) but with a number of significant hardware modifications to accommodate nMS. The most relevant are - greater in-source activation energies for desolvation (up to ~250 V), higher pressures available (up to 20 mTorr) in the ion routing multipole (IRM, also called HCD cell), optimized HCD collision energies in the IRM for higher charge state species (>25), the ability to trap, isolate and activate high m/z ions (up to 8,000 m/z) in the quadrupole-linear-ion-trap (QLT), and the option to automatic gain control (AGC) regulate and detect ions in the Orbitrap up to m/z 8,000.
Prior to nMS experiments a full set of instrument calibrations were performed in positive and negative polarities in “Peptide Mode” (IRM pressure at 8 mTorr) and “Intact Protein Mode - High Pressure” (IRM pressure at 20 mTorr) using Pierce™ FlexMix™ Calibration Solution (Pierce). These ion optic calibrations optimize ion transfer by tuning various lens and multipole voltages. These calibrations must be run at different pressure settings because the optimal voltages vary depending upon the ion energy distributions and trapping efficiencies. Furthermore, various Orbitrap and ion trap calibrations were run to ensure optimal spectral quality and mass accuracy in the higher m/z range (e.g., Orbitrap enhanced Fourier transform (eFT) calibration at a higher centre electrode injection voltage and ion trap mass and resolution).
The mass spectrometer was operated in both positive and negative ionisation modes with spray voltages of ±1.0-1.6 kV and source temperatures of 30-200°C. Samples were introduced into the mass spectrometer using borosilicate glass capillaries prepared in-house. Negative ion polarity, was used, such that negatively charged ligand ions could be generated following dissociation of the protein ligand complex. Some ligands are typically lost as neutral species in the positive ion mode. Negative ion MS/MS of ligands can also provide unique fragment ions which are not present in MS/MS spectra acquired in positive polarity which aid in ligand identification. For intact native mass measurement, the first step of multistage MSn experiments, the MS was operated in High Pressure Mode, Full Scan and usually with Full Profile Mode toggled “on” in the diagnostics panel. Ions were passed through the electrodynamic ion funnel, the atmospheric interface ion optics (MP00, L0, and MP0), the quadrupole mass filter, which was operated in RF only mode (only high-pass mass selection), and were eventually trapped in the IRM before being transferred back to the C-trap and Orbitrap for mass measurements. The mass range was set to “high m/z”, AGC targets of 50-250% and max injection times of 10-100 ms. One to ten microscans were acquired per scan and averaging was generally turned off. Resolution was routinely 15,000 at m/z 200 corresponding to a transient time of 32 ms, but could be adjusted as desired. In-source activation (sid) (0-250 V) was applied to enhance desolvation and improve signal intensity (for example see Supplementary Figure 2). Note – for consistency with the acquisition and data analysis software we have sometimes used the acronym “sid” to refer to activation performed in-source. It should not be confused with the similar acronym SID - surfaced induced dissociation. The IRM pressure was adjusted to maximise signal intensity and retention of bound ligands (for example see Supplementary Figure 1).
For native MS of most assemblies within the m/z range of this instrument (Extended Data Figure 3), the optimal IRM pressure was ~15-20 mTorr. For membrane proteins the removal of micelles or other membrane mimetics was performed by applying in-source activation (10-250 V). When in-source activation is applied, further enhancement of the ion signal normalised level (NL) can be achieved by lowering the offset of the API ion optics relative to the rest of the instrument potentials (voltage rollercoaster)32 (see Supplementary Figure 3). When tuning parameters for nMS with retention of covalent ligands, a compromise between signal intensity and ligand retention is often necessary. Conditions that maximise ion transmission may be “activating” and deposit a significant amount of internal energy into the ions, resulting in ligand dissociation. This is particularly the case for labile membrane protein complexes. Charge-reduction methods, such as working with charge reducing detergents and reagents 29,33, or switching the ion polarity34 can also be used to minimise activation energies and reduce ligand loss through charge mediated processes.
Multistage native MSn (Nativeomics) can be used to identify ligands from both soluble and membrane protein assemblies. For MSn experiments for ligand or proteoform ID from membrane protein assemblies, a minimum of 4 stages of MS/MS are required (Extended Data Figure 1, Supplementary Table 1). To achieve this, the instrument is operated in MSn mode in the Tune software. For MS/MS steps, collision energies are expressed as normalised collision energies (NCE %) as in the acquisition software. For most experiments the precursor charge state was set to 1. Exact settings depend on the identity of the parent complex as well as the mass (m/z) of the dissociated ligand or proteoform but in general the initial pseudo MS2 step (pMS2) was performed in-source by application of in-source activation (10-250 V). This activation step is referred to as pseudo MS2 since it proceeds without prior isolation of ions. In the pMS3 step, the protein complex was isolated in the ion trap using an appropriate width and centre mass, and either activated in situ (CID NCE 1-40%) or more usually transferred to the IRM for activation (HCD NCE 1-40 %) to promote dissociation into ligands and proteoforms. AGC target values (20-2000 %) and max injection time (10-300 ms) were adjusted manually to maximise normalised level and detection at this stage was typicallly performed in the Orbitrap at high m/z range. Higher resolution settings can be employed to enhance the intensity of ligand signals at low m/z. For very low m/z ligands detached from large assemblies (for example see Figure 1b), to achieve optimal transmission and detection, it may be necessary to monitor the dissociation at the intact complex level, as described above. In this way appearance of charge-reduced apo protein ions indicates loss of charged ligands. The dissociated product may then be analysed separately in the IT using the ”Normal” m/z range and settings. For pMS4 to pMSn experiments the detached ligand or proteoform was isolated in the ion trap and activated, either in situ by CID or in the IRM by HCD, with AGC or maximum injection time settings as described for pMS3. At this stage detection was usually performed in the IT using the appropriate mass range settings, due to the lower signal intensities. Spectral averaging, or higher numbers of microscans, can be used to enhance signal to noise. Acquisition times are typically seconds to a few minutes. Data are analysed using the Xcalibur software package v2.2-4.1 (Thermo Fisher Scientific).
Binding of OBS1 peptide, POPC lipid and ampicillin to OmpF trimer and Nativeomics parameters
Lipid stocks of 1-palmitoyl-2-oleoyl-glycero-3-phosphocholine (POPC) (Avanti Polar Lipids Inc., Alabaster, USA) were prepared as previously described35 and diluted in ammonium acetate supplemented with 2×CMC detergent prior to binding experiments. OmpF was prepared for nMS then incubated with POPC lipid. The protein lipid ratio was varied to achieve the desired binding ratio.
OBS1 peptide (NH2-2SGGDGRGHNTGAHSTSG18-CONH2) was diluted from a single stock solution into 200 mM ammonium acetate containing 2×CMC detergent and incubated with OmpF as described previously36. Spectra were recorded and concentrations varied until the desired 3:1 OBS1:OmpF-trimer ratio was achieved.
Ampicillin (BP41760-25 Fisher) was dissolved into 200 mM ammonium acetate containing 2×CMC detergent and incubated with OmpF at increasing concentrations until the desired 3:1 ampicllin:OmpF-trimer ratio was achieved.
Experimental parameters for Nativeomics of POPC, ampicillin or OBS1 bound to OmpF are as follows -
pMS2 level (measure intact complex) in-source activation 150-250 V, detection Orbitrap High m/z range, tune AGC Maximum Injection Time, Target (%) and Averaging depending on signal intensity. pMS3 level (dissociate ligand) in-source activation 150-250 V, activation type HCD, Isolation width > m/z 50 as desired, HCD NCE 10-30% Charge set to 1, detection in Orbitrap High m/z range (use IT for low intensity ligands and Normal mass range for very low m/z ligands), tune AGC Maximum Injection Time, Target (%) and Averaging depending on signal intensity. pMS4 level – MS/MS of ligand, as above, plus, Activation Type CAD or HCD, Isolation width 3-10, Detection in IT, Normal m/z range, tune AGC Maximum Injection Time, Target (%) and Averaging depending on signal intensity.
Spectral Matching & Database Searching
To identify ampicillin bound to OmpF the averaged pMS4 spectrum was compared to a reference spectrum for ampicillin (HMDB ID - HMDB0014559) from the Human Metabolite Database37 and annotated accordingly. For the 760.5±0.5 Da lipid bound to OmpF, an [M+H]+ lipid adduct of this mass could be attributed to a priori to over 10 lipids from PE, PC and PS classes, such as isobaric PE (37:1) and PC (34:1), based on single m/z search of the LIPIDMAPS20 COMP_DB database. To identify the lipid as PC 16:0/18:1 MS4 spectra were compared to a reference standard (LIPIDMAPS ID LMGP01010005). To identify the OBS1 peptide theoretical fragment ion masses were generated, based on the sequence and C-terminal amination, using an in-house tool and then assigned manually.
To identify the proteoforms of AqpZ the raw data was processed using ProsightPC v4.1.18 (Thermo Fisher Scientific) and searched against a single protein database containing the AqpZ sequence. Briefly, fragmentation scans from AqpZ monomer were averaged and exported as a single spectrum using Qualbrowser. This .raw file was then imported using the Import Profile tool and processed using the THRASH algorithm (S/N1.2, Max charge 10, max mass 30,000 Da, minimum IRL 0.8). We then searched for b/y ions with a fragment tolerance of 20 ppm. Ions corresponding to formylated N-terminal fragments were manually validated.
Modelling of interactions between AqpZ and POPE lipids
In silico simulations were performed with the GROMACS simulation package (version 5.1.2) and the Martini coarse-grained force field (version 2.2)38,39. Bilayers, which were composed of either POPE and POPG, or POPE and DPPG in a 4:1 ratio, were constructed with the CHARMM-GUI Martini Bilayer Maker40. The initial simulation cells were ~ 15 x 15 x 15 nm and contained lipids, water particles, and counterions. The bilayers were subjected to energy minimization steps and were then equilibrated by restraining the motion of the lipid headgroups along the membrane normal (z-axis). The magnitude of restraint forces acting on the lipid headgroups was reduced incrementally over a series of successive equilibration simulations to form a stable lamellar bilayer structure. The bilayers were subsequently simulated without restraint forces for 100 ns to converge the bilayer properties. Subsequently, the membranes were combined with aquaporin and any lipids that overlapped with the protein were removed. The membranes were hydrated with water (15749 Martini W particles) and enough monovalent cations (Martini NA particles) to neutralize the system charge. After energy minimization with the steepest descent algorithm, the membranes were equilibrated for 100 ns using a 5 fs time step. The systems were then simulated for 3780 ns using a 9 fs time step and the last 1000 ns of simulation time were used for analysis. During production time, the pressure was maintained at 1 bar using the Parrinello-Rahman semi-isotropic barostat (12.0 ps coupling constant)41, while the temperature was maintained at 303.15 K using the V-rescale thermostat (1.0 ps coupling constant). The Lennard-Jones potential was cut off at long ranges using the potential shift Verlet scheme. Electrostatics were controlled with the reaction field method, with dielectric constants of 15 and infinity for charge screening in the short-range and long-range regimes.
Fitting of identified ligands into TSPO electron density
For re-refinement, atomic coordinates and structure factors were downloaded from PDB (PDB ID 4UC1) and the EDS server respectively and displayed in COOT v0.8.9.242. Previously, the observed extra electron density was assigned as diacylglycerol (16:/18:1), without direct confirmatory evidence for its identity and missing any head group chemistry30,43. With our Nativeomics platform, we were able to detect several endogenous PE and PG lipids with varying chain lengths. Fitting of these lipids into the density in place of the diacylglycerol was adjusted manually and real-space-refined using COOT. All models for lipids were generated using the elbow44 module in PHENIX v1.15.2-3472 45. Fitted models were then subjected to global refinement and minimisation in real space using the module ‘phenix.real_space_refine’ in PHENIX. The geometries of all models were assessed using comprehensive model validation section in PHENIX and MolProbity v4.446. Figures were prepared with Pymol (v1.7) (Schrodinger, LLC).
Data Availability
Mass spectrometry data for the main figures and Extended data are available from figshare https://doi.org/10.6084/m9.figshare.12021057.v1. All other data is available from the authors on request.
Extended Data
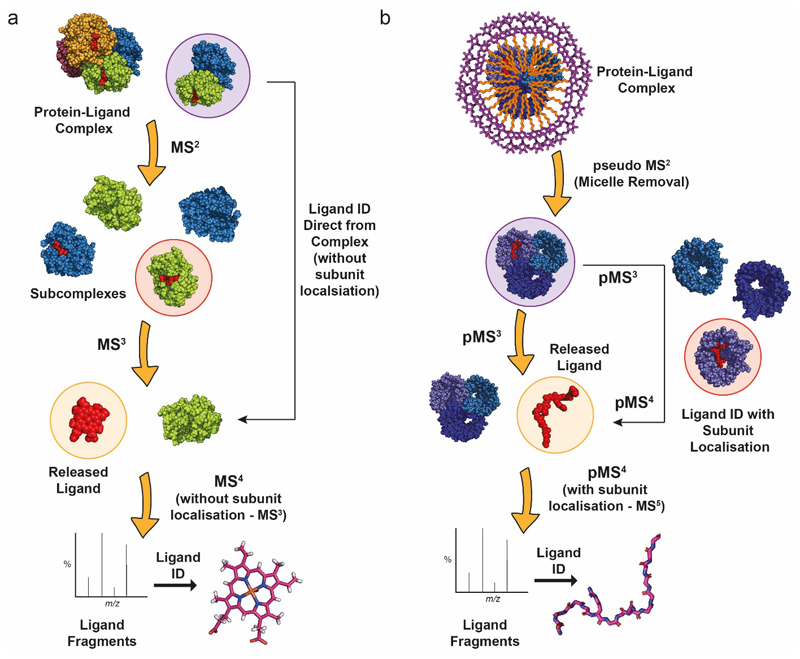
Extended Data Figure 1. Schematic of the Nativeomics workflow for identification of ligands from soluble and membrane proteins assemblies.
Successive rounds of MS/MS are applied to identify ligands bound to (a) soluble, and (b) membrane, protein assemblies. For multi-subunit complexes this can be achieved with or without subunit localisation of ligand binding, which if desired, adds at least one further MS/MS stage, as indicated in the flow schemes. (see Supplementary Table 1).
Extended Data Figure 2. Schematic of the Thermo Scientific Orbitrap Eclipse tribrid mass spectrometer.
Important components for native MS are labelled. Guidance for tuning of important parameters for native MS is provided in Online Methods and Supplementary Figures 1-3 and is applicable to both soluble and membrane proteins assemblies.
Extended Data Figure 3. Native MS of soluble and membrane protein assemblies performed using the Orbitrap Eclipse tribrid platform.
Soluble protein assemblies (a) (17-386 kDa), and membrane protein assemblies (b) (22-128 kDa) are ordered with increasing molecular mass and MS conditions were optimised to maximise ion intensity and retain the intact assembly. Charge state (CS) distributions are all approximately Gaussian (Note that DHODH has a slight LDAO effect29 and semiSWEET is mixture of monomer and dimer) and maximum CSs are as expected from native folded protein ions. The glycan profile of antibody Trastuzumab (Herceptin) is shown in the inset. In the cases of myoglobin and DHODH there is complete retention of the non-covalently bound co-factors haem and flavin mononucleotide (FMN) respectively. Most membrane proteins harbour residual detergent adducts - adduct peaks in the spectra of semiSWEET and AmtB, for example. All membrane proteins were electrosprayed from buffers containing “charge reducing”29,34 detergents. This, together with the reduction in the number of ionisable residues and reduced exposed surface area for charging, means that CSs are shifted to lower m/z values compared to soluble protein assemblies of similar mass. (c) A plot of mass against expected m/z of the average charge state (Zave) based on previously observed empirical relationships29 indicates good agreement between the size of complexes predicted, and those achieved experimentally, up to the m/z 8,000 limit of the instrument. Arbitrary bounds of ±7% are included to represent the approximate width of the CS envelope. Curves are Zave = a MW^b where a=0.0467 and b = 0.533 for soluble proteins and a= 0.0036, b= 0.71 for membrane proteins29. HSP16.5 oligomers usually appear at > m/z 8,000 but have been supercharged with meta nitro benzyl alcohol47 to shift the CS envelope into a range below m/z 8,000.
Extended Data Figure 4. Nativeomics defines lipid, peptide and drug bound to the trimeric membrane porin OmpF through progressive dissection using multiple stages of MSn.
(a) OmpF bound to lipids is released from detergent micelles (pMS2), the 16+ charge state isolated (red), with lipids released from the complex (pMS3), the peak (m/z 760.5) is then isolated and fragmented to yield fragments at m/z 504.3 and 478.1 (MS4). Spectral matching assigns this lipid as PC 16:0/18:1 (b) OmpF bound to peptide OBS1 is released from detergent micelle (pMS2) and a charge state assigned to the OmpF trimer and three OBS1 peptides was isolated (17+, orange) for pMS3. m/z 777.3 is isolated and fragmented (pMS4) to yield b and y ions that enable peptide sequence determination. (c) OmpF bound to ampicillin. The 17+ charge state (green) was isolated for activation and the ligand released at m/z 350.5 (pMS3). Fragmentation (pMS4) yields characteristic ions that identify ampicillin following database searching or spectral matching. For MS parameters see Online Methods.
Extended Data Figure 5. Nativeomics applied to AqpZ tetramer to progressively dissect the assembly and identify multiple proteoforms.
(a) pMS2 effects the removal of the C8E4 detergent micelle in the source region (in-source activation 136V, source compensation voltage 10%) (b) the 16+ charge state (m/z 6,183) is then selected using the ion trap and (c) dissociated (MS3) in the HCD cell (NCE 22%) ejecting monomers. (d) Isolation of the monomer (8+) (m/z 3,090) is performed in the ion trap, the inset (expansion) shows additional species at ~ +29 Da and ~ +46 Da. (e) pMS4 top-down fragmentation (CID NCE 20%) of these species in the ion trap and detection at high-resolution in the Orbitrap reveals predominantly b and y fragment ions in the low m/z region. (f) Assignment of the 1+ charge, b16 ion at m/z 1,900.96, and +28 Da partner at m/z 1,928.96 is consistent with assignment of the +28 Da modification to N-terminal formylation as previously suggested15. Percentage formylation of 30-40% estimated based on b ion intensity ratios. (g) Coverage of non-modified AqpZ identified with E value of 1.8e-20. h) Coverage map of N-terminally formylated AqpZ identified with E value of 1.6e-11.
The top-down data presented here, does not represent a fully optimised top-down experiment for proteoform ID. Longer acquisition times and other complimentary fragmentation methods would likely improve sequence coverage, however, this data clearly demonstrates the capability of the modified ion trap on the Orbitrap Eclipse platform for isolation and fragmentation of high m/z ions (m/z 3,000-8,000). Furthermore it showcases the application of protein-centric Nativeomics to isolate individual membrane protein assemblies from mixtures, dissect them into subunits and identify proteoforms through top-down pMS4. Data is representative of two biological repeats.
Extended Data Figure 6. MD simulations of AqpZ in mixed lipid bilayers.
(a) Side view snapshots of aquaporin in the POPE-POPG bilayer after 3780 ns of simulation time. Snapshots show the protein backbone-bonding scheme (left) and using a RWB colour bar, protein residues are coloured according to the number of times they come into contact with POPG lipids (based on a 0.6 nm cutoff), during the last 1000 ns of simulation time (right). The inset figure shows a representative top view snapshot of aquaporin. (b) Side view snapshots of aquaporin in the POPE-DPPG bilayer after 3780 ns of simulation time. Snapshots show the protein backbone-bonding scheme (left) and using a RWB colour bar, protein residues are coloured according to the number of times they come into contact with DOPG lipids, during the last 1000 ns of simulation time (right). (c) The number of aquaporin-DOPG contacts is subtracted from the number of aquaporin-POPG contacts (during the last 1000 ns of simulation time) and the resulting quantities (per residue) are assigned a colour based on the asymmetric RWB colour bar provided. In other words, the differences in lipid binding per residue (based on a 0.6 nm cut-off) are depicted using a RWB colour scale for clarity. (d) The average number of contacts for each residue of aquaporin (based on a 0.6 nm cut-off) during the last 1000 ns of simulation time. Data are shown for the simulations with POPG (blue) and DOPG (red) lipids.
Extended Data Figure 7. Comparison of TSPO lipid structures after fitting lipids into the electron density map of TSPO structure (PDB 4UC1).
The FEM omit map, is shown in blue and is contoured at 1.0s. (a) shows the previous fitting where DG(16:0/18:1) was modelled (yellow sticks), (b) shows PE(16:0/18:1) fitting, which is accommodated extremely well (red sticks) (c) shows PG(16:0/18:1) fitting (orange sticks) with quite poor matching between the PG headgroup and electron density in that region (d) displays the favourable interactions between PE (16:0/18:1) and the protein, notably the hydrogen bond between the terminal amine and the aspartic acid Asp4. Hydrophobic and hydrogen bonding interactions are indicated (green and black dots respectively).
Supplementary Material
Acknowledgements
C Robinson is funded by a Wellcome Trust Investigator Award (104633/Z/14/Z), an ERC Advanced Grant ENABLE (641317) and an MRC Programme Grant (MR/N020413/1). M Landreh is supported by an Ingvar Carlsson Award from the Swedish Foundation for Strategic Research and a KI Faculty-funded Career Position. For the provision of computational resources, we thank the HECBioSim Consortium (EPRSC grant EP/R029407/1), and The University of Southampton High Performance Computing Facilities, Iridis 4 & 5. This research was also supported by an EPSRC Institutional Sponsorship 2016 award (EP/P511377/1) to J Gault and C Robinson. C Robinson and J Gault perform consultancy services for OMass Therapeutics Ltd., and H-Y Yen and I Liko are employees of that company. J Gault is a Junior Research Fellow at The Queen’s College, Oxford.
The authors would like to thank, Nicholas Housden and Colin Kleanthous (University of Oxford) for providing purified OmpF and OBS1; Shane Chandler, Dale Cooper-Shepherd and Justin Benesch (University of Oxford) for HSP 16.5 and 16.9; and Vassilios Papadopoulos and Charles Essagian (McGill University Health Center) for generously providing the plasmid for Rs TSPO; Timothy Alison (University of Canterbury, NZ), Michael McDonough (University of Oxford) and Chih-Chia Su (Case Western Reserve University, USA) for helpful dsicussions with electron density fitting; Sarah Fantin and Brandon Ruotolo (University of Michigan) for insightful discussions regarding TSPO, as well as members of the Robinson, Benesch and Rauschenbach groups (University of Oxford), Thermo Fisher Scientific and OMass Therapeutics for many helpful discussions and support.
Footnotes
Author Contributions
JG, IL and CVR designed experiments with ML. JG and IL performed mass spectrometry experiments with assistance of RH and RV. MJGWL contributed to preliminary MS experiments. CM, PR, GA, MG and JS designed and implemented the Orbitrap Eclipse mass spectrometer. RH and RV assisted with the instrument setup for preliminary experiments. JG and IL expressed and purified AqpZ and AmtB. DS expressed and purified semiSWEET and TSPO. MA provided lipidated AqpZ and H-YY provided beta 1 adrenergic receptor and cannabinoid receptor. JRB performed electron density fitting experiments. DJ and SK performed all molecular dynamics simulations for AqpZ. JG, IL and CVR wrote the manuscript with input from all authors.
Competing Interests Statement
IL and HYY are employees of OMass Therapeutics. JG and CVR provide consultancy services to OMass Therapeutics. CM, PR, RH, GM, MG, RV, JS are employees of Thermo Fisher Scientific
References
- 1.Li F, Liu J, Zheng Y, Garavito RM, Ferguson-Miller S. Protein structure. Crystal structures of translocator protein (TSPO) and mutant mimic of a human polymorphism. Science. 2015;347:555–8. doi: 10.1126/science.1260590. [DOI] [PMC free article] [PubMed] [Google Scholar]
- 2.Smart OS, et al. Validation of ligands in macromolecular structures determined by X-ray crystallography. Acta Crystallogr Sect D Struct Biol. 2018;74:228–236. doi: 10.1107/S2059798318002541. [DOI] [PMC free article] [PubMed] [Google Scholar]
- 3.Foster SR, et al. Discovery of Human Signaling Systems: Pairing Peptides to G Protein-Coupled Receptors. Cell. 2019;179:895–908.e21. doi: 10.1016/j.cell.2019.10.010. [DOI] [PMC free article] [PubMed] [Google Scholar]
- 4.Coman C, et al. Simultaneous Metabolite, Protein, Lipid Extraction (SIMPLEX): A Combinatorial Multimolecular Omics Approach for Systems Biology. Mol Cell Proteomics. 2016;15:1453–66. doi: 10.1074/mcp.M115.053702. [DOI] [PMC free article] [PubMed] [Google Scholar]
- 5.Laschet C, Dupuis N, Hanson J. The G protein-coupled receptors deorphanization landscape. Biochem Pharmacol. 2018;153:62–74. doi: 10.1016/j.bcp.2018.02.016. [DOI] [PubMed] [Google Scholar]
- 6.Liebisch G, et al. Shorthand notation for lipid structures derived from mass spectrometry. J Lipid Res. 2013;54:1523–1530. doi: 10.1194/jlr.M033506. [DOI] [PMC free article] [PubMed] [Google Scholar]
- 7.Parker JL, Newstead S. Structural basis of nucleotide sugar transport across the Golgi membrane. Nature. 2017;551:521–524. doi: 10.1038/nature24464. [DOI] [PMC free article] [PubMed] [Google Scholar]
- 8.Bozelli JC, et al. Membrane curvature allosterically regulates the phosphatidylinositol cycle, controlling its rate and acyl-chain composition of its lipid intermediates. J Biol Chem. 2018;293:17780–17791. doi: 10.1074/jbc.RA118.005293. [DOI] [PMC free article] [PubMed] [Google Scholar]
- 9.Senko MW, et al. Novel parallelized quadrupole/linear ion trap/orbitrap tribrid mass spectrometer improving proteome coverage and peptide identification rates. Anal Chem. 2013;85:11710–11714. doi: 10.1021/ac403115c. [DOI] [PubMed] [Google Scholar]
- 10.Ben-Nissan G, et al. Triple-Stage Mass Spectrometry Unravels the Heterogeneity of an Endogenous Protein Complex. Anal Chem. 2017;89:4708–4715. doi: 10.1021/acs.analchem.7b00518. [DOI] [PMC free article] [PubMed] [Google Scholar]
- 11.Skinner OS, et al. Top-down characterization of endogenous protein complexes with native proteomics. Nat Chem Biol. 2018;14:36–41. doi: 10.1038/nchembio.2515. [DOI] [PMC free article] [PubMed] [Google Scholar]
- 12.Liko I, et al. Lipid binding attenuates channel closure of the outer membrane protein OmpF. Proc Natl Acad Sci U S A. 2018;115:6691–6696. doi: 10.1073/pnas.1721152115. [DOI] [PMC free article] [PubMed] [Google Scholar]
- 13.Ziervogel BK, Roux B. The Binding of Antibiotics in OmpF Porin. Structure. 2013;21:76–87. doi: 10.1016/j.str.2012.10.014. [DOI] [PMC free article] [PubMed] [Google Scholar]
- 14.Laganowsky A, et al. Membrane proteins bind lipids selectively to modulate their structure and function. Nature. 2014;510:172–175. doi: 10.1038/nature13419. [DOI] [PMC free article] [PubMed] [Google Scholar]
- 15.Lippens JL, et al. Fourier Transform-Ion Cyclotron Resonance Mass Spectrometry as a Platform for Characterizing Multimeric Membrane Protein Complexes. J Am Soc Mass Spectrom. 2017:1–11. doi: 10.1007/s13361-017-1799-4. [DOI] [PMC free article] [PubMed] [Google Scholar]
- 16.Schmidt V, Sidore M, Bechara C, Duneau JP, Sturgis JN. The lipid environment of Escherichia coli Aquaporin Z. Biochim Biophys Acta - Biomembr. 2019;1861:431–440. doi: 10.1016/j.bbamem.2018.10.017. [DOI] [PubMed] [Google Scholar]
- 17.Li F, et al. Translocator Protein 18 kDa (TSPO): An Old Protein with New Functions? Biochemistry. 2016;55:2821–2831. doi: 10.1021/acs.biochem.6b00142. [DOI] [PMC free article] [PubMed] [Google Scholar]
- 18.Nji E, Chatzikyriakidou Y, Landreh M, Drew D. An engineered thermal-shift screen reveals specific lipid preferences of eukaryotic and prokaryotic membrane proteins. Nat Commun. 2018;9 doi: 10.1038/s41467-018-06702-3. [DOI] [PMC free article] [PubMed] [Google Scholar]
- 19.Fantin SM, et al. Collision Induced Unfolding Classifies Ligands Bound to the Integral Membrane Translocator Protein. Anal Chem. 2019;91:15469–15476. doi: 10.1021/acs.analchem.9b03208. [DOI] [PubMed] [Google Scholar]
- 20.Fahy E, Sud M, Cotter D, Subramaniam S. LIPID MAPS online tools for lipid research. Nucleic Acids Res. 2007;35:W606–W612. doi: 10.1093/nar/gkm324. [DOI] [PMC free article] [PubMed] [Google Scholar]
- 21.Mistarz UH, Chandler SA, Brown JM, Benesch JLP, Rand KD. Probing the Dissociation of Protein Complexes by Means of Gas-Phase H/D Exchange Mass Spectrometry. J Am Soc Mass Spectrom. 2019;30:45–57. doi: 10.1007/s13361-018-2064-1. [DOI] [PubMed] [Google Scholar]
- 22.van Montfort RLM, Basha E, Friedrich KL, Slingsby C, Vierling E. Crystal structure and assembly of a eukaryotic small heat shock protein. Nat Struct Biol. 2001;8:1025–1030. doi: 10.1038/nsb722. [DOI] [PubMed] [Google Scholar]
- 23.Xu Y, et al. Structures of bacterial homologues of SWEET transporters in two distinct conformations. Nature. 2014;515 doi: 10.1038/nature13670. [DOI] [PMC free article] [PubMed] [Google Scholar]
- 24.Liu S, Neidhardt EA, Grossman TH, Ocain T, Clardy J. Structures of human dihydroorotate dehydrogenase in complex with antiproliferative agents. Structure. 2000;8:25–33. doi: 10.1016/s0969-2126(00)00077-0. [DOI] [PubMed] [Google Scholar]
- 25.Hua T, et al. Crystal Structure of the Human Cannabinoid Receptor CB 1. Cell. 2016;167:750–762.e14. doi: 10.1016/j.cell.2016.10.004. [DOI] [PMC free article] [PubMed] [Google Scholar]
- 26.Warne T, Serrano-Vega MJ, Tate CG, Schertler GFX. Development and crystallization of a minimal thermostabilised G protein-coupled receptor. Protein Expr Purif. 2009;65:204–213. doi: 10.1016/j.pep.2009.01.014. [DOI] [PubMed] [Google Scholar]
- 27.Yen HY, et al. PtdIns(4,5)P2 stabilizes active states of GPCRs and enhances selectivity of G-protein coupling. Nature. 2018;559:423–427. doi: 10.1038/s41586-018-0325-6. [DOI] [PMC free article] [PubMed] [Google Scholar]
- 28.Housden NG, et al. Directed epitope delivery across the Escherichia coli outer membrane through the porin OmpF. Proc Natl Acad Sci U S A. 2010;107:21412–7. doi: 10.1073/pnas.1010780107. [DOI] [PMC free article] [PubMed] [Google Scholar]
- 29.Reading E, et al. The Role of the Detergent Micelle in Preserving the Structure of Membrane Proteins in the Gas Phase. Angew Chemie - Int Ed. 2015;54:4577–4581. doi: 10.1002/anie.201411622. [DOI] [PubMed] [Google Scholar]
- 30.Li F, Xia Y, Meiler J, Ferguson-Miller S. Characterization and modeling of the oligomeric state and ligand binding behavior of purified translocator protein 18 kDa from Rhodobacter sphaeroides. Biochemistry. 2013;52:5884–5899. doi: 10.1021/bi400431t. [DOI] [PMC free article] [PubMed] [Google Scholar]
- 31.Hernández H, Robinson CV. Determining the stoichiometry and interactions of macromolecular assemblies from mass spectrometry. Nat Protoc. 2007;2:715–726. doi: 10.1038/nprot.2007.73. [DOI] [PubMed] [Google Scholar]
- 32.Mcgee JP, et al. Voltage Rollercoaster Filtering of Low-Mass Contaminants During Native Protein Analysis. J Am Soc Mass Spectrom. 2020 doi: 10.1021/jasms.9b00037. [DOI] [PMC free article] [PubMed] [Google Scholar]
- 33.Mehmood S, et al. Charge Reduction Stabilizes Intact Membrane Protein Complexes for Mass Spectrometry. J Am Chem Soc. 2014;136:17010–17012. doi: 10.1021/ja510283g. [DOI] [PMC free article] [PubMed] [Google Scholar]
- 34.Liko I, Hopper JTS, Allison TM, Benesch JLP, Robinson CV. Negative Ions Enhance Survival of Membrane Protein Complexes. J Am Soc Mass Spectrom. 2016;27:1099–1104. doi: 10.1007/s13361-016-1381-5. [DOI] [PMC free article] [PubMed] [Google Scholar]
- 35.Laganowsky A, Reading E, Hopper JTS, Robinson CV. Mass spectrometry of intact membrane protein complexes. Nat Protoc. 2013;8:639–651. doi: 10.1038/nprot.2013.024. [DOI] [PMC free article] [PubMed] [Google Scholar]
- 36.Gault J, et al. High-resolution mass spectrometry of small molecules bound to membrane proteins. Nat Methods. 2016;13:333–336. doi: 10.1038/nmeth.3771. [DOI] [PMC free article] [PubMed] [Google Scholar]
- 37.Wishart DS, et al. HMDB 4.0: The human metabolome database for 2018. Nucleic Acids Res. 2018;46:D608–D617. doi: 10.1093/nar/gkx1089. [DOI] [PMC free article] [PubMed] [Google Scholar]
- 38.Van Der Spoel D, et al. GROMACS: Fast, flexible, and free. J Comput Chem. 2005;26:1701–1718. doi: 10.1002/jcc.20291. [DOI] [PubMed] [Google Scholar]
- 39.Marrink Siewert J, Risselada H Jelger, Yefimov Serge, Tieleman D Peter, de Vries AH. The MARTINI Force Field: Coarse Grained Model for Biomolecular Simulations. 2007 doi: 10.1021/JP071097F. [DOI] [PubMed] [Google Scholar]
- 40.Qi Y, et al. CHARMM-GUI Martini Maker for Coarse-Grained Simulations with the Martini Force Field. J Chem Theory Comput. 2015;11:4486–4494. doi: 10.1021/acs.jctc.5b00513. [DOI] [PubMed] [Google Scholar]
- 41.Parrinello M, Rahman A. Polymorphic transitions in single crystals: A new molecular dynamics method. J Appl Phys. 1981;52:7182–7190. [Google Scholar]
- 42.Emsley P, Lohkamp B, Scott WG, Cowtan K. Features and development of Coot. Acta Crystallogr Sect D Biol Crystallogr. 2010;66:486–501. doi: 10.1107/S0907444910007493. [DOI] [PMC free article] [PubMed] [Google Scholar]
- 43.Wang J. Comment on ‘Crystal structures of translocator protein (TSPO) and mutant mimic of a human polymorphism’. Science (80-. ) 2015;350:519–519. doi: 10.1126/science.aab1432. [DOI] [PubMed] [Google Scholar]
- 44.Moriarty NW, Grosse-Kunstleve RW, Adams PD. Electronic ligand builder and optimization workbench (eLBOW): A tool for ligand coordinate and restraint generation. Acta Crystallogr Sect D Biol Crystallogr. 2009;65:1074–1080. doi: 10.1107/S0907444909029436. [DOI] [PMC free article] [PubMed] [Google Scholar]
- 45.Adams PD, et al. PHENIX: A comprehensive Python-based system for macromolecular structure solution. Acta Crystallogr Sect D Biol Crystallogr. 2010;66:213–221. doi: 10.1107/S0907444909052925. [DOI] [PMC free article] [PubMed] [Google Scholar]
- 46.Chen VB, et al. MolProbity: All-atom structure validation for macromolecular crystallography. Acta Crystallogr Sect D Biol Crystallogr. 2010;66:12–21. doi: 10.1107/S0907444909042073. [DOI] [PMC free article] [PubMed] [Google Scholar]
- 47.Going CC, Xia Z, Williams ER. New supercharging reagents produce highly charged protein ions in native mass spectrometry. Analyst. 2015;140:7184–7194. doi: 10.1039/c5an01710f. [DOI] [PMC free article] [PubMed] [Google Scholar]
Associated Data
This section collects any data citations, data availability statements, or supplementary materials included in this article.
Supplementary Materials
Data Availability Statement
Mass spectrometry data for the main figures and Extended data are available from figshare https://doi.org/10.6084/m9.figshare.12021057.v1. All other data is available from the authors on request.


