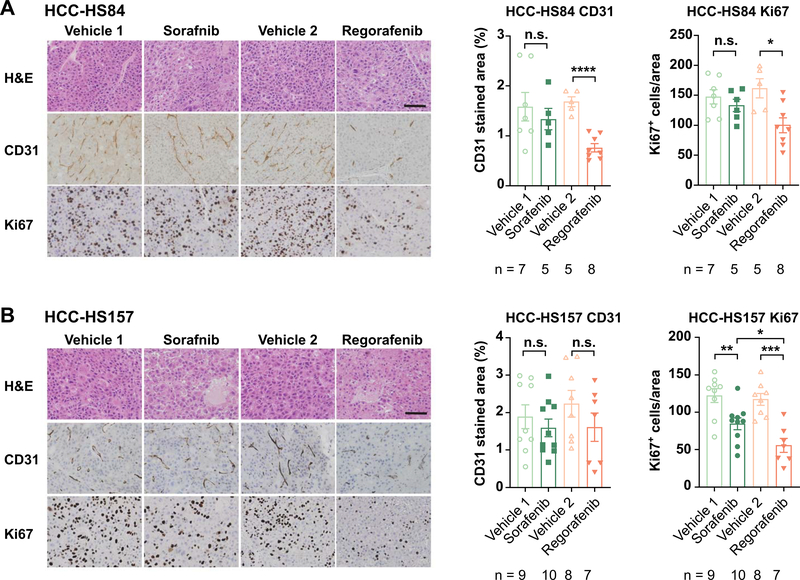
Figure 8. Effect of regorafenib and sorafenib on angiogenesis and cell proliferation in PDX models.
A. Representative images of H&E, angiogenesis (CD31), and proliferation (Ki-67) of HCC-HS84 PDX treated with Sorafenib or Regorafenib (left). Statistical analysis of CD31 positive area and Ki-67 positive cells (right). Scale bar = 100μm.
B. Representative images of H&E, angiogenesis (CD31) and proliferation (Ki-67) of HCC-HS157 PDX treated with Sorafenib or Regorafenib (left). Statistical analysis of CD31 positive area and Ki-67 positive cells (right). Scale bar = 100μm.

