Abstract
To identify non-responders to cardiac resynchronization therapy (CRT), various biomarkers have been proposed, but these attempts have not been successful to date. We tested the clinical applicability of computer simulation of CRT for the identification of non-responders. We used the multi-scale heart simulator “UT-Heart,” which can reproduce the electrophysiology and mechanics of the heart based on a molecular model of the excitation–contraction mechanism. Patient-specific heart models were created for eight heart failure patients who were treated with CRT, based on the clinical data recorded before treatment. Using these heart models, bi-ventricular pacing simulations were performed at multiple pacing sites adopted in clinical practice. Improvement in pumping function measured by the relative change of maximum positive derivative of left ventricular pressure (%ΔdP/dtmax) was compared with the clinical outcome. The operators of the simulation were blinded to the clinical outcome. In six patients, the relative reduction in end-systolic volume exceeded 15% in the follow-up echocardiogram at 3 months (responders) and the remaining two patients were judged as non-responders. The simulated %ΔdP/dtmax at the best lead position could identify responders and non-responders successfully. With further refinement of the model, patient-specific simulation could be a useful tool for identifying non-responders to CRT.
Electronic supplementary material
The online version of this article (10.1007/s00380-020-01577-1) contains supplementary material, which is available to authorized users.
Keywords: Cardiac resynchronization therapy, Non-responders, Bi-ventricular pacing, Patient-specific heart model, dP/dtmax
Introduction
The safety and efficacy of cardiac resynchronization therapy (CRT) have been proved by a number of landmark studies [1–3], but these studies also revealed that a significant proportion of patients indicated for CRT do not respond to this invasive and expensive treatment (non-responders) [4]. To reduce the number of non-responders, efforts have been made toward proper positioning of pacing electrodes, optimization of the stimulation intervals, and the development of novel pacemaker devices. However, the appropriate selection of patients remains key to solving this problem [5].
Because the mechanical dyssynchrony resulting from dyssynchronous electrical activation can be an important target of therapy, various echocardiographic indices have been evaluated regarding whether they have diagnostic value additional to electrocardiogram (ECG) biomarkers. To date, none of the large trials have reported positive findings [6, 7]. Patient characteristics, including ischemic etiology and the existence of scar tissue, are believed to affect the therapeutic response, but randomized controlled trials show controversial results [5]. Furthermore, the requirement of cardiac magnetic resonance imaging (MRI) or nuclear imaging for the accurate evaluation of scar burden may hinder its use in daily clinical practice [8]. Accordingly, only ECG indices including QRS width and morphology, such as left bundle branch block, are adopted as the criteria for class I indication in current guidelines [9, 10].
Computer simulation of the heart has emerged as a novel tool in cardiology research and its applications for CRT have already been reported [11]. Such applications include not only studies for understanding the mechanism of CRT and/or searches for optimal pacing strategies using standard heart models but also those attempting to predict therapeutic outcomes with patient-specific models, thus aiming at an alternative approach to patient selection [12, 13].
Among these, the University of Tokyo heart simulator is a multi-scale, multi-physics heart simulator, in which the function of the heart, including patient-specific mechanics and electrophysiology, is reproduced in a three-dimensional heart model based on the molecular mechanism of the excitation–contraction coupling process [14–18]. Okada et al. applied this simulation model to patient-specific CRT simulation to show that the simulated changes in ventricular function, measured by the maximum rate of rise in ventricular pressure (dP/dtmax), correlated well with the clinically observed changes in ejection fraction (EF) in a retrospective study [19]. Because, however, information on the actual pacing site was utilized, this approach cannot be translated to the prediction of non-responders in practice.
In this study, we extended this approach to examine whether the UT-Heart heart simulator can identify non-responders to CRT based only on the clinical data recorded before the CRT implantation. The results demonstrated that the heart simulator has potential to provide additional value to the current guidelines for the selection of CRT candidates.
Materials and methods
Study patients
Among the heart failure patients treated with CRT at the Kokura Memorial Hospital between April and December 2016, eight patients, whose cardiac computer tomography (CT) images were recorded before implantation, were enrolled in this study (age 77 ± 7.9 years, four men, four women; New York Heart Association functional class II/III, Table 1). Clinical data were collected with written informed consent after approval by the institutional review board. This was an observational study; therefore, the patients received standard therapy without any influence from the simulation results. The patients had follow-up echocardiograms three months after implantation and were classified as responders if the relative reduction in end-systolic volume (ESV) measured by the Simpson’s method ( ) exceeded 15%. This definition of a responder was devised prior to this study.
Table 1.
Patient characteristics
| Pt # | Age | Gender | NYHA | Diagnosis |
|---|---|---|---|---|
| 1 | 63 | F | II | Sarcoidosis, complete AV-block |
| 2 | 73 | F | II | Hypertensive heart disease, complete AV-block |
| 3 | 81 | M | II | OMI, CLBBB |
| 4 | 71 | M | III | OMI, CLBBB |
| 5 | 79 | F | III | Aortic stenosis, CLBBB |
| 6 | 79 | M | III | DCM, CRBBB + left anterior fascicular block |
| 7 | 81 | M | II | Sarcoidosis, LBBB |
| 8 | 89 | M | III | Aortic regurgitation, complete AV-block |
OMI old myocardial infarction, CLBBB complete left bundle branch block, DCM dilated cardiomyopathy, CRBBB complete right bundle branch block, LBBB left bundle branch block
Simulation
Simulations were performed based on the data recorded before implantation. Researchers participating in the simulations were blinded to the outcome until the simulations were completed. The details of the simulation method were described previously [19, 20] and are shown in the supplementary methods provided in Online Resource 1.
Patient-specific heart model
The finite element method was used for simulation with 3D models of ventricles, and upper body (torso) constructed from multi-slice CT images was subdivided into finite elements. To each of these elements, molecular models of cardiac electrophysiology with a spatially detailed sarcomere model [21] representing endocardial, midmyocardial (M-), or epicardial cells [22] were implemented in appropriate locations [17, 18]. The propagation of excitation was simulated by solving the bidomain equations. To reproduce the anisotropy in electrical conduction and mechanical response, we mapped the fiber orientation using the rule-based method [23]. The Purkinje fiber network was modeled as a thin layer on the endocardial surface with higher conduction velocity, and, in the case of left bundle branch block (LBBB), ventricular activation was started only on the right ventricular side. The infarcted region was determined from an echocardiogram and ECG. Initially, the inactive fibrous tissue property was assigned to akinetic segments as shown by an echocardiogram. The boundary of this region was then modified iteratively until the simulated ECG matched the clinically measured ECG. For cases of sarcoidosis, we changed the contractility and conduction velocity of the ventricle homogeneously because no focal abnormalities were reported by an echocardiogram.
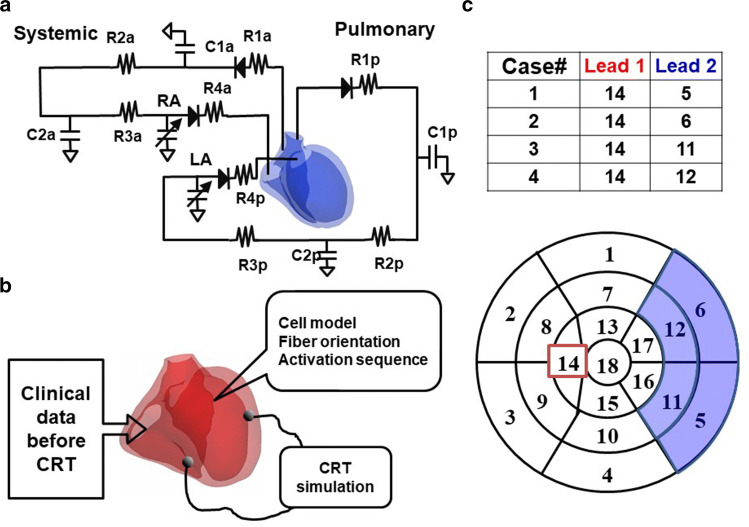
To save computational time and cost, we modeled only ventricles, and the time-varying elastance models of atria were connected with an electrical circuit analog of circulation (Fig. 1a), the parameter values of which were adjusted for each patient [19, 20, 24] (see supplementary Table 2 in Online Resource 1). Finally, contractility of the ventricles was adjusted to match the EF and non-invasive arterial blood pressure of each patient. Because invasive hemodynamic study was not available for any of these patients, end-diastolic pressure values were assigned depending on the functional class according to the literature [25].
Fig. 1.
CRT simulation. a Electrical circuit analog of systemic and pulmonary circulations. C*; capacitance R*; resistance b A diagram of CRT simulation c Lead positions. Pacing leads were placed in one of four combinations of segments indicated in the bull’s eye view of the left ventricle
CRT simulation
For each heart model, we performed CRT simulation without changing any parameters of the heart, torso, and circulation determined for the model before the treatment. Simulation was performed with the four most commonly used lead positions in each patient model. One of the pacing leads was fixed in the right ventricular apex and the other was placed in either the basal or mid-portion of the anterolateral or posterolateral segment (Fig. 1b, c). VV delay was set at 0 ms. From the simulation results, we calculated both electrophysiological and mechanical parameters. The first-order derivative of the left ventricular pressure (dP/dt) was calculated by the numerical differentiation of simulated left ventricular pressure [26].
Computation
All program codes were written in-house. They have been registered as intellectual property of the University of Tokyo. The computational time for a single beat was about 50 min for electrophysiological simulations and 30 min for mechanical simulations using 127 cores.
Statistics
Data are presented as average ± standard error of mean (SEM).
Results
Clinical results
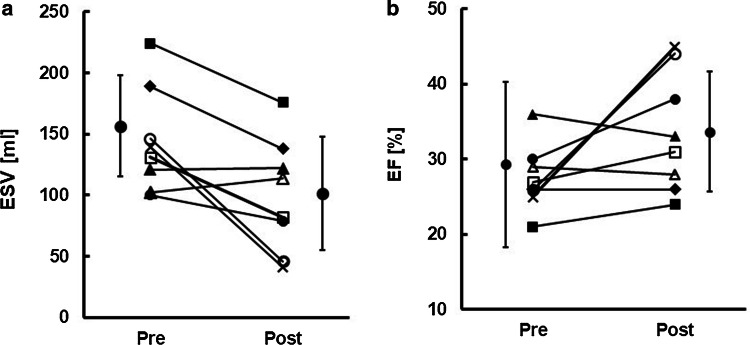
In the echocardiograms taken at the three-month follow-up, significant reductions of ESV (> 15%) were observed in six patients (responders, patient #s 1, 2, 3, 4, 5, and 8) (Fig. 2a). Patient #s 6 and 7 were judged as non-responders. We also noted that higher degrees of recovery exceeding 65% were introduced in two patients (super-responders, patient #s 2 and 8) (x and open circle in Fig. 2a, b). EF improved in five of the responders and increased by more than 15% in the two super-responders. In the remaining responders, despite the significant reduction of ESV, EF did not change at all (closed diamond in Fig. 2), suggesting that EF is not a reliable biomarker for the evaluation of CRT effect.
Fig. 2.
Clinical effect of CRT on ESV and the EF. a Comparison of ESV between pre- and post-CRT b Comparison of the EF between pre- and post-CRT. In both graphs, the same symbols are used for each patient. Mean and SEM are indicated beside the symbols
CRT simulation
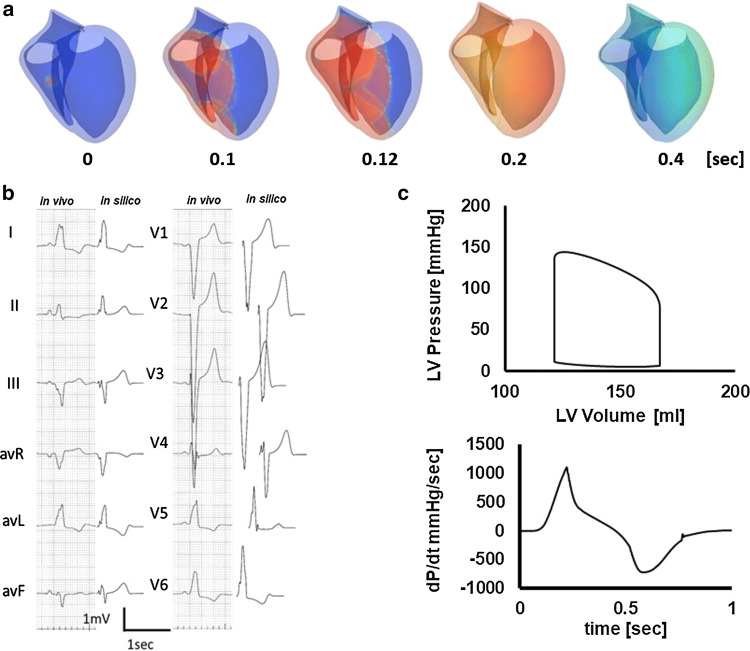
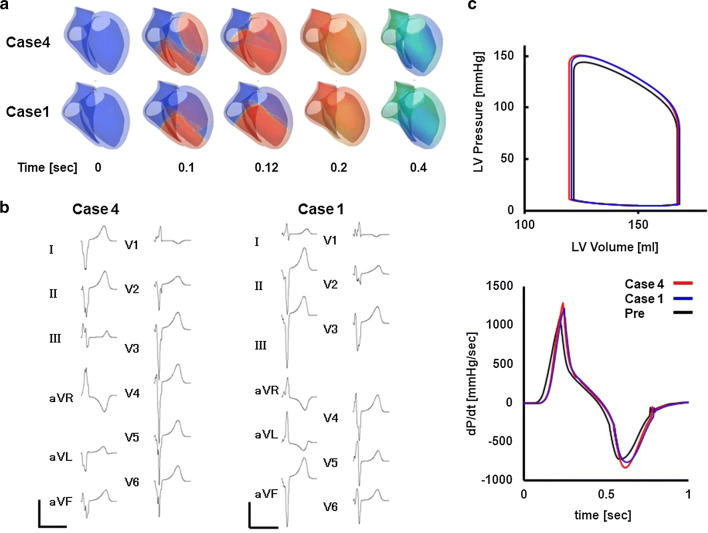
Figure 3 shows an example of a patient-specific model of a failing heart with conduction block (patient #5). Ventricular activation propagates slowly from the right side of the ventricular septum spreading to the left ventricle (Fig. 3a, animation in Online Resource 3). With this activation sequence, the surface ECG of this patient was successfully reproduced (Fig. 3b). Figure 3c shows the left ventricular pressure–volume relationship and dP/dt before CRT (animation in Online Resource 4). With this heart model, we performed CRT simulations of four patterns of lead positions and identified the best (case 4, animation in Online Resource 5) and the worst (case 1, animation in Online Resource 6) lead positions (patient #5 in Table 2). Compared with case 1, activation covers the whole ventricle faster and QRS complexes were narrower in case 4 (Fig. 4a, b). Left ventricular pressure, stroke volume, and maximum dP/dt (dP/dtmax) were all greater with case 4 (Fig. 4c).
Fig. 3.
Patient-specific model of the failing heart. a Time-lapse images showing propagation of activation (color) and contraction. The numbers indicate the time after the onset of activation. b Actual (left column) and simulated (right column) ECG c Pressure–volume loop of the left ventricle (upper panel) and dP/dt (lower panel)
Table 2.
Simulated CRT effect
| Pt # | Lead position | EF [%] | LVESV [ml] | LVEDV [ml] | dP/dtmax [mmHg/s] | Total activation time [msec] |
|---|---|---|---|---|---|---|
| 1 | Pre | 20.4 | 256 | 322 | 1001 | 182 |
| 1 | 22.8 | 250 | 324 | 1127 | 136 | |
| 2 | 22.9 | 250 | 325 | 1145 | 97 | |
| 3 | 23 | 248 | 322 | 1143 | 118 | |
| 4 | 23.3 | 248 | 323 | 1169 | 157 | |
| 2 | Pre | 24 | 138 | 182 | 852 | 182 |
| 1 | 24.9 | 137 | 183 | 951 | 134 | |
| 2 | 24.9 | 137 | 183 | 953 | 116 | |
| 3 | 25.1 | 137 | 183 | 958 | 136 | |
| 4 | 25 | 137 | 183 | 952 | 135 | |
| 3 | Pre | 26 | 150 | 202 | 1181 | 227 |
| 1 | 26 | 151 | 203 | 1237 | 174 | |
| 2 | 27 | 145 | 199 | 1345 | 184 | |
| 3 | 27 | 146 | 199 | 1335 | 185 | |
| 4 | 30 | 135 | 193 | 1508 | 156 | |
| 4 | Pre | 30 | 153 | 219 | 1348 | 164 |
| 1 | 31.8 | 139 | 204 | 1506 | 115 | |
| 2 | 31.7 | 143 | 209 | 1494 | 147 | |
| 3 | 32.5 | 137 | 203 | 1568 | 127 | |
| 4 | 32.7 | 139 | 207 | 1571 | 135 | |
| 5 | Pre | 27.1 | 123 | 168 | 1126 | 175 |
| 1 | 28.3 | 121 | 169 | 1249 | 136 | |
| 2 | 28.3 | 121 | 169 | 1301 | 115 | |
| 3 | 28.4 | 121 | 169 | 1268 | 155 | |
| 4 | 28.6 | 120 | 169 | 1321 | 115 | |
| 6 | Pre | 35.8 | 158 | 245 | 1008 | 127 |
| 1 | 36.3 | 157 | 246 | 977 | 126 | |
| 2 | 33.8 | 167 | 253 | 923 | 114 | |
| 3 | 36.2 | 157 | 246 | 980 | 95 | |
| 4 | 34.1 | 166 | 252 | 924 | 126 | |
| 7 | Pre | 28.9 | 129 | 182 | 700 | 135 |
| 1 | 29.9 | 126 | 180 | 768 | 115 | |
| 2 | 29.6 | 127 | 181 | 768 | 95 | |
| 3 | 30 | 126 | 180 | 772 | 115 | |
| 4 | 29.7 | 127 | 180 | 776 | 99 | |
| 8 | Pre | 25 | 139 | 185 | 550 | 203 |
| 1 | 26.1 | 137 | 185 | 621 | 173 | |
| 2 | 26.3 | 137 | 186 | 662 | 155 | |
| 3 | 26.2 | 136 | 185 | 626 | 177 | |
| 4 | 26.8 | 136 | 186 | 676 | 153 |
Fig. 4.
CRT simulations. a Propagation of activation and contraction under CRT that produced the best outcome (case 4) and the worst outcome (case 1). b Simulated ECGs of case 4 (left) and case 1 (right). c Comparisons of pressure–volume loops (upper panel) and dP/dt (lower panel) among pre-CRT, case 4 and case 1
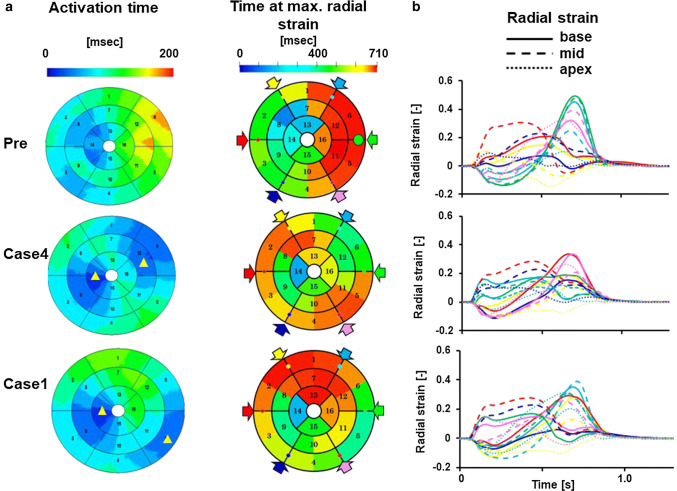
Figure 5a compares the segmental variations in electrical activation time, time at the maximal strain, and the temporal changes in radial strain in the basal segments before and after CRT. Before CRT (Pre), a significant delay in activation was observed in the anterolateral segments, which disappeared by the bi-ventricular pacing. The maximum values of activation time indicate the time required for the electrical activation to cover the whole ventricle (total activation time), which decreased from 175 ms (pre) to 136 ms (Case 1) and 115 ms (Case 4). Reflecting the delay in activation, time at the maximum radial strain was also delayed in the corresponding segment. Temporal changes in strain sampled at 16 segments are shown in Fig. 5b, where data were sampled at the base, mid-ventricular, and apical levels in 6 circumferential locations indicated by color arrows in the bull’s eye view. Before CRT, the basal septal segments (black, red, and blue solid lines) exhibited transient thickening in the pre-ejection period (septal flash) but became thin (negative strain) in the late systole. Bi-ventricular pacing corrected this abnormality, and, in case 4, no segments except for the apex showed negative strain in late systole. Clinically, this patient was judged as a responder (% ESV = − 37).
Fig. 5.
Evaluation of dyssynchrony. a Electrical activation time and time at maximum radial strain are shown by color in the bull’s eye view of the left ventricle and compared among pre-CRT, case 4 and case 1. Yellow triangles indicate the approximate position of pacing sites. b Temporal changes in radial strain, which was measured in 16 segments, compared among pre-CRT, case 4, and case 1. Data were sampled at the base (solid lines), mid-ventricular (broken lines), and apical (dotted lines) levels in six circumferential locations, which are indicated by color arrows in the bull’s eye view. However, red and green were omitted at the apical level
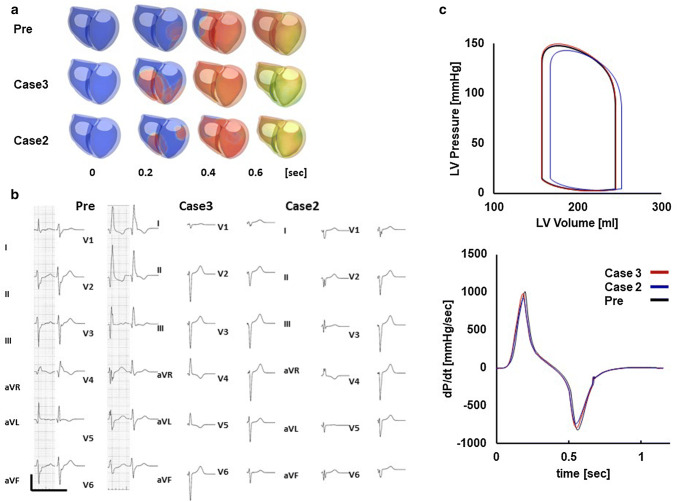
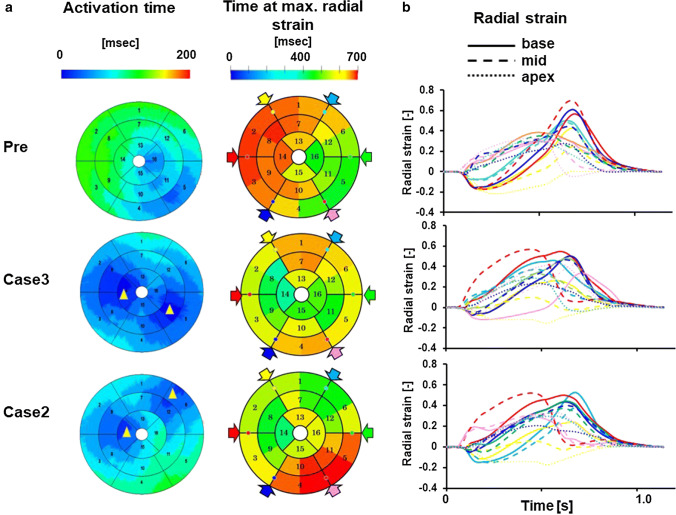
Patient #6 was judged as being a non-responder (% ESV = 0.8). Because this patient had right bundle branch block (RBBB) with left axis deviation (LAD) suggestive of left anterior fascicular block, activation propagated from the posterolateral wall and the basal septum was the last region to be activated in the left ventricle (Fig. 6a Pre, animation in Online Resource 7). With this activation sequence, ECG characteristics of typical RBBB and LAD that were observed in this patient were successfully reproduced (Fig. 6b Pre). Similarly to the previous case (patient #5), we performed CRT simulations of four patterns of lead positions and identified the best (case 3, animation in Online Resource 8) and the worst (case 2, animation in Online Resource 9) lead positions. In both lead positions, RBBB features of ECG disappeared (Fig. 6b, case 3 and 2), but contractile function did not appreciably change (Fig. 6c). As shown in Fig. 7a, the activation time was relatively short even before treatment (127 ms) and CRT (case 3) further shortened it to 95 ms. However, the wall motion abnormality persisted (Fig. 7b), which suggested that electrical delay was not an appropriate therapeutic target for this patient. The data for all patients are shown in Table 2 and the Supplementary figures in Online Resource 2.
Fig. 6.
Patient-specific model and effect of CRT of a non-responder (patient #6). a Time-lapse images showing propagation of activation (color) and contraction before treatment (Pre), with the lead position that produced the best outcome (case 3) and the worst outcome (case 2). The numbers indicate the time after onset of activation. b Actual (left column) and simulated (right column) ECG under the three conditions. c Pressure–volume loop of the left ventricle (upper panel) and dP/dt (lower panel) under the three conditions (Pre: black line, case 3: red line, case 2: blue line)
Fig. 7.
Evaluation of dyssynchrony for a non-responder (patient #6). a The activation time and the time at maximum radial strain are shown by color in the bull’s eye view of the left ventricle and were compared among pre-CRT, case 3 and case 2. Yellow triangles indicate the approximate position of pacing sites. b Temporal changes in radial strain, which were measured in 16 segments, were compared among pre-CRT, case 3 and case 2. Data were sampled at the base (solid lines), mid-ventricular (broken lines), and apical (dotted lines) levels in six circumferential locations, which are indicated by color arrows in the bull’s eye view. However, red and green were omitted at the apical level
Prediction of non-responders
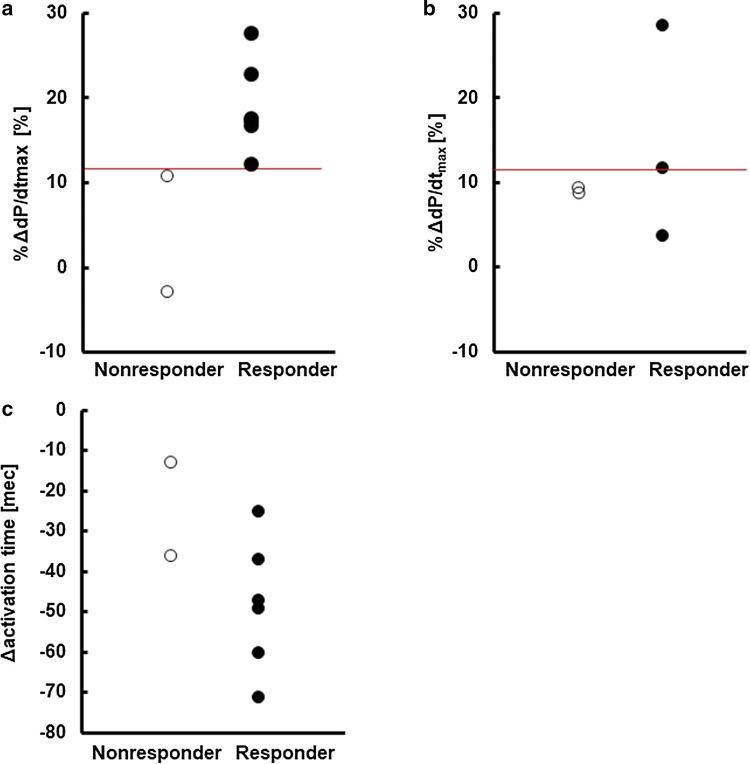
In our previous studies, a change in the maximum value of dP/dt (ΔdP/dtmax) was identified as the sensitive marker of CRT effect [19, 20]. However, considering the variability in baseline dP/dtmax among the patients, we adopted the relative change in dP/dtmax (%ΔdP/dtmax) in this study and hypothesized that the patients for whom CRT fails to elicit a significant gain in %ΔdP/dtmax even at the best lead position would be the non-responders. Figure 8a compares %ΔdP/dtmax at the best lead position between the responders (closed circle) and the non-responders (open circle). Although the difference was small, simulated %ΔdP/dtmax value could identify the responders. To further test the predictability of %ΔdP/dtmax, we selected five patients (see Supplementary Table 3 in Online Resource 1) from the study subjects in our previous study [19], of which follow-up echocardiograms at three months or later were available and plotted the data in a similar manner (Fig. 8b). In four out of five patients, we can correctly identify the responders and non-responders using the cutoff value obtained in Fig. 8a (red line: %ΔdP/dtmax = 11.6). On the other hand, consistent with previous studies, decreases in total activation time by the pacing (Δd activation time) did not predict the response to CRT (Fig. 8c) [19, 27].
Fig. 8.
Prediction of non-responders. a Relative changes in dP/dtmax (%ΔdP/dtmax) of responders (closed circle) versus non-responders (open circle). The red line indicates the cutoff value. b Relative changes in dP/dtmax (%ΔdP/dtmax) of responders (closed circles) versus non-responders (open circles) in our previous study [19]. The red line indicates the cutoff value determined in panel (a). c Relative changes in activation time (Δactivation time) of responders (closed circle) versus non-responders (open circle)
Discussion
CRT can be an effective therapy for end-stage heart failure [4], but identifying the significant number of non-responders remains a serious problem with this approach. While clinical studies continue to seek biomarkers that accurately identify the responders to CRT, simulation studies have also contributed to solving this problem. To date, most of these studies have attempted to understand the mechanisms of CRT [28–30], but we can also find reports reproducing the patient-specific pathology and responses to CRT [12, 31, 32]. Among these, Okada et al. applied CRT simulations to nine patient-specific heart models created based only on the data recorded before pacemaker implantation. They obtained a significant correlation between ΔdP/dtmax by simulation and improvement in EF observed clinically [19]. In that retrospective study, however, they simulated the bi-ventricular pacing with the actual lead position, which we cannot know before the treatment.
In the current study, aiming at the clinical application of CRT simulation for the identification of non-responders, we avoided the use of information after the implantation and tested four patterns of commonly used lead positions. Based on our hypothesis that “if even the best lead position does not produce a significant therapeutic effect, the patient will be a non-responder,” we compared the greatest %ΔdP/dtmax and the clinical outcome for each patient. Although the number of study subjects was small, we could identify non-responders.
Various biomarkers are currently used for the criteria of responders, such as functional class, six-minute walk, EF, and end-diastolic or -systolic left ventricular volume [33]. From these, we adopted the reduction in ESV at three months after the implantation, which is an index of reverse remodeling associated with a better prognosis of the patients [34]. However, the question remains for why the simulated acute improvement in dP/dtmax can predict the ventricular reverse remodeling in the chronic phase. An abnormal stretch of the ventricular wall triggers the pathological hypertrophy and dilatation of ventricle, and various interventions with unloading effects have been reported to induce reverse remodeling [35, 36]. In the dyssynchronous heart, the early activated segment pulls the delayed activated segment to cause abnormal stretch, which can be mitigated by CRT. From the viewpoint of ventricular mechanics, the stretched segment absorbs the work (negative work: N) done by the contracting segment (positive work: P), thereby impairing the pressure development. We calculated the effective work of the left ventricle during systole by subtracting the negative work from the positive work (P–N work). Work was calculated as the product of stress and strain in each element and summed for the entire left ventricle. We, then, plotted the P–N work against the dP/dtmax as an index of pressure development. Figure 9 summarizes all the data simulated for all lead positions for all patients. A significant correlation between dP/dtmax and P–N work suggests that dP/dtmax can be an indicator of abnormal stretch which promotes the pathological remodeling.
Fig. 9.
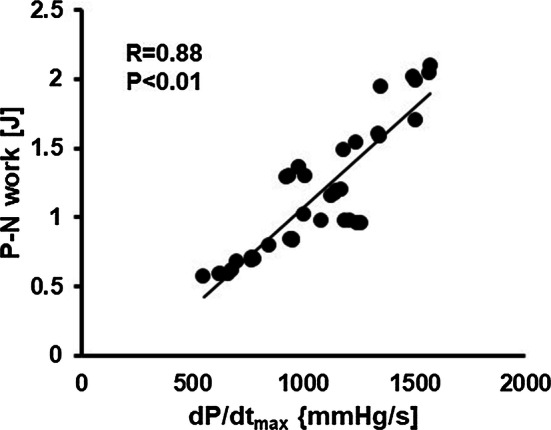
Dyssynchrony and ventricular pressure development. The relationship between the net positive work (P − N work) is plotted against dP/dtmax for all the lead positions in all of the study subjects. A linear regression line applied between them is also shown
Prolongation of the QRS duration is the class I recommendation for CRT in the guidelines [37]. Therefore, correction of electrical delay by placing the left ventricular lead in the late-activated area is a reasonable strategy for maximizing the effect of CRT. However, in patient #6, shortening of the QRS duration did not improve pumping function. Furthermore, when we examined the improvement of %dP/dtmax by placement of the left ventricular lead in the late-activated area in each subject, the largest improvement was achieved in only two of eight patients (Fig. 10). As discussed by Kass [38], multiple factors, including heterogeneity in wall geometry/size, contractile function, and cellular conduction, could decouple electrical delay and mechanical dyssynchrony. Therefore, placement of the lead in the most delayed area is not always the best strategy for achieving optimal CRT. A heart simulator coupling electrical and mechanical activities is a useful tool not only for predicting the effect of CRT but also for suggesting the optimal lead position for the CRT candidate.
Fig. 10.
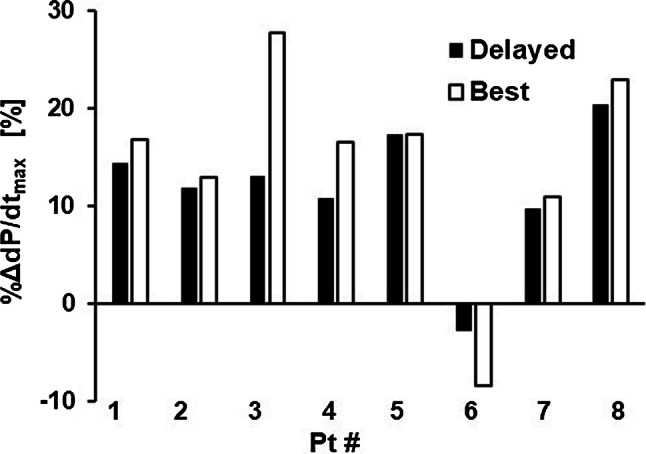
Effect of the lead position. Relative improvements in dP/dtmax (%dP/dtmax) were compared between the lead positions in the most delayed area (black bars) and those with the best result (white bars) for each patient
The significance of biomarkers can also be evaluated using simulation results. To date, while multi-center trials have failed to show the usefulness of echo-dyssynchrony parameters for predicting the response of CRT, observational studies have shown that the presence of septal flash is a robust predictor of responders [39, 40]. In fact, we clearly observed the presence of septal flash and its disappearance by CRT in one of the responders (patient #5). A similar observation was made only in three of six responders. Septal flash mainly reflects the activation delay in the septum, which is the target of CRT. However, in addition to the lack of a gold standard for the assessment of septal flash, several conditions, such as regional loading and/or contractile abnormality, could obscure the appearance of septal flash even with left bundle branch block [41]. Further studies are required to fully examine the mechanisms and usefulness of septal flash as a predictor of the response to CRT.
Overall, the current study produced a promising result, which provokes a need for future study including a larger number of subjects. Nevertheless, this study has several limitations. Firstly, to save the computational cost, we fixed the VV and AV delays, both of which are known to have significant impacts on the CRT effect and thus should be included. Secondly, while responders were judged based on the reduction of ESV three months after implantation (chronic effect), the CRT simulation was applied to the heart models and vascular parameters before the treatment (acute effect), based on the assumption that the acute unloading effect by CRT would lead to the favorable remodeling in the remote phase, thus ignoring the remodeling processes at the cellular and tissue levels. The remodeling process and mechanisms at the cellular and tissue levels [42] should be considered in future modeling, but individualized data at these levels are currently hard to obtain. Finally, utilization of data not included in the current simulation would potentially improve the predictive ability of simulation. For instance, viability of the myocardium in patients with myocardial infarction and cardiac sarcoidosis was evaluated by an ECG and echocardiogram because advanced imaging data, such as gadolinium-enhanced magnetic resonance imaging were not available for the study subjects. However, if the feasibility of prediction without such expensive modalities is confirmed in a future study, this would be beneficial for patients. Furthermore, when we applied the newly determined cutoff value to the data from previous publication, one responder was judged as a non-responder (Fig. 8b). The diagnosis of this patient was cardiac sarcoidosis. Steroid therapy, when started simultaneously with CRT, might have altered the clinical course in this patient. Recently, machine learning using the patients’ baseline characteristics of the patients has been applied to the prediction of response to CRT, but the results are not necessarily very remarkable to date [43, 44]. A composite evaluation of machine learning scores and simulation results would potentiate the power of these two approaches.
Conclusions
We performed CRT simulations with individualized heart models created using data obtained only before implantations for eight patients with heart failure. Simulated changes in dP/dtmax could successfully identify the non-responders to CRT.
Electronic supplementary material
Below is the link to the electronic supplementary material.
Acknowledgement
We thank Ellen Knapp, PhD, from Edanz Group (www.edanzediting.com/ac) for editing a draft of this manuscript.
Funding
This work was supported in part by MEXT as “Priority Issue on Post-K-computer” (Integrated Computational Life Science to Support Personalized and Preventive Medicine, Project ID: hp160209 and hp150260).
Compliance with ethical standards
Conflict of interest
Drs Okada, Washio, Hisada, and Sugiura have received grant support from Fujitsu Ltd. The remaining authors have no disclosures.
Footnotes
Publisher's Note
Springer Nature remains neutral with regard to jurisdictional claims in published maps and institutional affiliations.
References
- 1.Cazeau S, Leclercq C, Lavergne T, Walker S, Varma C, Linde C, Garrigue S, Kappenberger L, Haywood GA, Santini M, Bailleul C, Mabo P, Lazarus A, Ritter P, Levy T, McKenna W, Daubert J-C. Effects of multisite biventricular pacing in patients with heart failure and intraventricular conduction delay. N Engl J Med. 2001;344:873–880. doi: 10.1056/NEJM200103223441202. [DOI] [PubMed] [Google Scholar]
- 2.Abraham WT, Fisher WG, Smith AL, Delurgio DB, Leon AR, Loh E, Kocovic DZ, Packer M, Clavell AL, Hayes DL, Ellestad M, Trupp RJ, Underwood J, Pickering F, Truex C, McAtee P, Messenger J. Cardiac resynchronization in chronic heart failure. N Engl J Med. 2002;346:1845–1853. doi: 10.1056/NEJMoa013168. [DOI] [PubMed] [Google Scholar]
- 3.Cleland JGF, Daubert J-C, Erdmann E, Freemantle N, Gras D, Kappenberger L, Tavazzi L. The effect of cardiac resynchronization on morbidity and mortality in heart failure. N Engl J Med. 2005;352:1539–1549. doi: 10.1056/NEJMoa050496. [DOI] [PubMed] [Google Scholar]
- 4.Daubert C, Behar N, Martins RP, Mabo P, Leclercq C. Avoiding non-responders to cardiac resynchronization therapy: a practical guide. Eur Heart J. 2017;38:1463–1472. doi: 10.1093/eurheartj/ehw270. [DOI] [PubMed] [Google Scholar]
- 5.Prinzen FW, Vernooy K, Auricchio A. Cardiac resynchronization therapy state-of-the-art of current applications, guidelines, ongoing trials, and areas of controversy. Circulation. 2013;128:2407–2418. doi: 10.1161/CIRCULATIONAHA.112.000112. [DOI] [PubMed] [Google Scholar]
- 6.Chung ES, Leon AR, Tavazzi L, Sun J-P, Nihoyannopoulos P, Merlino J, Abraham WT, Ghio S, Leclercq C, Bax JJ, Yu C-M, Gorcsan J, III, St John Sutton M, De Sutter J, Murillo J. Results of the predictors of response to CRT (PROSPECT) trial. Circulation. 2008;117:2608–2616. doi: 10.1161/CIRCULATIONAHA.107.743120. [DOI] [PubMed] [Google Scholar]
- 7.Yu CM, Sanderson JE, Gorcsan J., III Echocardiography, dyssynchrony, and the response to cardiac resynchronization therapy. Eur Heart J. 2010;31:2326–2339. doi: 10.1093/eurheartj/ehq263. [DOI] [PMC free article] [PubMed] [Google Scholar]
- 8.Vernooy K, van Deursen CJM, Strik M, Prinzen FW. Strategies to improve cardiac resynchronization therapy. Nat Rev Cardiol. 2014;11:481–493. doi: 10.1038/nrcardio.2014.67. [DOI] [PubMed] [Google Scholar]
- 9.Epstein AE, DiMarco JP, Ellenbogen KA, Estes NAI, Freedman RA, Gettes LS, Gillinov AM, Gregoratos G, Hammill SC, Hayes DL, Hlatky MA, Newby LK, Page RL, Schoenfeld MH, Silka MJ, Stevenson LW, Sweeney MO, Smith SCJ, Jacobs AK, Adams CD, Anderson JL, Buller CE, Creager MA, Ettinger SM, Faxon DP, Halperin JL, Hiratzka LF, Hunt SA, Krumholz HM, Kushner FG, Lytle BW, Nishimura RA, Ornato JP, Page RL, Riegel B, Tarkington LG, Yancy CW. ACC/AHA/HRS 2008 Guidelines for device-based therapy of cardiac rhythm abnormalities: a report of the American college of cardiology/American heart association task force on practice Guidelines (Writing Committee to revise the ACC/AHA/NASPE 2002 Guideline update for implantation of cardiac pacemakers and antiarrhythmia devices) developed in collaboration with the American Association for Thoracic Surgery and Society of Thoracic Surgeons. J Am Coll Cardiol. 2008;51:e1–62. doi: 10.1016/j.jacc.2008.02.032. [DOI] [PubMed] [Google Scholar]
- 10.Brignole M, Auricchio A, Baron-Esquivias G, Bordachar P, Boriani G, Breithardt O, Cleland J, Deharo J, Delgado V, Elliott PM, Gorenek B, Israel CW, Leclercq C, Linde C, Mont L, Padeletti L, Sutton R, Vardas PE. 2013 ESC Guidelines on cardiac pacing and cardiac resynchronization therapy The Task Force on cardiac pacing and resynchronization therapy of the European Society of Cardiology (ESC). Developed in collaboration with the European Heart Rhythm Association (EHRA) Europace. 2013;15:1070–1118. doi: 10.1093/europace/eut206. [DOI] [PubMed] [Google Scholar]
- 11.Lee AW, Costa CM, Strocchi M, Rinaldi CA, Niederer SA. Computational modeling for cardiac resynchronization therapy. J Cardiovasc Trans Res. 2018;11:92–108. doi: 10.1007/s12265-017-9779-4. [DOI] [PMC free article] [PubMed] [Google Scholar]
- 12.Sermesant M, Chabiniok R, Chinchapatnam P, Mansi T, Billet F, Moireau P, Peyrat JM, Wong K, Relan J, Rhode K, Ginks M, Lambiase P, Delingette H, Sorine M, Rinaldi CA, Chapelle D, Razavi R, Ayache N. Patient-specific electromechanical models of the heart for the prediction of pacing acute effects in CRT: a preliminary clinical validation. Med Image Anal. 2012;16:201–215. doi: 10.1016/j.media.2011.07.003. [DOI] [PubMed] [Google Scholar]
- 13.Chabiniok R, Wang VY, Hadjicharalambous M, Asner L, Lee J, Sermesant M, Kuhl E, Young AA, Moireau P, Nash MP, Chapelle D, Nordsletten DA. Multiphysics and multiscale modelling, data–model fusion and integration of organ physiology in the clinic: ventricular cardiac mechanics. Interface Focus. 2016;6:20150083. doi: 10.1098/rsfs.2015.0083. [DOI] [PMC free article] [PubMed] [Google Scholar]
- 14.Sugiura S, Washio T, Hatano A, Okada J-I, Watanabe H, Hisada T. Multi-scale simulations of cardiac electrophysiology and mechanics using the University of Tokyo heart simulator. Prog Biophys Mol Biol. 2012;110:380–389. doi: 10.1016/j.pbiomolbio.2012.07.001. [DOI] [PubMed] [Google Scholar]
- 15.Washio T, Okada J, Hisada T. A parallel multilevel technique for solving the bidomain equation on a human heart with Purkinje fibers and a torso model. SIAM Rev. 2010;52:717–743. [Google Scholar]
- 16.Washio T, Okada J, Takahashi A, Yoneda K, Kadooka Y, Sugiura S, Hisada T. Multiscale heart simulation with cooperative stochastic cross-bridge dynamics and cellular structures. SIAM J Multiscale Model Simul. 2013;11:965–999. [Google Scholar]
- 17.Okada J-I, Washio T, Maehara A, Momomura S, Sugiura S, Hisada T. Transmural and apicobasal gradients in repolarization contribute to T-wave genesis in human surface ECG. Am J Physiol Heart Circ Physiol. 2011;301:H200–H208. doi: 10.1152/ajpheart.01241.2010. [DOI] [PubMed] [Google Scholar]
- 18.Okada J, Sasaki T, Washio T, Yamashita H, Kariya T, Imai Y, Nakagawa M, Kadooka Y, Nagai R, Hisada T, Sugiura S. Patient specific simulation of body surface ECG using the finite element method. Pacing Clin Electrophysiol. 2013;36:309–321. doi: 10.1111/pace.12057. [DOI] [PubMed] [Google Scholar]
- 19.Okada J-I, Washio T, Nakagawa M, Watanabe M, Kadooka Y, Kariya T, Yamashita H, Yamada Y, Momomura S-I, Nagai R, Hisada T, Sugiura S. Multi-scale, tailor-made heart simulation can predict the effect of cardiac resynchronization therapy. J Mol Cell Cardiol. 2017;108:17–23. doi: 10.1016/j.yjmcc.2017.05.006. [DOI] [PubMed] [Google Scholar]
- 20.Panthee N, Okada J-I, Washio T, Mochizuki Y, Suzuki R, Koyama H, Ono M, Hisada T, Sugiura S. Tailor-made heart simulation predicts the effect of cardiac resynchronization therapy in a canine model of heart failure. Med Image Anal. 2016;31:46–62. doi: 10.1016/j.media.2016.02.003. [DOI] [PubMed] [Google Scholar]
- 21.Washio T, Okada J, Sugiura S, Hisada T. Approximation for cooperative interactions of a spatially-detailed cardiac sarcomere model. Cell Mol Bioeng. 2011;5:113–126. doi: 10.1007/s12195-011-0219-2. [DOI] [PMC free article] [PubMed] [Google Scholar]
- 22.ten Tusscher KHWJ, Noble D, Noble PJ, Panfilov AV. A model for human ventricular tissue. Am J Physiol Heart Circ Physiol. 2004;286:H1573–H1589. doi: 10.1152/ajpheart.00794.2003. [DOI] [PubMed] [Google Scholar]
- 23.DTMRI data sets [Internet]. 2004 [cited Dec. 1, 2014]. Available from: https://gforge.icm.jhu.edu/gf/project/dtmri_data_sets
- 24.Kerckhoffs RCP, Neal ML, Gu Q, Bassingthwaighte JB, Omens JH, McCulloch AD. Coupling of a 3D finite element model of cardiac ventricular mechanics to lumped systems models of the systemic and pulmonic circulation. Ann Biomed Eng. 2007;35:1–18. doi: 10.1007/s10439-006-9212-7. [DOI] [PMC free article] [PubMed] [Google Scholar]
- 25.Yoshimura M, Yasue H, Okumura K, Ogawa H, Jougasaki M, Mukoyama M, Nakao K, Imura H. Different secretion patterns of atrial natriuretic peptide and brain natriuretic peptide in patients with congestive heart failure. Circulation. 1993;87:464–469. doi: 10.1161/01.cir.87.2.464. [DOI] [PubMed] [Google Scholar]
- 26.Lewi PJ, Schaper WKA, Jageneau AHM. Analysis of the Isovolumic Pressure in the Canine Left Ventricle. Pflugers Arch. 1971;329:9–22. doi: 10.1007/BF00586897. [DOI] [PubMed] [Google Scholar]
- 27.Molhoek SG, Bax JJ, Boersma E, van Erven L, Bootsma M, Steendijk P, van der Wall EE, Schalij MJ. QRS duration and shortening to predict clinical response to cardiac resynchronization therapy in patients with end-stage heart failure. Pacing Clin Electrophysiol. 2004;27:308–313. doi: 10.1111/j.1540-8159.2004.00433.x. [DOI] [PubMed] [Google Scholar]
- 28.Kerckhoffs RCP, Lumens J, Vernooy K, Omens JH, Mulligan LJ, Delhaas T, Arts T, McCulloch AD, Prinzen FW. Cardiac resynchronization: Insight from experimental and computational models. Prog Biophys Mol Biol. 2008;97:543–561. doi: 10.1016/j.pbiomolbio.2008.02.024. [DOI] [PMC free article] [PubMed] [Google Scholar]
- 29.Constantino J, Hu Y, Trayanova NA. A computational approach to understanding the cardiac electromechanical activation sequence in the normal and failing heart, with translation to the clinical practice of CRT. Prog Biophys Mol Biol. 2012;110:372–379. doi: 10.1016/j.pbiomolbio.2012.07.009. [DOI] [PMC free article] [PubMed] [Google Scholar]
- 30.Huntjens PR, Walmsley J, Ploux S, Bordachar P, Prinzen FW, Delhaas T, Lumens J. Influence of left ventricular lead position relative to scar location on response to cardiac resynchronization therapy: a model study. Europace. 2014;16:iv62–iv68. doi: 10.1093/europace/euu231. [DOI] [PubMed] [Google Scholar]
- 31.Aguado-Sierra J, Krishnamurthy A, Villongco C, Chuang J, Howard E, Gonzales MJ, Omens J, Krummen DE, Narayan S, Kerckhoffs RCP, McCulloch AD. Patient-specific modeling of dyssynchronous heart failure: a case study. Prog Biophys Mol Biol. 2011;107:147–155. doi: 10.1016/j.pbiomolbio.2011.06.014. [DOI] [PMC free article] [PubMed] [Google Scholar]
- 32.Tobon-Gomez C, Duchateau N, Sebastian R, Marchesseau S, Camara O, Donal E, De Craene M, Pashaei A, Relan J, Steghofer M, Lamata P, Delingette H, Duckett S, Garreau M, Hernandez A, Rhode KS, Sermesant M, Ayache N, Leclercq C, Razavi R, Smith NP, Frangi AF. Understanding the mechanisms amenable to CRT response: from pre-operative multimodal image data to patient-specific computational models. Med Biol Eng Comput. 2013;51:1235–1250. doi: 10.1007/s11517-013-1044-7. [DOI] [PubMed] [Google Scholar]
- 33.Ellenbogen KA, Huizar JF. Foreseeing super-response to cardiac resynchronization therapy: a perspective for clinicians. J Am Coll Cardiol. 2012;59:2374–2377. doi: 10.1016/j.jacc.2011.11.074. [DOI] [PubMed] [Google Scholar]
- 34.Zareba W, Klein H, Cygankiewicz I, Hall WJ, McNitt S, Brown M, Cannom D, Daubert JP, Eldar M, Gold MR, Goldberger JJ, Goldenberg I, Lichstein E, Pitschner H, Rashtian M, Solomon S, Viskin S, Wang P, Moss AJ. Effectiveness of cardiac resynchronization therapy by QRS morphology in the multicenter automatic defibrillator implantation trial-cardiac resynchronization therapy (MADIT-CRT) Circulation. 2011;123:1061–1072. doi: 10.1161/CIRCULATIONAHA.110.960898. [DOI] [PubMed] [Google Scholar]
- 35.Hellawell JL, Margulies KB. Myocardial reverse remodeling. Cardiovasc Ther. 2012;30:172–181. doi: 10.1111/j.1755-5922.2010.00247.x. [DOI] [PubMed] [Google Scholar]
- 36.Kirn B, Jansen A, Bracke F, van Gelder B, Arts T, Prinzen FW. Mechanical discoordination rather than dyssynchrony predicts reverse remodeling upon cardiac resynchronization. Am J Physiol Heart Circ Physiol. 2008;295:H640–H646. doi: 10.1152/ajpheart.00106.2008. [DOI] [PubMed] [Google Scholar]
- 37.Normand C, Linde C, Singh J, Dickstein K. Indications for cardiac resynchronization therapy A comparison of the major international guidelines. JACC Heart Failure. 2018;6:308–316. doi: 10.1016/j.jchf.2018.01.022. [DOI] [PubMed] [Google Scholar]
- 38.Kass DA. Cardiac resynchronization therapy. J Cardiovasc Electrophysiol. 2005;16:S35–S41. doi: 10.1111/j.1540-8167.2005.50136.x. [DOI] [PubMed] [Google Scholar]
- 39.Stankovic I, Prinz C, Ciarka A, Daraban AM, Kotrc M, Aarones M, Szulik M, Winter S, Belmans A, Neskovic AN, Kukulski T, Aakhus S, Willems R, Fehske W, Penicka M, Faber L. Relationship of visually assessed apical rocking and septal flash to response and long-term survival following cardiac resynchronization therapy (PREDICT-CRT) Eur Heart J Cardiovasc Imaging. 2016;17:262–269. doi: 10.1093/ehjci/jev288. [DOI] [PubMed] [Google Scholar]
- 40.Doltra A, Bijnens B, Tolosana JM, Borràs R, Khatib M, Penela D, De Caralt TM, Castel MA, Berruezo A, Brugada J, Mont L, Sitges M. Mechanical abnormalities detected with conventional echocardiography are associated with response and midterm survival in CRT. JACC Cardiovasc Imaging. 2014;7:969–979. doi: 10.1016/j.jcmg.2014.03.022. [DOI] [PubMed] [Google Scholar]
- 41.Calle S, Delens C, Kamoen V, De Pooter J, Timmermans F. Septal flash: At the heart of cardiac dyssynchrony. Trends Cardiovasc Med. 2019 doi: 10.1016/j.tcm.2019.03.008. [DOI] [PubMed] [Google Scholar]
- 42.Kirk JA, Kass DA. Electromechanical dyssynchrony and resynchronization of the failing heart. Circ Res. 2013;113:765–776. doi: 10.1161/CIRCRESAHA.113.300270. [DOI] [PMC free article] [PubMed] [Google Scholar]
- 43.Cikes M, Sanchez-Martinez S, Claggett B, Duchateau N, Piella G, Butakoff C, Pouleur AC, Knappe D, Biering-Sørensen T, Kutyifa V, Moss A, Stein K, Solomon SD, Bijnens B. Machine learning-based phenogrouping in heart failure to identify responders to cardiac resynchronization therapy. Eur J Heart Fail. 2019;21:74–85. doi: 10.1002/ejhf.1333. [DOI] [PubMed] [Google Scholar]
- 44.Feeny AK, Rickard J, Patel D, Toro S, Trulock KM, Park CJ, LaBarbera MA, Varma N, Niebauer MJ, Sinha S, Gorodeski EZ, Grimm RA, Ji X, Barnard J, Madabhushi A, Spragg DD, Chung MK. Machine learning prediction of response to cardiac resynchronization therapy. Improvement versus current guidelines. Circ Arrhythm Electrophysiol. 2019;12:e007316. doi: 10.1161/CIRCEP.119.007316. [DOI] [PMC free article] [PubMed] [Google Scholar]
Associated Data
This section collects any data citations, data availability statements, or supplementary materials included in this article.


