

Abstract
At the end of February 2020, Peru started the first cases of pneumonia associated with coronavirus (COVID-19), they were reported in Lima, Peru (Rodriguez-Morales et al., 2020). Therefore, the first week on March started with 72 infected people, the government published new law for a national crisis by COVID-19 pandemic (Vizcarra et al., 2020), with a quarantine in each city of Peru. Our analysis has considered March and April 2020, for air quality measurement and infections in Lima, the data collected on 6 meteorological stations with CO (carbon monoxide), NO2 (nitrogen oxide), O3 (ozone), SO2 (sulfur dioxide), PM10 and PM2.5 (particle matter with diameter aerodynamic less than 2.5 and 10 m respectively). As a result, the average of these concentrations and the hospital information is recollected per hour. This analysis is executed during the quarantine an important correlation is discovered in the zone with highest infection by COVID-19, NO2 and PM10, even though in a reduction of air pollution in Lima. In this paper, we proposed a classification model by Reduced-Space Gaussian Process Regression for air pollution and infections; with technological and environmental dynamics and global change associated COVID-19. An evaluation of zones in Lima city, results have demonstrated influence of industrial influence in air pollution and infections by COVID-19 before and after quarantine during the last 28 days since the first infection in Peru; the problems relating to data management were validated with a successful classification and cluster analysis for future works in COVID-19 influence by environmental conditions.
Keywords: Air pollution, Correlation analysis, COVID-19, Lima
Highlights
-
•
Approach with Reduced-Space Gaussian Process Regression for air quality and infections
-
•
High values of NO2 increased number of infections with and without quarantine.
-
•
Quarantine actions decreased PM2.5 and PM10 influence, but NO2 has more life cycle.
-
•
COVID-19 infections and NO2 have high correlation in quarantine characteristics.
-
•
NO2 and Infections have a correlation of 99.27% in industrial zones.
1. Introduction
China and Italy shut down transportation in every single way on January to March 2020 and established numerous, just in China 28 quarantines was implemented (Wilder-Smith and Freedman, 2020). In these countries, air pollution and mortality were underestimated using the aforementioned models, they considered 60 days with a decrease in NO2 air pollution in China, in the last month predictions should indicate a 6% reduction in mortality due to air pollution (Dutheil et al., 2020). Fine particles with PM2.5 and NO2 is produced by burning fossil fuels as heavy industry, vehicles and boilers. Quarantine was implemented in several countries, as Peru (Vizcarra et al., 2020). Countries as Italy has cities with worst air quality as Lombardy and Emilia Romagna; then, these cities have more infections rate,so, they have increased rapidly their infections associated to COVID-19. Besides, countries have high variability with infections due to quarantine and sanitary decisions taken by the different Governments as Colombia, Chile, Peru and Brazil, as Fig. 1 .
Fig. 1.

Infections in quarantine in Peru, Chile, Colombia and Brazil March to April 9 2020.
In the last report to World Heath Organization (WHO), about 8 millions of deaths worldwide result from air pollution 2019 (WHO, 2019), it is associated about 18% of deaths worldwide, it described 4.9 million deaths are due to ambient air particle matter, NO2 and SOx (Landrigan et al., 2018). On the other hand, it describes a clear evidence of the “air pollution negative health effects such as chronic obstructive pulmonary disease (COPD), cardiovascular disease, and lung cancer that are widely reported in the literature” (Arias Velásquez et al., 2019b). In Lima city, premature deaths has dramatic results of 2300 deaths from PM and about 3000 due to the use of stoves burning biomass indoors, in industrial environment (Arias Velásquez, 2019). In Lima, traffic has been analyzed in a temporal and spatial perspective with the eight different air quality monitoring station in this city. “These stations have detected correlation between PM2.5 with some meteorological parameters such as temperature, relative humidity, wind direction, and wind speed was carried out at a seasonal level that can be used for future works associated to pollution analysis and temporal spatial analysis” (Romero et al., 2020).
The complete development was carried out in Lima, with six reference air quality stations; in this case, data collected by SENAMHI (see Fig. 2 ). The stations were Carabayllo, Campo de Marte, San Juan de Lurigancho, Santa Anita, San Borja, Villa del Triunfo. Besides, Lima owns an area of 2.672 km2 and a population over 12 million (as of 2019).
Fig. 2.

Meteorological stations for case study with PM10 daily average 2-months average (March to April 2020).
As April 92,020, this SARS-COV-2 has caused 5256 infections with 138 deaths in Peru, in a especial way in Lima 3704 people infected (over 71%). Although the COVID-19 deaths may be affected by many factors. This study allows to explore the effect of meteorological parameters on COVID-19 deaths using Reduced-Space Gaussian Process Regression for Data-Driven Probabilistic on air pollution and infections.
The rest of this paper is organized as follows: Section 2, describe background and Reduced-Space Gaussian Process Regression for Data-Driven Probabilistic for COVID-19 and air pollution correlation. Section 3 develops the results the correlation and classification function, reports the main findings. Section 4, concludes.
2. Background and methodology
Contamination and cities with air pollution are one of the critical aspects for “prolonged inflammation, eventually leading to an innate immune system hyper-activation. In a small cohort of mice exposed for three months to particulate matter” 2.5 mm and 10 mm in diameter called PM2.5 y PM10 (Conticini et al., 2020) in COVID-19 and SARS (Yang et al., 2019). Cities with high concentrations of “PM2.5 and PM10 lead to systemic inflammation with an over expression of PDGF, VEGF, TNFa, IL-1 and IL-6 even in healthy”, non-smoker and young subjects have a weak immune system and have a greater chance of contracting respiratory diseases. With this last research is important to identify zones with high pollution levels because, those zones are more vulnerable for COVID-19.
2.1. Systematic review
In this field, we used a population, intervention, comparison/control, outcome and time methodology, called (PICOT). This PICOT review has the following algorithm in ScienceDirect and SCOPUS. ((air pollution) OR (Contamination)) AND ((COVID19)OR(COVID-19)) NOT (Radiology)NOT(radiation), with 26 research articles available at April 9th 2020, the main contribution is described, as follows:
-
•
Emission reductions for quarantines during the COVID-19 in China has been investigated, by “transportation decreases PM2.5concentrations. The decreases of PM2.5 in Beijing, Shanghai, Guangzhou, and Wuhan were 9.23, 6.37, 5.35, and 30.79g/m3,respectively” (Wang et al., 2020).
-
•
On pregnancy stage, “respiratory rate remains unchanged in healthy pregnancy, and the finding of tachypnea is a significant finding and should prompt practitioners to further evaluate the patient, however new events in main cities have increased COVID-19 infections” (Juusela et al., 2020).
-
•
. Special consideration should be given on pregnant stage and immunocompromised associated respiratory infections (Chavez et al., 2020).
-
•
Air samples are investigated now, the first step is to collect samples from hospital and around patients, who have “close contact to the patients must adhere to national or international evidence based precautions” (Faridi et al., 2020).
2.2. Gaussian process regression methodology for air pollution and infections by COVID-19
This research develops a Gaussian Process Regression called GPR (Rasmussen and Williams, 2005), with dynamical systems. In this case, GPR is used with probabilistic regression framework, with a training data set with Eq. (1), of N pairs of vectors with a input xn ∈ R and “noisy scalar output yn” (Rasmussen and Williams, 2005). For air pollution, yon should create a model generalized to the distribution of the output at unseen input location. At the same time, noise in output models represents observation error; so, Gaussian distribution, generates input-output relationship in Eq. (2).
| (1) |
| (2) |
Where:
σ noise 2: “Variance of the noise” (Zhong et al., 2016).
f(x): Latent variable or function values, non-observed.
“Gaussian process is a set of random values, they must be indexed by some” x ∈ X as a subset. With Bayes theorem, it is possible to “make inferences on function values to unseen inputs conveniently using a finite number of training data” (Berry et al., 2015). For this process, we considered mean function m(x) and a covariance function k(x,x’) (Arias Velásquez et al., 2019a), as Eq. (3) and Eq. (4).
| (3) |
| (4) |
Where:
E[.]: “Expectation” (Arias Velásquez and Mejía Lara, 2020).
m(x): It is zero with data centering.
GPR framework requires functions and dependent on the input x It is strictly symmetric and positive semi-definite if they are consolidated at each pair of points, this results are define by prior distribution on f(x), in Eq. (4).
| (5) |
Where:
θ 1: Is a hyper-parameter with maximum covariance.
θ 2: Is a strictly positive hyper-parameter, with decrease rate in correlations. In Eq. (5), it calculated the squared exponential covariance function, with x 1 as lth component of x and x’. The function decreases fast if distant pairs of input x and x’. A property is the weak correlation associated to f(x) and f(x’). Besides, σ noise 2 represents uncertainty associated to the order-reduction as a probable observations error.
About forecasting and classifier, the hyper-parameter {θ 1,θ 2,θ 3} should be integrated as f, as a vector of training latent variables, in Eq. (6), with matrix on Eq. (7). In this case, f* is a second subscript, used covariance function k(.,.) and corresponding hyper-parameters. With a variable change y, as a conditional probability for the training observation, it describes on (8).
| (6) |
| (7) |
| (8) |
In Eq. (9), Bayes rule is written with a normalized process to find (f, f ∗) in Eq. (10).
| (9) |
| (10) |
In Eq. (11), associates to “conditioning the joint Gaussian prior distribution on the observations, resulting in the closed-form Gaussian distribution” (Zhong et al., 2016). With Eq. (12), f∗, the mean and covariance should be directly added to obtain Eq. (13).
| (11) |
| (12) |
| (13) |
| (14) |
Finally, in Eq. (14) makes feasible to use up to more than twelve thousands of training data set to make classifiers and forecasting.
For cross validation a neural network (NN) is composed of nodes set and synapses, it needs a signal or input of a data set, in this research a “performs computation by propagating the signal along the connections”, until, it influences the reply in the inner layer. It is compared to “biological neuron's spiking action, a nonlinear activation function is applied to nodes in any hidden layer and the output layer” (Zhang et al., 2019). Method has been considered with the fit using Keras, for CNN a nonlinear function is considered in the Eq. (15).
| (15) |
Where:
θ: Model parameter.
The Eq. (15) has the results of “weights on the connections” among nodes of the neural network. This model starts with the input layer, later, four hidden layers and “ends at the output layer (Bow, 2002). Covariance are calculating linear combination of the input nodes in the Eq. (16).
| (16) |
In the Eq. (16), individually node in the hidden layer has “linear combination” (Zhang et al., 2019) with a chain events. The hidden layers are composed as following:
-
•
Convolutional layers: For abstract local features at different locations.
-
•
Pooling layers: It uses the average value from each subarea of previous layer.
-
•
Fully-connected layers: It has a function similar to regular neural network. This type is powerful for “seizing local geometric features, spatial patterns and detects larger-scale features in deeper layers” (LeCun et al., 1998).
“Linear transformation of the covariates x” (Selvikvag and Lundervold, 2019) or inputs are described in the Eq. (17) and Eq. (18).
| (17) |
| (18) |
In Eq. (18) describes a matrix of weights, it is analogous to regression coefficient in the Eq. (19).
| (19) |
| (20) |
In the Eq. (20), the hidden layer is described. Besides, a sigmoid non-linearity is indicated in the Eq. (21), it is a hyperbolic tangent function.
| (21) |
Where:
h: it is a description of the hidden layer, due to restriction of the “linearly transformed and passed to the output layer”.
| (22) |
In Eq. (22), it is the output of the process, the hidden layer is linearly transformer through the output layer.
With Eq. (22) the multinomial logistic regression (MLR) function is applied in the Eq. (23), it provides the input vector probability, the results belong “to class k” [21], with the limits indicated in the Eq. (24), for cross-validation (Arias Velásquez and Mejía Lara, 2018).
| (23) |
| (24) |
Where: y: It is the maximum output vector; it has described the classifier as to the class of x. k: Class.
Finally, the Neural network allows to identify the correct classifier for COVID-19 infections and air pollution parameter for the forecast, after the Gaussian process.
This framework in the Fig. 3 allows to obtain knowledge from the geographic information systems for COVID-19 and air pollution. The feedback from ANN allows to detect a correct forecast in future sets and to verify the accuracy day by day.
Fig. 3.
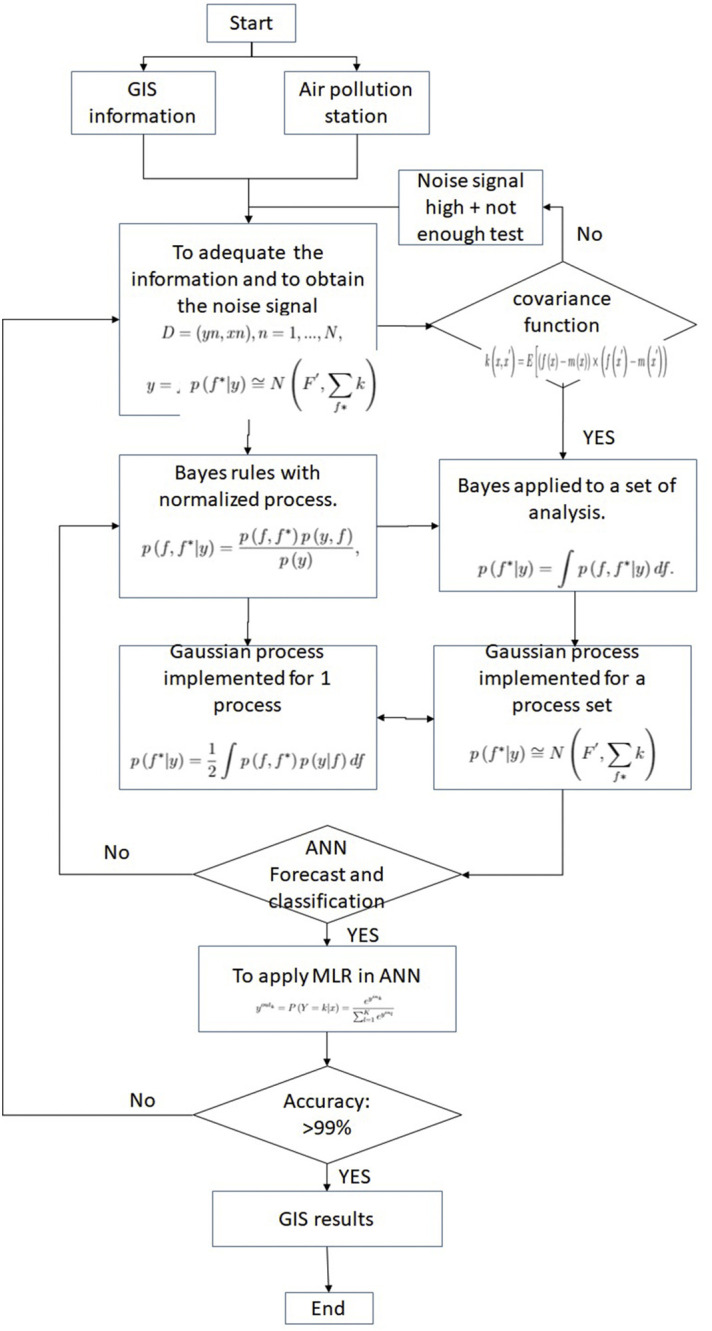
Flux diagram for the methodology.
The main restrictions is in the analytic platforms, in some countries. If the government does not consider regions in the infection. It is a big challenge in some countries with information restriction of the government.
3. Case study in Lima
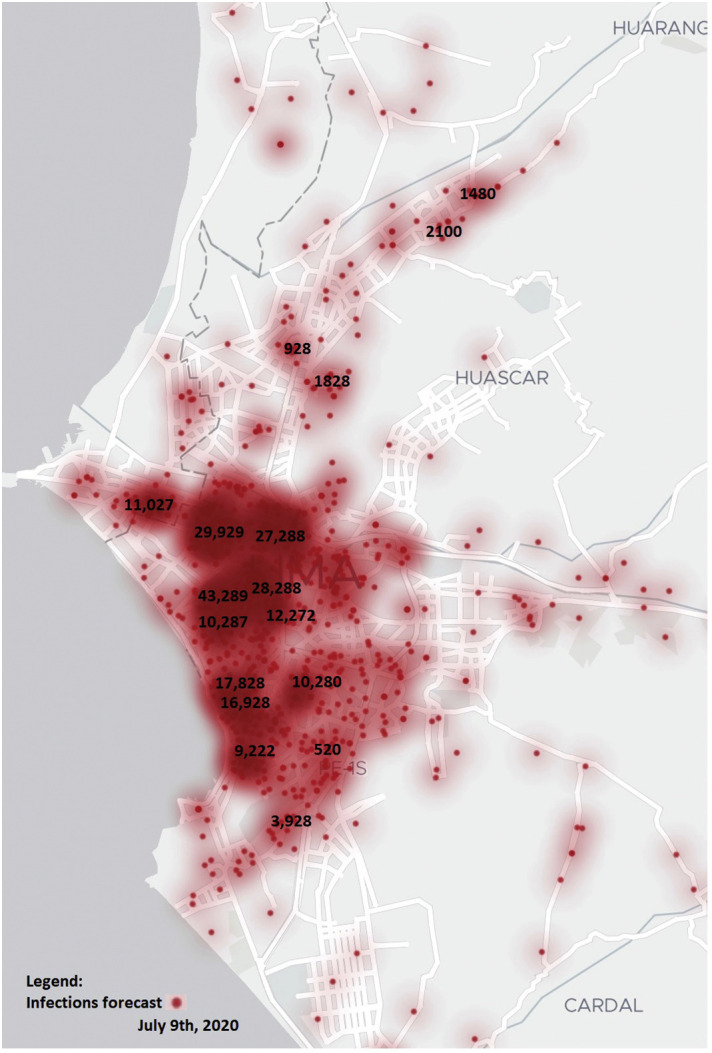
In the Fig. 4 , the infections are 3704 at April 9th 2020, Lima has been selected for this case study. There are 7 zones aggregated for each meteorological station in Fig. 2, with 32 hospital located in Lima. The infection information from Lima hospitals was updated hourly, from March 13th to April 9th, 2020. According the analysis, distribution of COVID-19 is as follows: Jesus Maria: 475, Cercado de Lima: 385, Miraflores: 109, San Borja: 100, La Victoria: 78, San Martín de Porres: 72, Surco: 71, Comas: 56, Barranco: 55, San Isidro: 52, Villa El Salvador: 52, Ate: 51, San Miguel: 40, San Juan de Lurigancho: 42, Magdalena: 36, Santa Anita: 32, La Molina: 26, San Juan de Miraflores: 21, Pueblo Libre: 19, Villa María del Triunfo: 17, Rimac: 17, Independencia: 14.
Fig. 4.

Distribution of 3704 infected in Lima according districts.
As we can see in Fig. 4, Jesus Maria district is the most affected with COVID-19 (Zone 4), it is an industrial zone with high pollution.
In the GPR analysis, the classifier has detected four clusters, in the early days of March 2020, before quarantine, the infections caused by week respiratory system (Predictive infections) and infections detected in Lima city (green colour). This predictive infection has a common factor: Hypertension, heart disease, breathing trouble or diabetes. Besides, cluster 2 demonstrated the quarantine effects, an important change in the infection curve, it is from March 16th to 30th, and cluster 3 is from March 31th to April 9th, as Fig. 5 . Finally, the industrial zone represent the highest air pollution zone during quarantine, this is worst near to meteorological stations with highest values of NO2, PM10 and PM2.5.
Fig. 5.

Clusters: Infections and predictive infections by using Gaussian Process Regression.
Furthermore, in the Fig. 6 demonstrated meteorological stations zones and their differences: Zone 4 called Campo de Marte has a different behaviour against quarantine actions. The infection has not been reduced. This is composed according the expectation (E[.]) and m(x) with NO2 values. GPR in each zone is strictly symmetric and positive, a clear vector should be defined by prior distribution on f(x). On the other hand, zone 2 called San Borja and zone 3 called Santa Anita, both are zones with high population density in a small area. However, the effect of quarantine in Lima city has mitigated NO2 values. Although Lima is near to Pacific Ocean, the quarantine has decreased the impact of NO2 36% average. But in industrial zones, NO2 did not decrease and infections are getting worst each day in this zone. In this Fig. 6, pollution was likely worsening COVID-19's impact in Campo de Marte zone with R: 99.27%.
Fig. 6.

Cluster with location, NO2 and infections in Lima.
With PM10 analysis, Fig. 10 has demonstrated the sensibility with quarantine and without quarantine. We can determinate the influence has more evidence with NO2 than PM10 as Fig. 7 . The Villa Maria del Triunfo and Carabayllo have decreased the particle matter content in the air.
Fig. 10.

a) Correlation according number of infections. b) Correlation associated to NO2.
Fig. 7.

Cluster with location, PM10 and infections in Lima.
The results of GPR has an average Target Value of 0.12574176251712 with an inverted Covariance Matrix with lowest value of −0.24995917464735457 and highest value of 0.9847752517227292. At the same time, the inverted covariance matrix * Target-value Vector has lowest value of −0.2442042204452098 and highest value of 0.46963612142678257.
About the results of the model, they have a correlation coefficient of 99.8185%; root mean squared error of 99.780739% and relative absolute error 99.586858%. With the model associated to infections are described in Fig. 8 , centered in zone 4.
Fig. 8.
Infections obtained with classifier GPR.
An interesting correlation is generated between NO2, PM10 and infections on Fig. 9 , high values of NO2 has more infections level in Lima city, in industrial zones, although PM10 has decreased, the life cycle of PM10 is shortest than NO2.
Fig. 9.

Correlation between PM10, NO2 and infections.
In the Fig. 10 a correlation between NO2 and infections and PM10 has been described with R: 98.827% and 95.38%. The correlation between each day and PM10 has decreased from March to April 2020,
4. Conclusions
In Lima city, the air pollution is an important factor. Besides, infections by COVID-19 in zones with the same population density has a high correlation with NO2 with and without quarantine restrictions. Quarantine has decreased the values of PM2.5 and PM10 for their short life cycle, therefore, the particle matter is not appropiated for this analysis. Lima is the biggest city with air pollution problems in Latin America. Our findings are a high correlation with NO2 and infections of COVID-19, it should be investigated in more countries, however, it is an important task in zones with industrial facilities, furthermore, we suggest in the Fig. 10 a correlation between NO2 and infections and PM10 has been described with R: 98.827% and 95.38%; it has demonstrated the sensibility with quarantine and without quarantine. We can determinate the influence has more evidence with NO2 than PM10 as Fig. 7.
With Gaussian approach, is possible to create a forecast of infections if we considers the historical data of NO2 and COVID-19 infections, then, we can created a forecast with high accuracy and correlation. This research is based on classifier model by Reduced-Space Gaussian Process Regression for air pollution and infections. The key finding in this study is the effect of air pollution on mortality has dramatically increased associated to NO2 with quarantine actions of the goverment or increased fuel-burning emissions due to cold weather. New politics should evaluate improvements in this zones, and more research should corroborate this first step. Empirically, we show people with immediate access to emergency healthcare are less susceptible to air pollution in comparison to those without and, definitely, with lower values than zone 4. With this novel methodology develops for evaluation of infections by COVID-19 and air quality: CO, NO2, O3, SO2, PM10 and PM2.5. As a result, the mean NO2, our findings suggest that better industrial zones with higher than NO2 26 g/m3 can increase infections by COVID-19. Finally, the GPR is a comprehensive air quality methodology for infections analysis to respiratory risk. Our findings highlight the significance of continued air quality enforcement to broadly protect the public, meanwhile continuing the investigation of a COVID-19 and air quality relationship; further studies are needed to investigate these issues.
Grants/financial support
None.
Declaration of Competing Interest
The authors declare that they have no known competing financial interests or personal relationships that could have appeared to influence the work reported in this paper.
Acknowledgments
Authors would like to thank to Universidad Nacional de San Agustín de Arequipa, for the knowledge contribution in this research.
References
- Arias Velásquez R. Insulation failure caused by special pollution around industrial environments. Eng. Fail. Anal. August 2019;102:123–135. [Google Scholar]
- Arias Velásquez R.M., Mejía Lara J.V. Life estimation of shunt power reactors considering a failure core heating by floating potentials. Eng. Fail. Anal. 2018;86:142–157. [Google Scholar]
- Arias Velásquez R.M., Mejía Lara J.V. Forecast and evaluation of COVID-19 spreading in USA with reduced-space Gaussian process regression. Chaos, Solitons Fractals. 2020;136 doi: 10.1016/j.chaos.2020.109924. [DOI] [PMC free article] [PubMed] [Google Scholar]
- Arias Velásquez R.M., Mejía Lara J.M., Melgar A. Converting data into knowledge for preventing failures in power transformers. Eng. Fail. Anal. 2019;101:215–229. [Google Scholar]
- Arias Velásquez R., Romero Ramos Y., Noel J. IEEE Sciences and Humanities International Research Conference (SHIRCON); 2019. Citizen science approach for spatiotemporal modelling of air pollution quality and traffic in Lima, Peru; pp. 1–4. [Google Scholar]
- Berry T., Giannakis D., Harlim J. Nonparametric forecasting of low-dimensional dynamical systems. Phys. Rev. E. 2015;91(3) doi: 10.1103/PhysRevE.91.032915. mar. [DOI] [PubMed] [Google Scholar]
- Bow S. CRC Press; 2002. Pattern Recognition and Image Preprocessing; pp. 1–5. [Google Scholar]
- Chavez S., Long B., Koyfman A., Liang S. 2020. Coronavirus Disease (COVID-19): A primer for emergency physicians, The American Journal of Emergency Medicine; pp. 1–10. In press, corrected proof, Available online 24 March. [DOI] [PMC free article] [PubMed] [Google Scholar]
- Conticini E., Frediani B., Caro D. Environmental Pollution. 2020. Can atmospheric pollution be considered a co-factor in extremely high level of SARS-CoV-2 lethality in Northern Italy? In press, corrected proof, Available online 4 April, 2020, 114465. [DOI] [PMC free article] [PubMed] [Google Scholar]
- Dutheil F., Baker J., Navel V. COVID-19 as a factor influencing air pollution? Environ. Pollut. 2020;263 doi: 10.1016/j.envpol.2020.114466. Part A, 114466. [DOI] [PMC free article] [PubMed] [Google Scholar]
- Faridi S., Niazi S., Sadeghi K., Naddafi K., Yavarian Jila, Shamsipour Mansour, Jandaghi Nazanin Zahra Shafiei, Sadeghniiat Khosro, Nabizadeh Ramin, Yunesian Masud, Momeniha Fatemeh, Mokamel Adel, Hassanvand Mohammad Sadegh, MokhtariAzad Talat. A field indoor air measurement of SARS-CoV-2 in the patient rooms of the largest hospital in Iran. Sci. Total Environ. 2020;725:1–5. doi: 10.1016/j.scitotenv.2020.138401. 138401. [DOI] [PMC free article] [PubMed] [Google Scholar]
- Juusela A., Nazir M., Gimovsky M. Two cases of COVID-19 related cardiomyopathy in pregnancy. Am. J. Obstetrics Gynecol. MFM. 2020;2(2):1–3. doi: 10.1016/j.ajogmf.2020.100113. Supplement, 100113. [DOI] [PMC free article] [PubMed] [Google Scholar]
- Landrigan P.J., Fuller R., Acosta N.J.R., Adeyi O., Arnold R., Baldé A.B., Bertollini R., Bose-O'Reilly S., Boufford J.I., Breysse P.N. The lancet commission on pollution and health. Lancet. 2018;391:462–512. doi: 10.1016/S0140-6736(17)32345-0. [DOI] [PubMed] [Google Scholar]
- LeCun Y., Bottou L., Bengio Y., Haffner P. Gradient-based learning applied to document recognition. Proc. IEEE. 1998;86:2278–2324. [Google Scholar]
- Rasmussen C., Williams C. The MIT, Press; Cambridge, MA: 2005. Gaussian Processes in Machine Learning. [Google Scholar]
- Rodriguez-Morales A., Sah R., Paniz-Mondolfi A. Travel Medicine and Infectious Disease. 2020. Should the Holy Week 2020 be cancelled in Latin America due to the COVID-19 pandemic? p. 101633. In press, corrected proof, Available online 20 March 2020. [DOI] [PMC free article] [PubMed] [Google Scholar]
- Romero Y., Diaz C., Meldrum I., Arias Velasquez R., Noel J. Temporal and spatial analysis of traffic — related pollutant under the influence of the seasonality and meteorological variables over an urban city in Peru. Heliyon. 2020;6(6) doi: 10.1016/j.heliyon.2020.e04029. [DOI] [PMC free article] [PubMed] [Google Scholar]
- Selvikvag A., Lundervold Arvid. An overview of deep learning in medical imaging focusing on MRI. Zeitschrift für Medizinische Physik. 2019;29(2):102–127. doi: 10.1016/j.zemedi.2018.11.002. [DOI] [PubMed] [Google Scholar]
- Vizcarra M., Zeballos V., Vásquez E., Alva M., Martos W., Milagros A., Moran A., Castañeda F., Hinostroza M., Meza-Cuadra G., Cáceres S., Lozada C. Vol. 15. 2020. Decreto de urgencia N 026-2020, Decreto de urgencia que establece diversas medidas excepcionales y temporales para prevenir la propagacion del coronavirus (COVID-19) en el territorio nacional, Ministerio del Peru, Marzo. [Google Scholar]
- Wang P., Chen K., Zhu S., Wang P., Zhang H. Severe air pollution events not avoided by reduced anthropogenic activities during COVID-19 outbreak. Resour. Conserv. Recycl. July 2020;158 doi: 10.1016/j.resconrec.2020.104814. [DOI] [PMC free article] [PubMed] [Google Scholar]
- WHO (World Health Organization), n.d. How air pollution is destroying our health [WWW Document] 2019. https://www.who.int/air-pollution/news-and-events/how-air-pollution-is-destroying-our-health (accessed 10.17.19)
- Wilder-Smith A., Freedman D.O. 2020. Isolation, quarantine, social distancing and community containment: pivotal role for old-style public health measures in the novel coronavirus (2019-nCoV) outbreak. Journal of Travel Medicine taaa020. [DOI] [PMC free article] [PubMed] [Google Scholar]
- Yang J., Chen Y., Yu Z., Ding H., Ma Z. The influence of PM2.5 on lung injury and cytokines in mice. Exp. Ther. Med. 2019;18(4):2503–2511. doi: 10.3892/etm.2019.7839. [DOI] [PMC free article] [PubMed] [Google Scholar]
- Zhang W., Jin L., Song E., Xu E. Removal of impulse noise in color images based on convolutional neural network. Appl. Soft Comput. J. 2019:111. 82201910558. [Google Scholar]
- Zhong Y., Wan, Sapsis Themistoklis P. MIT Industrial Liaison Program; 2016. Reduced-Space Gaussian Process Regression for Data-Driven Probabilistic Forecast of Chaotic Dynamical Systems; pp. 1–31. [Google Scholar]