Abstract
Cancer cells undergo changes in metabolic and survival pathways that increase their malignancy. Isoform 2 of the glycolytic enzyme hexokinase (HK2) enhances both glucose metabolism and resistance to death stimuli in many neoplastic cell types. Here, we observe that HK2 locates at mitochondria‐endoplasmic reticulum (ER) contact sites called MAMs (mitochondria‐associated membranes). HK2 displacement from MAMs with a selective peptide triggers mitochondrial Ca2+ overload caused by Ca2+ release from ER via inositol‐3‐phosphate receptors (IP3Rs) and by Ca2+ entry through plasma membrane. This results in Ca2+‐dependent calpain activation, mitochondrial depolarization and cell death. The HK2‐targeting peptide causes massive death of chronic lymphocytic leukemia B cells freshly isolated from patients, and an actionable form of the peptide reduces growth of breast and colon cancer cells allografted in mice without noxious effects on healthy tissues. These results identify a signaling pathway primed by HK2 displacement from MAMs that can be activated as anti‐neoplastic strategy.
Keywords: anti‐neoplastic strategy, cancer, cell penetrating peptide, Hexokinase 2, mitochondria‐associated membranes
Subject Categories: Cancer, Autophagy & Cell Death, Membrane & Intracellular Transport
HK2 localizes at mitochondria‐associated membranes of tumor cells. Its displacement with a cell‐penetrating peptide prompts IP3R opening, mitochondria Ca2+ overload, calpain activation and tumor cell death.

Introduction
Hexokinases are a family of four isoforms that catalyze phosphorylation of glucose, making it available for utilization in glycolysis, pentose phosphate pathway, glycogenesis, and hexosamine biosynthesis 1. HK2, the most active isozyme, is markedly expressed in cells characterized by a high rate of glucose consumption, such as adipose, skeletal, and cardiac muscle. During the neoplastic process, metabolic changes are required to allow cell growth in conditions of fluctuating nutrient and oxygen availability 2. HK2 plays a major role in this metabolic rewiring 3, 4, 5, being induced by oncogenic K‐Ras activation 6 or in response to (pseudo)hypoxia 7, 8. HK2 is mainly bound to the outer mitochondrial membrane, where it can gain privileged access to newly synthesized ATP, thus increasing efficiency in glucose usage 9, while following glucose deprivation HK2 elicits autophagy by inhibiting mTORC1 10. HK2 binding to mitochondria is increased by Akt phosphorylation, a key metabolic event occurring downstream to many signaling pathways hyperactivated in tumor cells 11, and by interactions with DMPK and Src kinases 12, whereas it is inhibited by the Akt‐antagonizing phosphatase PHLPP and by hexokinase enzymatic product glucose‐6‐phosphate 10. Moreover, mitochondrial HK2 takes part in the protection of cancer cells from noxious stimuli through poorly defined mechanisms that include antagonizing the activity of pro‐apoptotic Bcl‐2 family proteins and increasing anti‐oxidant defenses through interaction with the fructose‐2,6‐bisphosphatase TIGAR, which elicits pentose phosphate pathway induction 13. In cancer patients, HK2 induction is related to stage progression, acquisition of invasive and metastatic capabilities, and poor prognosis 14. HK2 promotes neoplastic growth in glioblastoma multiforme 15, confers chemoresistance in epithelial ovarian cancer 16, and is required for tumor onset and maintenance in mouse models of lung and breast cancer, where its genetic ablation is therapeutic without adverse effects 6.
Thus, HK2 constitutes a promising target for developing anti‐neoplastic strategies, but the clinical use of hexokinase inhibitors is hampered by lack of specificity or side effects 17 potentially associated with glucose metabolism derangement. A possible alternative approach is detaching HK2 from mitochondria, as we and others have previously shown that this can induce opening of a mitochondrial channel, the permeability transition pore (PTP), and consequently cell death 12, 13, 18, 19. However, both a detailed comprehension of the molecular mechanisms leading to cell damage and the development of a HK2‐targeting tool that is operational in in vivo tumor models are required to translate this information into the groundwork for future anti‐neoplastic approaches.
Here, we demonstrate that in neoplastic cells, HK2 localizes in MAMs, specific subdomains of interaction between mitochondria and ER. HK2 detachment from MAMs rapidly elicits a massive Ca2+ flux into mitochondria and consequently a calpain‐dependent cell death. We ignite this process with a HK2‐targeting peptide composed by modular units that can be adapted to in vivo delivery, without affecting hexokinase enzymatic activity and with no adverse effects on animal models.
Results and Discussion
HK2 localizes in MAMs of neoplastic cells
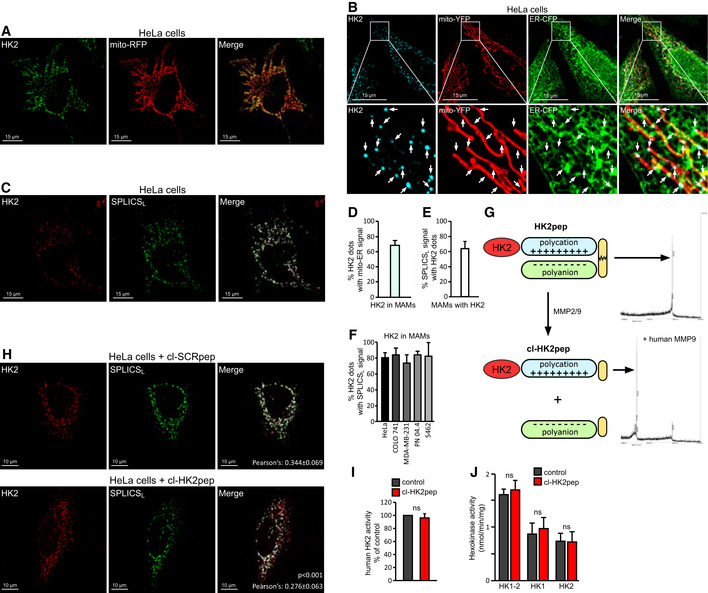
Dissection of submitochondrial HK2 localization can provide important functional clues, as mitochondria compartmentalize specific activities in domains formed by multiprotein platforms. After confirming that HK2 associates with tumor cell mitochondria (Fig 1A), we have found that it specifically localizes in MAMs by merging the fluorescence of HK2‐conjugated antibodies with mitochondria‐targeted YFP and ER‐targeted CFP (Fig 1B) or with a split‐GFP‐based probe for ER‐mitochondria contacts (SPLICSL) 20 (Fig 1C). These experiments have been extended to diverse HK2‐expressing tumor cell models (Fig EV1A and B), and their quantification indicate both that 70–80% of HK2 localizes in MAMs and that most cellular MAMs harbor HK2 proteins (Fig 1D–F). Interestingly, the use of a short‐range, split‐GFP‐based approach (SPLICSS) 20 designed to identify proteins localized in the tighter MAM fraction does not detect HK2 (Fig EV1C). The SPLICSL analysis also showed that HK2 is significantly enriched in MAMs with respect to TOM20, a protein that is uniformly distributed in the outer mitochondrial membrane (Fig EV1D). MAMs are dynamic structures that control the exchange between ER and mitochondria of ions and lipids, tuning complex biological processes such as ER stress, autophagy, cell death and maintenance of glucose homeostasis 21, 22, 23. A pivotal role of MAMs is the regulation of Ca2+ fluxes from ER to mitochondria through IP3Rs 24; thus, HK2 displacement from MAMs could affect intracellular Ca2+ dynamics, raising the possibility that a Ca2+ dyshomeostasis can ensue and damage neoplastic cells.
Figure 1. HK2 locates in MAM of cancer cells and is displaced by HK2pep.
-
AImmunofluorescence staining of HK2 with an AlexaFluor488‐conjugated antibody in HeLa cells expressing mitochondria‐targeted RFP. Yellow signals in the merge analysis indicate mitochondrial localization of HK2. Scale bar: 15 μm.
-
BImmunofluorescence staining of HK2 with a secondary AlexaFluor555‐conjugated antibody in HeLa cells expressing both mitochondria‐targeted YFP and ER‐targeted CFP. The merged white signal indicates MAM localization of HK2 and is quantified in the bar graph on the right (n = 24). Image magnifications are shown in the lower part of the panel; arrows indicate HK2 dots in mito‐ER contact sites. Scale bar: 15 μm.
-
CFluorescence co‐staining of HK2 and split‐GFP‐based probe for ER‐mitochondria contacts (SPLICSL) on HeLa cells; HK2 is revealed with a secondary AlexaFluor555‐conjugated antibody, and the merged signal is white. Scale bar: 15 μm.
-
DQuantification of panel B experiment showing the percentage of HK2 dots that merge with MAMs in HeLa cells (n = 24 cells analyzed from three independent experiments; mean ± SD).
-
EQuantification of panel C experiment showing the percentage of SPLICSL dots positive for HK2 in HeLa cells (n = 10 cells analyzed from three independent experiments; mean ± SD).
-
FPercentage of HK2 dots positive for SPLICSL in HeLa, COLO 741, MDA‐MB‐231, PN 04.4, and S462 cells (n ≥ 6 cells for each cell line; mean ± SD).
-
GFunctional unit composition of HK2pep (left); the HK2‐targeting sequence is in red; the polycation and polyanion stretches are in light blue and light green, respectively; the MMP2/9 target sequence is in yellow. On the right, mass spectrometry profile of HK2pep before and after incubation (cl‐HK2pep) with human MMP9.
-
HHK2 displacement from HeLa MAMs after a 2 min treatment with cl‐HK2pep is shown by loss of merging signal analyzed as in (C). cl‐SCRpep is used as a negative control, and Pearson's co‐localization coefficient is indicated in figure (cl‐SCRpep n = 26 cells; cl‐HK2pep n = 24 cells; P < 0.001 with a Student's t‐test). Scale bar: 10 μm.
-
I, JEffect of cl‐HK2pep on glucose phosphorylation by human recombinant HK2 (I) or in 4T1 cell extracts (J), where both total hexokinase activity and HK1/HK2 specific activities are measured.
Figure EV1. Related to Fig 1. HK2 locates in MAMs of cancer cells.
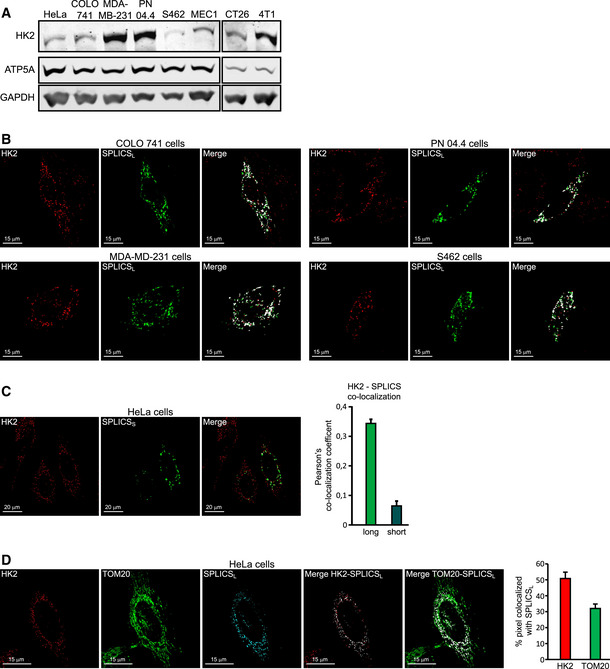
- Western immunoblot analysis of HK2 expression on neoplastic cells of human origin (cervix carcinoma HeLa cells, colorectal carcinoma COLO 741 cells, breast cancer MDA‐MB‐231 cells, plexiform neurofibroma PN 04.4 cells, malignant peripheral nerve sheath tumor S462 cells, B‐chronic lymphocytic leukemia MEC1 cells) and of mouse origin (colon carcinoma CT26 cells and breast cancer 4T1 cells). ATP5A and GAPDH are mitochondrial and cytosolic loading controls, respectively.
- Fluorescence co‐staining of HK2 and split‐GFP‐based probe for ER‐mitochondria contacts (SPLICSL) on colorectal carcinoma COLO 741 cells, breast cancer MDA‐MB‐231 cells, plexiform neurofibroma PN 04.4 cells, and malignant peripheral nerve sheath tumor S462 cells. HK2 is revealed with an AlexaFluor555‐conjugated secondary antibody. Scale bar, 15 μm.
- Fluorescence co‐staining of HK2 and split‐GFP‐based probe for ER‐mitochondria contacts SPLICSS. HK2 co‐localization with SPLICSL (related to Fig 1H) or SPLICSS is quantified in the bar graph on the right (mean ± SEM obtained from at least three independent experiments). Scale bar, 20 μm.
- Both HK2 and the outer mitochondrial membrane marker TOM20 are analyzed for their co‐localization with MAMs. HK2 is revealed with an AlexaFluor555‐conjugated secondary antibody and TOM20 with an AlexaFluor647‐conjugated secondary antibody; the merged signal is white in both analyses. MAM localization of HK2 or TOM20 is quantified in the bar graph on the right (mean ± SEM obtained from three independent experiments). Scale bar, 15 μm.
Design of a peptide that displaces HK2 from MAMs without affecting hexokinase enzymatic activity
To investigate this possibility and to generate a tool with a potential anti‐tumor activity in vivo, we have conceived a HK2‐targeting cell penetrating peptide (CPP), dubbed HK2pep (Fig 1G). HK2pep is designed with a modular structure composed of: (i) a N‐terminal HK2 tail, which acts as the active moiety by displacing HK2 from the outer mitochondrial membrane (in the negative control, SCRpep, this HK2‐specific sequence is substituted by a scrambled one); (ii) a polycation stretch required for plasma membrane permeation; (iii) a polyanion sequence that shields polycation charges; and iv) a matrix metalloprotease 2 and 9 (MMP2/9) target sequence that links the two charged stretches. As previously observed with similar actionable CPPs 25, the metalloprotease target sequence inhibits cell uptake of the peptide until its polycation sequence is unmasked by MMP2/9 cleavage. MMPs are highly expressed in a variety of tumor types, where they induce extracellular matrix remodeling and favor cancer cell invasiveness 26. Hence, HK2pep should be preferentially activated inside neoplasms, and its subsequent entry through the plasma membrane would then lead to HK2 displacement from mitochondria and eventually cancer cell death. Moreover, HK2pep is not permeable across the endothelium of normal blood vessels, but its dimension (about 5 kDa) allows passage across the fenestrated endothelium that perfuses many cancer types.
The active moiety of HK2pep (i.e., the cleaved peptide, cl‐HK2pep, Fig 1G) is indeed able to enter cells, to interact with mitochondria (Fig EV2A), and to induce HK2 detachment from MAMs in < 2 min (Figs 1H and EV2B). cl‐HK2pep does not perturb hexokinase enzymatic activity either on the purified enzyme (Fig 1I) or on cell samples, where it is equally ineffective on HK2 and on the widespread isozyme HK1 (Figs 1J and EV2C). Moreover, the use of a subtoxic peptide concentration indicates that it does not affect the glycolytic activity of the target cell (Fig EV2D).
Figure EV2. Related to Fig 1. Characterization of cl‐HK2pep.
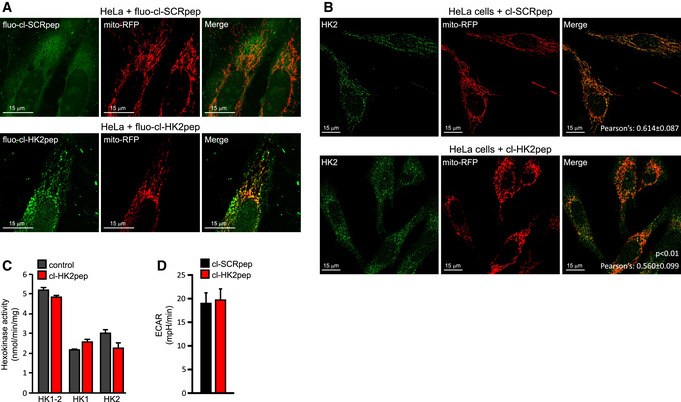
- HeLa cells expressing mitochondrial‐targeted RFP are treated for 2 min with either cl‐SCRpep or cl‐HK2pep (1 μM each) labeled with the green fluorophore ATTO 488. The yellow signal indicates mitochondrial localization of the peptide. Scale bar: 15 μm.
- HK2 displacement from HeLa mitochondria after a 2‐min treatment with cl‐HK2pep is shown by loss of merging signal analyzed as in Fig 1C. cl‐SCRpep is used as a negative control, and Pearson's co‐localization coefficient is indicated in figure (cl‐SCRpep n = 40 cells; cl‐HK2pep n = 51 cells; P < 0.01 with Student's t‐test). Scale bar: 15 μm.
- Effect of 10 μM cl‐HK2pep on glucose phosphorylation in CT26 cell extracts, where both total hexokinase activity and HK1/HK2‐specific activities are measured (mean ± SD, n = 3 independent experiments).
- Extracellular acidification rate measurements performed on HeLa cells treated with either cl‐SCRpep or cl‐HK2pep (200 nM; mean ± SEM, n = 3 independent experiments, Student's t‐test analysis n.s.).
HK2 detachment from MAMs elicits a Ca2+ flux into mitochondria via IP3Rs and plasma membrane that causes mitochondrial depolarization
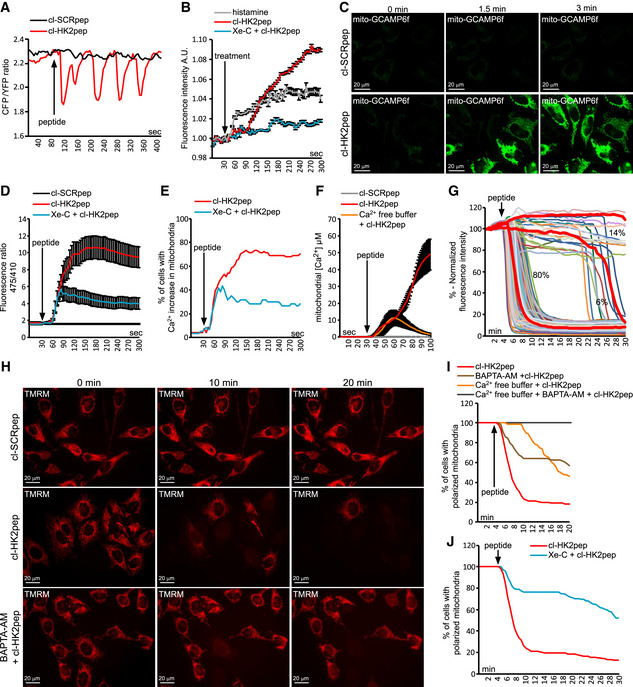
In accord with a role played by several MAM proteins in the regulation of Ca2+ homeostasis, cl‐HK2pep prompts cycles of ER Ca2+ release and refill (Fig 2A) and boosts cytosolic IP3 levels (Fig 2B). This IP3 rise is prevented by pre‐incubation with the IP3R inhibitor Xestospongin C (Xe‐C; Fig 2B) and by chelating cytosolic Ca2+ (Fig EV3A), and delayed with respect to the Ca2+ release from ER (compare Fig 2A and B). These observations are consistent with cl‐HK2pep eliciting a primary Ca2+ efflux from ER that prompts a surge in cytosolic IP3 27. Indeed, Ca2+ enhances PLC activity that generates IP3 28, further amplifying ER Ca2+ release via IP3Rs.
Figure 2. HK2 detachment from MAMs prompts Ca2+ influx and depolarization in mitochondria following IP3R opening.
-
A–FEffect of cl‐HK2pep on cellular Ca2+ dynamics and IP3 levels. ER Ca2+ levels are measured by the FRET‐based, D4ER fluorescent probe expressed in the lumen of ER (A); IP3 levels are assessed with the GFP‐PHD probe; histamine (100 μM) is used as a positive control for IP3 generation; data are reported as mean of fluorescent signals ± SEM (n = 3 independent experiments; B); changes in mitochondrial Ca2+ levels are recorded (C; scale bar: 20 μm) and quantified using the GCAMP6f sensor (in D, as mean of 475/410 nm ratio; signal ± SEM of at least five independent experiments and more than 20 cells analyzed), in (E) as percentage of cells with increased Ca2+ in mitochondria, with a threshold 475/410 ratio for positivity > 3; baseline mean ratio = 1.84 ± 0.54) or with mitochondria‐targeted aequorin (F, where data are reported as mean of [Ca2+] ± SEM of 3 independent experimental days).
-
G–JEffect of cl‐HK2pep treatment on mitochondrial membrane potential assessed with the TMRM probe. Kinetic experiments (G, single cell analysis, n = 216 cells analyzed in at least 10 independent experiments; H, representative field; scale bar: 20 μm) are quantified (I and J; TMRM fluorescence is normalized to initial value and expressed in percentage for each time point, with a depolarization threshold placed at 40% of initial value).
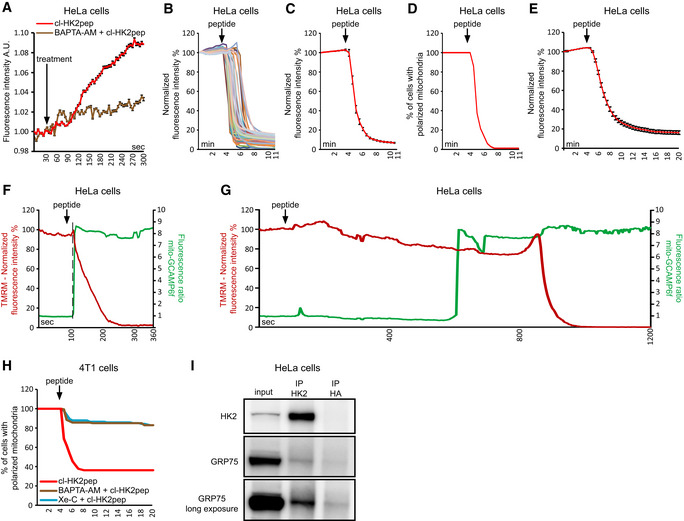
Figure EV3. Related to Fig 2. Kinetics of cl‐HK2pep‐induced mitochondrial depolarization.
-
AIP3 levels are assessed with the GFP‐PHD probe in presence or not of 10 μM BAPTA‐AM; data are reported as mean of fluorescent signals ± SEM (n = 3 independent experiments)
-
B–EChanges in mitochondrial membrane potential following cl‐HK2pep treatment assessed with TMRM as in Fig 2G. In B and C, HeLa cells are treated with 5 μM cl‐HK2pep; mitochondrial depolarization is shown for single cells (B; n = 60 cells analyzed from three independent experimental days) or as an averaged trace (C; n = 60 cells analyzed from three independent experimental days). TMRM signal is normalized to the initial value and expressed in percentage for each time point. D, TMRM positive HeLa cells are expressed in percentage (threshold count: fluorescence signal > 40% of initial value; n = 60 cells analyzed from three independent experimental days). E, HeLa cells are treated with 2 μM cl‐HK2pep (n = 216 cells analyzed from 10 independent experimental days; fluorescence mean ± SEM) and analyzed as in C.
-
F, GChanges in Ca2+ levels and membrane potential in HeLa cell mitochondria following treatment with 2 μM cl‐HK2pep. Measurements are performed in parallel on cells expressing mito‐GCAMP6f and loaded with TMRM. Two different single representative cell traces are shown, characterized by fast (F) or slow (G) mitochondrial depolarization following peptide treatment (three different experimental days). The dotted line indicates the time point in which mito‐GCAMP6f ratio increases from the basal.
-
HMitochondrial depolarization in 4T1 cells treated with 2 μM cl‐HK2pep (n = 129) is analyzed as in C. Where indicated, BAPTA‐AM (10 μM; n = 147) or Xe‐C (5 μM; n = 141) are added as in Fig 2B 1 h before experiment.
-
ICo‐immunoprecipitation between HK2 and GRP75.
Mitochondria can promptly take up Ca2+ released from ER, resulting in modulation of the activity of Krebs cycle enzymes and preventing deregulated increases in cytosolic [Ca2+] 24, 29. cl‐HK2pep treatment rapidly boosts mitochondrial [Ca2+] in a stable and Xe‐C‐sensitive way (Movie EV1 and Fig 2C–E), rising mitochondrial [Ca2+] to about 50 μM (Fig 2F). However, chelation of extracellular Ca2+ only induces a transient mitochondrial [Ca2+] peak of about 12 μM (Fig 2F), indicating that cl‐HK2pep administration elicits both Ca2+ release from ER and Ca2+ entry through plasma membrane, probably as a secondary effect 30, and that mitochondria take up Ca2+ from both sources. HK2 targeting also prompts a sudden and massive mitochondrial depolarization (Fig 2G and H, Movies EV2 and EV3 and Fig EV3B–E), which follows the increase in mitochondrial [Ca2+] (Fig EV3F and G). This depolarization is inhibited by chelating cytosolic or extracellular Ca2+ and by the IP3R inhibitor Xe‐C (Fig 2I and J, Movie EV4 and Fig EV3H).
Therefore, the HK2‐targeted peptide causes mitochondrial Ca2+ overload as a consequence of Ca2+ release form ER via IP3Rs and of Ca2+ entry through plasma membrane. This signaling is further supported by the observation that HK2 co‐immunoprecipitates with GRP75 (Fig EV3I), a chaperone that directly interacts with IP3R at MAMs and favors mitochondrial Ca2+ uptake upon IP3‐dependent Ca2+ release from the ER. This interaction is in line with the observation that HK2 locates to loose mitochondria‐ER contacts sites (Fig 1C and F), which can accommodate the bulky IP3R‐Grp75‐VDAC complexes 24.
The HK2‐targeting peptide triggers calpain‐dependent cell death
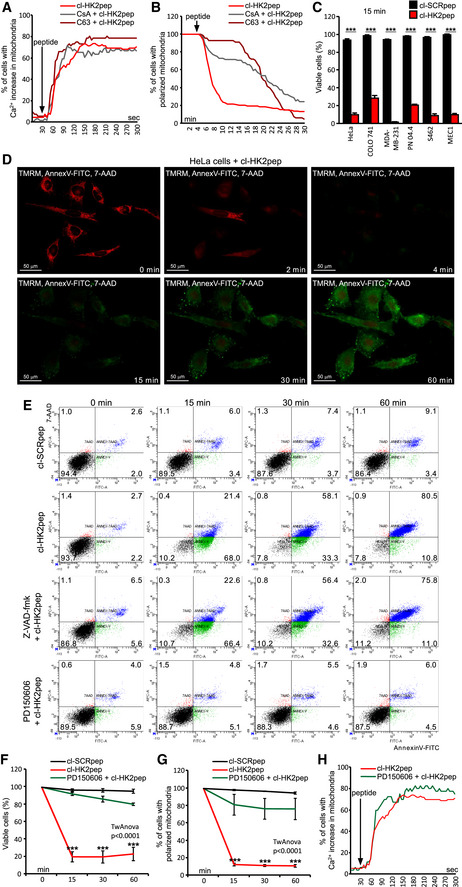
Overcoming the efflux and the buffering capacity of Ca2+ in mitochondria can induce the permeability transition pore (PTP), a high conductance channel the opening of which commits cells to death 31, 32. PTP opening is independently inhibited by two unrelated molecules, Cyclosporin‐A (CsA) and C63, but this inhibitory effect can be overwhelmed by intense stimuli of PTP induction 33. We find that both CsA and C63 do not affect mitochondrial Ca2+ uptake following cl‐HK2pep treatment (Fig 3A), but markedly delay mitochondrial depolarization (Fig 3B and Movies EV5 and EV6), indicating that this occurs downstream to PTP induction.
Figure 3. HK2pep induces PTP‐ and calpain‐dependent cell death.
-
A, BEffects of the PTP desensitizers CsA or C63 (5 μM each, 1 h pre‐incubation) on mitochondrial Ca2+ levels recorded with GCAMP6f (A) and on mitochondrial membrane potential assessed with TMRM (B) in cells treated with cl‐HK2pep.
-
C–FCell death induction by cl‐HK2pep; in the cytofluorimetric analyses reported in C, E, and F, viable cells are double negative for Annexin V‐FITC and 7‐AAD staining and measured 15 min after peptide treatment; in the kinetic experiment shown in D (scale bar: 50 μm), viable cells are double negative for Annexin V‐FITC and 7‐AAD and TMRM positive. In C and F, data are presented as mean ± SD and they were obtained from 3 different experiments or more; 3 technical replicates in all analyzed experiment.
-
G, HEffect of calpain inhibition on mitochondrial membrane potential assessed with TMRM (G, normalized fluorescence signal mean ± SD; three different experiments including three technical replicates each) and on mitochondrial Ca2+ levels recorded with GCAMP6f (H) in cells treated with cl‐HK2pep.
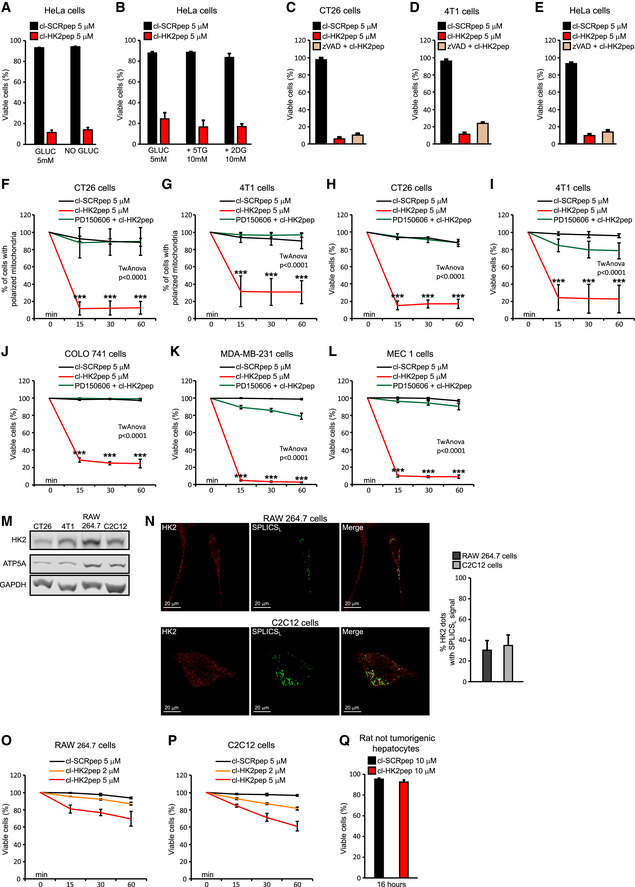
The HK2‐targeting peptide abruptly elicits cell death in all tested cancer cell models (Fig 3C). The effect of cl‐HK2pep did not change when cells were kept in the absence of glucose or were treated with HK inhibitors (Fig EV4A and B), indicating that it is independent of HK2 enzymatic activity. Peptide administration triggers mitochondrial depolarization in most tumor cells after 2–4 min, followed by phosphatidylserine exposure on the cell surface and plasma membrane rupture in < 1 h (Fig 3D and E, Movie EV7). Even though these are typical apoptotic changes, none of them is affected by the pan‐caspase inhibitor Z‐VAD‐fmk (Figs 3E and EV4C–E). However, the broad‐spectrum calpain inhibitor PD150606 abrogates cl‐HK2pep‐dependent induction of mitochondrial depolarization and cell death (Figs 3E–G and EV4F–L) without affecting the mitochondrial Ca2+ rise triggered by the peptide (Fig 3H). Taken together, these data indicate that HK2 displacement from MAMs does not trigger a classical apoptotic pathway, but rather activates a cell death process relying on the Ca2+‐dependent proteases calpains 34. We also evaluated the effect of cl‐HK2pep administration on non‐transformed cell types. Mouse RAW 264.7 macrophages and mouse C2C12 myoblasts express HK2 (Fig EV4M), even though it is barely located in MAMs (Fig EV4N). Treatment with cl‐HK2pep is poorly effective in inducing death of these cell models (Fig EV4O and P), and it does not elicit any apoptosis in HK2‐negative hepatocytes (Fig EV4Q).
Figure EV4. Related to Fig 3. Cell death induction by cl‐HK2pep in different cancer cell models and in non‐tumorigenic cell models.
-
A, BEffect of a 1 h glucose deprivation and of HK2 inhibition by 5‐thio‐glucose or 2‐deoxy‐glucose (10 mM each, 1 h pre‐incubation) on death induced in HeLa cells by a 15‐min treatment with 5 μM cl‐HK2pep. Cell death is assessed as in Fig 3C (mean ± SD n = 3 independent experiments).
-
C–EEffect of the pan‐caspase inhibitor Z‐VAD‐fmk (50 μM) on death elicited in HeLa, CT26, and 4T1 cells by a 15‐min treatment with 5 μM cl‐HK2pep. Cell death is assessed as in Fig 3C (mean ± SD n = 3 independent experiments).
-
F, GThe effect of the pan‐calpain inhibitor PD150606 (50 μM) on mitochondrial depolarization elicited by 5 μM cl‐HK2pep is measured as in Fig 3B (n = 3 independent experiments in each cell line; mean percentage of dead cells is normalized to time 0 ± SD; two‐way ANOVA: P < 0.0001, cl‐HK2pep treatment versus cl‐HK2pep+PD150606 or cl‐SCRpep treatments; Bonferroni post‐test in graphs ***P < 0.001).
-
H–LThe effect of PD150606 on cell death elicited by treatment with 5 μM cl‐HK2pep in CT26, 4T1, COLO 741, MDA‐MB‐231, and MEC1 cancer cell models is analyzed as in Fig 3F. Data ± SD are analyzed with a two‐way ANOVA: P < 0.0001, cl‐HK2pep treatment versus cl‐HK2pep+PD150606 or cl‐SCRpep treatments; Bonferroni post‐test in graphs ***P < 0.001. In experiments throughout the figure, cl‐SCRpep is used as a negative control; n ≥ 3 independent experiments for each cell line.
-
MWestern immunoblot analysis of HK2 levels in murine cell models (colon carcinoma CT26 cells, breast cancer 4T1 cells, macrophage RAW 264.7 cells, and myoblast C2C12 cells). ATP5A and GAPDH are mitochondrial and cytosolic loading controls, respectively.
-
NFluorescence co‐staining of HK2 and split‐GFP‐based probe for ER‐mitochondria contacts (SPLICSL) on C2C12 myoblasts and RAW264.7 macrophages. HK2 is revealed with an AlexaFluor555‐conjugated secondary antibody. SPLICSL‐HK2 co‐localization is quantified in the bar graph on the right (mean ± SD, three independent experiments). Scale bar, 20 μm.
-
O, PEffect of cl‐HK2pep (2 and 5 μM) on cell death in RAW 264.7 and C2C12 non‐transformed cells. Cell death is assessed by cytofluorimetry as in Fig 3C (mean ± SD, three independent experiments).
-
QEffect of cl‐HK2pep (10 μM) on cell death in rat not tumorigenic hepatocytes. Cell death is assessed by cytofluorimetry as in Fig 3C (mean ± SD, three independent experiments).
The HK2‐targeting peptide kills primary B‐chronic lymphatic leukemia (B‐CLL) cells and inhibits neoplastic growth of colon and breast cancer cells
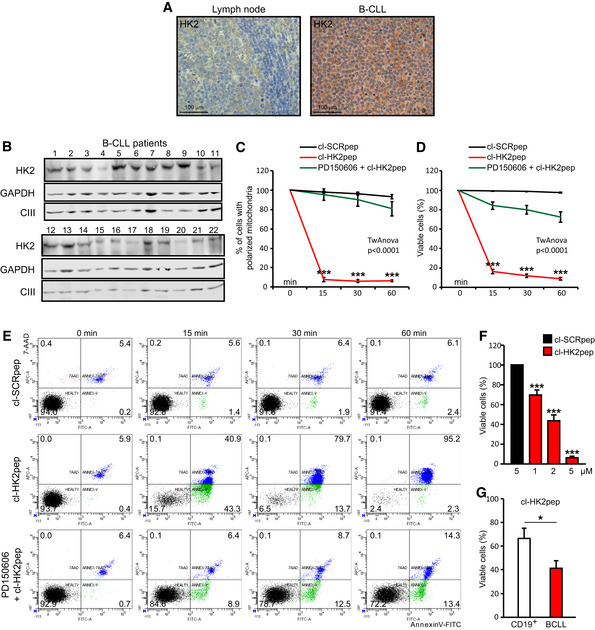
In order to test its efficacy as a potential anti‐neoplastic treatment, we studied the effect of cl‐HK2pep on freshly isolated leukemia cells obtained from B‐CLL patients. B‐CLL is the most common leukemia form that accounts for about 40% of all adult leukemias 35. Although in the last years several new molecules, including anti‐CD20 antibodies as well as kinase inhibitors, have become available for B‐CLL therapy, the disease remains incurable and B‐CLL patients usually relapse and/or become refractory. Induction of HK2 contributes to rituximab resistance 36, and release of MMP9 increases motility of B‐CLL cells 37; hence, B‐CLL constitutes an interesting model for testing the effectiveness of HK2pep. HK2 is poorly detectable in non‐transformed B cells, whereas it is expressed in B‐CLL cells of all patients that we have analyzed (Fig 4A and B) independently of their mutation status (Table 1). All these patients’ cells undergo a massive mitochondrial depolarization and cell death in the first 15 min of cl‐HK2pep treatment (Fig 4C–E). These events are calpain‐dependent (Fig 4C–E) and in all analyzed samples HK2 targeting completely erases B‐CLL cells (Fig 4F), whereas it is less effective in inducing death in non‐neoplastic, CD19+ B cells (Fig 4G).
Figure 4. HK2pep kills primary B‐CLL cells.
-
ARepresentative IHCs in human reactive lymphoid tissue, where HK2 expression is mainly restricted to proliferating blasts within germinal centers (center) and in patient B‐CLL cells. Scale bar 100 μm.
-
B–GEffect of cl‐HK2pep on human B‐CLL cells freshly isolated from patients. HK2‐expressing B‐CLL cells (B; GAPDH and respiratory complex III subunit UQCRC2 are cytosol and mitochondrial loading controls, respectively) undergo mitochondrial depolarization assessed by TMRM staining (C) and cell death, measured by cytofluorimetric analysis of Annexin V‐FITC and 7‐AAD staining (D‐G). Cells are treated with 5 μM cl‐HK2pep; PD150606 (50 μM) is pre‐incubated for 1 h. Experiments are carried out on samples from at least 10 patients and on CD19+, primary B lymphocytes from 5 healthy controls. In C, D, F, and G, data are presented as mean ± SEM; all data were obtained from three technical replicates in all analyzed patient samples. In (C, D) two‐way ANOVA: P < 0.0001 (cl‐HK2pep treatment versus cl‐HK2pep+PD150606 or cl‐SCRpep treatments); Bonferroni post‐test in graph ***P < 0.001 (cl‐HK2pep versus cl‐SCRpep and cl‐HK2pep versus PD150606+cl‐HK2pep), in F and G, Student's t‐test; ***P < 0.01, *P < 0.05.
Table 1.
Biological and clinical characteristics of the 22 B‐CLL patients analyzed
| Median age, years (range) | 74 (62–86) |
| Male/Female | 12/10 |
| WBC count,/mm3 (range) | 72,435 (21,410–168,940) |
| Lymphocytes, % (range) | 80 (58‐92) |
| Mutateda | 14/22 |
| Karyotype (Nb/13q‐/12 + /11q‐/17p‐) | 3/15/3/0/1 |
WBC, white blood cell.
Mutated was defined as having a frequency of mutations > 2% from the germline IGHV sequence.
N = normal karyotype.
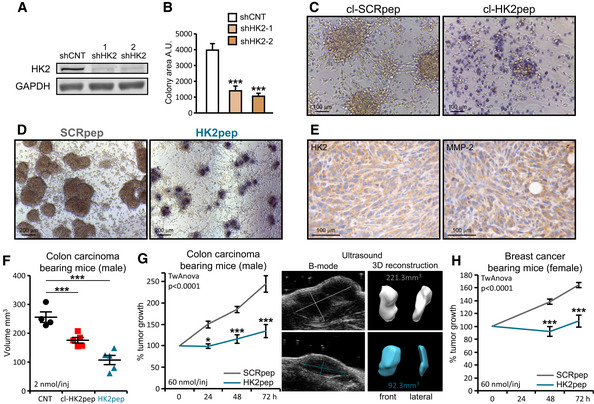
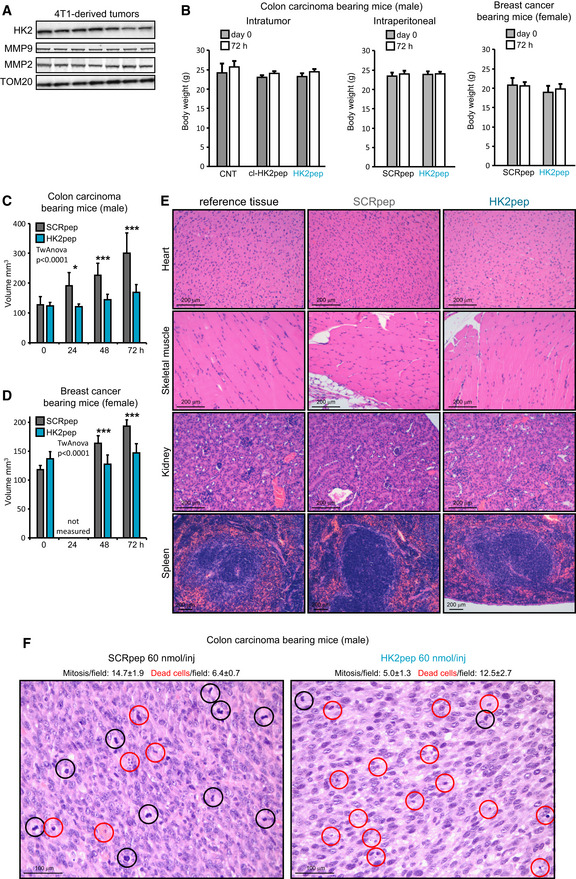
We have then evaluated the effect of targeting HK2 on solid tumors. Silencing HK2 expression hampers the ability of cancer cells to form colonies (Fig 5A and B), and HK2 targeting with both cl‐HK2pep and the entire HK2pep inhibits in vitro tumorigenic growth by killing cancer cells (Fig 5C and D). Efficacy of the entire HK2pep indicates that its active moiety is released by MMP2/9 cleavage and that this peptide can be used on in vivo neoplastic models in which HK2 and MMP2/9 are expressed (Figs 5E and EV5A). We observe that intratumor injections of either cl‐HK2pep or entire HK2pep significantly decrease the volume of allograft‐injected colon cancer cells (Fig 5F), and the same result is achieved by intraperitoneal injection of entire HK2pep on both colon and breast cancer allografts (Figs 5G and H, and EV5C and D, Movies EV8 and EV9). Peptide administration does not cause any harm in treated animals, as assessed by lack of weight loss and of tissue damage (Fig EV5B and E), whereas it decreases mitotic index and enhances apoptosis inside tumor masses (Fig EV5F).
Figure 5. The HK2‐targeting peptide inhibits in vitro and in vivo tumor growth.
-
A–DEffect of HK2 targeting on in vitro tumorigenicity. HK2 silencing with two different shRNAs (shHK2‐1 and shHK2‐2) in CT26 colon cancer cells (A) inhibits growth in soft agar (B; colony area ± SEM; n = 6 replicates obtained from three independent experiments; Student's t‐test ***P < 0.001; A.U., arbitrary units). Treatment with cl‐HK2pep (50 μM, 6 h; C, scale bar: 100 μm) or with the uncleaved HK2pep (2 μM, 48 h; D, scale bar: 200 μm) reverts formation of foci; dead cells are highlighted by Trypan Blue staining.
-
E–HEffect of HK2‐targeting on in vivo neoplastic growth. HK2‐ and MMP‐2‐expressing CT26 cells (E, scale bar: 100 μm) are allografted in Balb/c male mice. Intratumor administration (5 injections of 2 nmol peptide every 12 h) of either cl‐HK2pep or HK2pep (F; CNT n = 4; cl‐HK2pep n = 5; HK2pep n = 5 mice), or intraperitoneal administration of HK2pep (G; 5 injections of 60 nmol peptide every 12 h; SCRpep n = 6; HK2pep n = 7 mice) reduce neoplastic growth; the same effect is observed on allografts of breast carcinoma 4T1 cells (H; 5 injections of 60 nmol peptide every 12 h; SCRpep n = 5; HK2pep n = 7 mice) in Balb/c female mice.
Figure EV5. Related to Fig 5. Analysis of mouse samples following xenograft injection of tumor cells and peptide treatment.
-
AWestern immunoblot analysis of MMP2 and MMP9 expression in neoplasms formed by 4T1 cells in mouse allografts; TOM20 is used as loading control.
-
BBody weight measurements of mice from experiments reported in Fig 5F–H (from left to right, respectively—mean ± SD; F: CNT n = 4; cl‐HK2pep n = 5; HK2pep n = 5 mice; G: SCRpep n = 6; HK2pep n = 7 mice; H: SCRpep n = 5; HK2pep n = 7 mice).
-
C, DEffect of HK2‐targeting on in vivo neoplastic growth. Intraperitoneal administration of HK2pep (C; 5 injections of 60 nmol peptide every 12 h; SCRpep n = 6; HK2pep n = 7) reduce neoplastic growth; the same effect is observed on allografts of breast carcinoma 4T1 cells (D; 5 injections of 60 nmol peptide every 12 h; SCRpep n = 5; HK2pep n = 7) in Balb/c female mice. A two‐way ANOVA is performed (P < 0.0001‐HK2pep versus SCRpep during the time); Bonferroni post‐test in the graphs *P < 0.05; ***P < 0.001.
-
ERepresentative hematoxylin/eosin staining on samples from heart, skeletal muscle, kidney, and spleen obtained from mice‐bearing CT26 tumors after peptide treatment as in Fig 5G. Scale bar: 200 μm.
-
FCell death and mitosis analyses on tumor slices from Fig 5G experiment. Dead or mitotic cells were counted on samples stained with hematoxylin/eosin (SCRpep versus. HK2pep; mitotic cells count: P < 0.001 with Student's t‐test; dead cell count: P < 0.05 with Student's t‐test; at least 10 different fields where counted for each tumor samples). Scale bar: 100 μm.
Our results indicate that HK2 specifically locates in MAMs and that unhinging HK2 from MAMs swiftly elicits calpain‐dependent death in cancer cells by funneling Ca2+ into mitochondria from ER and extracellular milieu. This signaling pathway is unprecedented, even though it is consistent with emerging evidences of a role played by MAMs in the maintenance of glucose homeostasis 23. We unveil a role of HK2 in handling intracellular Ca2+ fluxes, which suggests that HK2 can act as a regulatory hub to integrate glucose metabolism with Ca2+‐mediated biochemical events, spanning from physiological responses to metabolic fluctuations to death induction under stress conditions. Hence, HK2 could contribute to the orchestration of the biochemical crosstalk between ER and mitochondria, with relevant implications both in the physiology and in several pathological conditions of HK2‐expressing tissues, including diabetes, ischemic damage of the heart or muscle wasting diseases, notwithstanding tumors.
HK2 shuttling to mitochondria is modulated by Akt‐dependent threonine phosphorylation 11 and HectH9‐dependent, non‐proteolytic lysine ubiquitination 38. These data place mitochondrial localization of HK2 in a multifaceted network of regulatory events, and the functional interaction between HK2 and IP3Rs that we observe further adds to this network. A thorough dissection of the dynamic modulation of these interactions will be instrumental for the comprehension of the effects of HK2 displacement from MAMs. Importantly, non‐tumor cells expressing HK2 are much more refractory to peptide toxicity than neoplastic cells. This is a promising observation under a therapeutic perspective. Nonetheless, it is necessary to understand whether MAM composition differs between tumor and non‐tumor cells, and how this affects HK2 activity and localization, as well as to connect cell response to HK2pep to the pattern of calpain expression, in order to draw an exhaustive picture of the mode of peptide action and to preview its effectiveness in specific settings.
The use of CPPs as vectors for the delivery of molecules with anti‐cancer activity constitutes an active field of investigation, even though the transfer of this approach to the clinical practice has been hampered up to now by several shortcomings, such as the lack of cell specificity and the short duration of action 39. Here, we combine several strategies to overcome these limitations. HK2pep is an activatable peptide composed by assembled modular units that can be adapted to the specific tumor(s) to be targeted. The MMP2/9 cleavage site allows the selective activation of HK2pep where these metalloproteases are highly expressed, as in the microenvironment of several tumors, but cleavage sites for other extracellular matrix components can be envisaged and tailored to specific neoplastic types. The limited size of HK2 pep (< 5 kDa) allows its passage through the fenestrated endothelium that characterizes many malignancies, and the rapidity of action of its cleaved form can circumvent problems connected with timing of degradation or excretion. Moreover, the absence of any inhibitory effect of HK2pep on the enzymatic activity of hexokinases minimizes the risk of non‐specific damage caused by alterations of glucose metabolism at secondary sites. Hence, our approach to displace HK2 from MAMs integrates selectivity, efficacy, and lack of off‐target effects and could be evolved toward the development of novel anti‐neoplastic strategies, conceivably in combination with other chemotherapeutic approaches that target different liabilities of neoplastic cells.
Materials and Methods
Cell culture and HK2 silencing
Human cervix carcinoma HeLa cells, human breast cancer MDA‐MB‐231 cells, human malignant peripheral nerve sheath tumor S462 cells, human plexiform neurofibroma PN 04.4 cells, mouse breast cancer 4T1 cells and mouse colorectal carcinoma CT26 cells, mouse macrophage RAW 264.7 cells and, mouse myoblast C2C12 cells were cultured in DMEM medium (Gibco); colorectal carcinoma COLO 741 cells and B‐CLL MEC1 cells were cultured in RPMI 1640 medium (Gibco); both culture media were supplemented with 10% fetal bovine serum (Gibco), glutamine 2 mM (Gibco), and penicillin–streptomycin (100 μg/ml; Invitrogen) and were kept at 37°C in a 5% CO2 humidified atmosphere.
HKII expression was stably interfered by infecting cells with a lentivirus carrying the following shRNAs (Sigma) against mouse HKII mRNA:
CCGGCATCACCCTGCTGGTTCTAAACTCGAGTTTAGAACCAGCAGGGTGATGTTTTTG;
CCGGCGGTACAGAGAAAGGAGACTTCTCGAGAAGTCTCCTTTCTCTGTACCGTTTTTG.
Scrambled shRNA (Sigma) was used as negative control. Transduced cells were selected in 1.0 μg/ml puromycin.
Histological and immunohistochemical analyses
Histological and immunohistochemical analyses were performed both on primary human samples (colorectal carcinoma, n = 6; breast carcinoma, n = 6; MPNST, n = 6; lymph nodes deriving from B‐cell chronic lymphocytic leukemia patients, n = 6) and on samples derived from mouse tumor models (PN tumors; CT26 and 4T1 subcutaneous grafts in Balb/c mice). In detail, 4‐μm‐thick tissue sections were obtained from formalin‐fixed paraffin‐embedded tissue samples and representative tumor areas were selected on H&E‐stained slides for immunohistochemical (IHC) analysis. IHC was performed using primary goat polyclonal anti‐HK2 (sc‐6521, Santa Cruz) and rabbit monoclonal anti‐MPP2 (ab92536, Abcam) antibodies. Antigen retrieval was performed with heat/EDTA in the Bond‐Max automated immunostainer (Leica Biosystems), as previously described 40.
Cell lysates and Western immunoblot analysis
Cells lysis (5 × 10⁵ for each assay) was performed in Tris 20 mM, NaCl 150 mM, EDTA 2 mM, EGTA 2 mM, and Triton X‐100 0.5% supplemented with phosphatase and protease inhibitors (Sigma). Protein quantification was performed with BCA Protein Assay Kit (Thermo Scientific‐Pierce). After SDS/PAGE gel electrophoresis, proteins were transferred onto nitrocellulose Hybond‐C Extra membranes (Amersham, Uppsala; Sweden) and immunostained with goat polyclonal anti‐HK2 (clone sc‐6521, Santa Cruz), anti‐GAPDH (#2118, Cell Signaling), ATP5A (ab14748, Abcam), anti‐UQCRC2 (ab14745, Abcam), rabbit monoclonal anti‐MMP2 (ab92536, Abcam), rabbit monoclonal anti‐MMP9 (ab137867, Abcam) rabbit polyclonal, and TOM20 (sc‐11415, Santa Cruz) antibodies.
Peptide synthesis
HK2pep, SCRpep, cl‐HK2pep, and cl‐SCRpep were synthesized by automatic solid‐phase procedures using a multiple peptide synthesizer (SyroII, MultiSynTech GmbH) on a pre‐loaded Wang resin (100–200 mesh) (Novabiochem). The fluoren‐9‐ylmethoxycarbonyl (Fmoc) strategy was used throughout the peptide chain assembly, utilizing O‐(7‐azabenzotriazol‐1‐yl)‐N,N,N′,N′‐tetramethyluronium hexafluorophosphate (HATU) as coupling reagent. The side‐chain protected amino acid building blocks used were as follows: Fmoc‐Tyr(tert‐butyl), Fmoc‐Glu(tert‐butyl), Fmoc‐Ser(tertbutyl), Fmoc‐Thr(tert‐butyl), Fmoc‐His(trityl), Fmoc‐Asn(trityl), and Fmoc‐ Arg(2,2,4,6,7‐pentamethyldihydrobenzofuran‐5‐sulfonyl). Cleavage of the peptides was performed by reacting the peptidyl‐resins with a mixture containing TFA/H20/thioanisole/ethanedithiol/phenol (10 ml/0.5 ml/0.5 ml/0.25 ml/750 mg) for 2.5 h. Crude peptides were purified by a preparative reverse‐phase HPLC. Molecular masses of the peptide were confirmed by mass spectroscopy on a MALDI TOF‐TOF using a Applied Biosystems 4800 mass spectrometer. The purity of the peptides was about 95% as evaluated by analytical reverse‐phase HPLC. Peptide sequences:
HK2pep: MIASHLLAYFFTELN‐βA‐RRRRRRRRR‐PLGLAG‐Ahx‐EEEEEEEE
SCRpep: VGAHAGEYGAEALER‐βA‐RRRRRRRRR‐PLGLAG‐Ahx‐EEEEEEEE
cl‐HK2pep: MIASHLLAYFFTELN‐βA‐RRRRRRRRR‐PLG
cl‐SCRpep: VGAHAGEYGAEALER‐βA‐RRRRRRRRR‐PLG
Fluorescent peptide synthesis
Fluo‐cl‐HK2pep and fluo‐cl‐SCRpep were synthesized by microwave‐assisted solid‐phase procedures using a Biotage Alstra peptide synthesizer on a pre‐loaded HMPB‐resin (100–200 mesh‐Iris Biotech GmbH). The fluoren‐9‐ylmethoxycarbonyl (Fmoc) strategy was used throughout the peptide chain assembly. Activation of entering Fmoc‐protected amino acids (0.3 M solution in DMF) was performed using 0.5 M Oxyma in DMF/0.5 M DIC in DMF (1:1:1 molar ratio), with a 5 equivalent excess over the initial resin loading. Coupling steps were performed for 7 min at 75°C. Fmoc‐deprotection steps were performed by treatment with a 20% piperidine solution in DMF at room temperature (1 × 10 min). Following each coupling or deprotection step, peptidyl‐resin was washed with DMF (4 × 3.5 ml). Upon complete chain assembly, resin was washed with DCM (5× 3.5 ml) and gently dried under a nitrogen flow. Resin‐bound peptide was treated with an ice‐cold TFA, TIS, water, and thioanisole mixture (90:5:2.5:2.5 v/v/v/v, 4 ml) for 2 h. Crude peptides were purified by a preparative reverse‐phase HPLC. Molecular masses of the peptide were confirmed by mass spectroscopy using a Bruker Esquire 3000 + instrument equipped with an electro‐spray ionization source and a quadrupole ion trap detector (QITD). The purity of the peptides was about 95% as evaluated by analytical reverse‐phase HPLC. Peptide conjugation with fluorescent dyes (ATTO) was performed by reacting peptide thiol groups with maleimide‐ATTO dyes. Briefly, peptides were dissolved at a 5 mg/ml concentration in PBS buffer (pH 7.2) and 1.1 equivalents of maleimide‐dye were added to the solution. Reaction was monitored by HPLC until completion and then the product isolated by preparative HPLC.
HK2pep cleavage assay
Human recombinant MMP9 (911MP, R&D) was reconstituted following manufacturer's instructions in a buffer composed by 50 mM Tris, 150 mM NaCl, 10 mM CaCl2, and 0.05% Brij−35 (w/v) at pH 7.5 and activated with p−aminophenylmercuric acetate (Sigma). hMMP9 (20 nM) was incubated for 4 h with 1 μg HK2pep in a final 100 μl volume; samples were analyzed by mass/spec as described above.
Measurement of hexokinase enzymatic activity
Hexokinase enzymatic activity was measured monitoring NADPH formation at 37°C with Infinite M200 spectrophotometer (TECAN) in a buffer containing 50 mM Tris, 10 mM MgCl2, 4 mM ATP, 2 mM glucose, 0.1 U/ml G6PDH, and 1 mM NADP, pH 7.4. Experiments were carried out either using Human HK2 recombinant protein (0.5 μg; HXK0703, ATGEN) or total cell lysate (20 μg) were exposed for 30 min to 10 μM cl‐HK2pep. To discriminate between HK1 and HK2 activities in cells, samples were heated to 46°C for 30 min in order to inactivate thermo‐sensitive HK2 activity.
Immunofluorescence (IF) analyses
IF experiments were carried out 24 h after transfection with TransIT®‐LT1 (Mirus) on cells fixed in 4% PFA, quenched with NH4Cl (0.24% in PBS), and permeabilized with 0.1% Triton X‐100.
Primary antibodies (rabbit monoclonal anti‐HK2, H.738.7, Thermo Scientific; mouse monoclonal anti‐TOM20, sc‐17764, Santa Cruz) were diluted 1:150 in blocking solution (2% BSA, 10% goat serum, and 0.2% gelatin in PBS) and incubated for 90 min, at RT; AlexaFluor488/555/647‐conjugated secondary antibodies (Life Technologies) were diluted 1:300 in blocking solution and incubated 45 min at RT. Images were collected on a Leica SP5‐II confocal microscope and equipped with a 100×/1.4 N.A. Plan Apochromat objective. A WLL laser was used to excite each specific dye, and a HyD (Leica) was employed for signal collection. After background subtraction, Pearson's co‐localization coefficient was calculated with the ImageJ Co‐localization Analysis plugin. Displayed images were processed with the automatic ImageJ plugin Enhance image to improve signal intensity, but analyses were performed on raw, background‐subtracted data. For measurements of co‐localization with the split‐GFP‐based probe for ER‐mitochondria contacts (SPLICSL) 20, TOM20 and HK2 channels were background subtracted, a threshold (the mean fluorescence intensity for each cell) was imposed, and the % of pixels co‐localized with SPLICSL was calculated, as described 41. The plasmids encoding mt‐YFP, mt‐RFP, and ER‐CFP were previously described 41.
Mitochondrial Ca2+ measurements
For FRET‐based ER Ca2+ measurements, cells were transfected with the ER‐targeted D4ER Ca2+ probe and mounted into an open‐topped chamber in Krebs–Ringer modified buffer (mKRB, in mM: 140 NaCl, 2.8 KCl, 2 MgCl2, 10 HEPES, 11 glucose, pH 7.4 at 37°C) supplemented with CaCl2 1 mM; imaging was performed with a DM6000 inverted microscope (Leica, HCX Plan Apo 40 × oil objective, NA 1.25), as previously described 42. Excitation light was generated every 5s by a 410 nm LED (Led Engin LZ1‐00UA00 LED). ImageJ was used for off‐line analysis of FRET experiments. YFP and CFP images were background‐subtracted and analyzed selecting specific regions of interest (ROIs) on each cell. The ratio (R) between YFP and CFP emissions was calculated for each frame.
For GCAMP6f Ca2+ measurements, cells were transfected with a cDNA encoding mitochondrial and nuclear GCAMP6f 41. To perform Ca2+ measurements, medium was replaced with mKRB buffer supplemented with 1 μM CsH (Adipogen) and with 1 mM CaCl2 or 500 μM EGTA. Where indicated, specific drugs were added to the buffer and pre‐incubated for 30 min with BAPTA‐AM (5 μM, Thermo Fisher Scientific) or 1 h with Xestospongin C (5 μM, Santa Cruz), CsA (5 μM, Sigma), C63 (5 μM), or PD150606 (50 μM, Calbiochem). Fluorescence was recorded with an inverted microscope (Zeiss Axiovert 100, Fluar 40× oil objective, NA 1.30) in the 500–530 nm range (by a band‐pass filter, Chroma Technologies). Probes were sequentially excited at 475 nm and at 410 nm, respectively, for 180 and 300 ms, every 5 s. Excitation light, produced by a monochromator (polychrome V; TILL Photonics), was filtered with a 505 nm DRLP filter (Chroma Technologies). After background subtraction, images were analyzed with ImageJ, calculating the ratio (R) between emissions generated by exciting cells at 475 and 410 nm, respectively, in specific ROIs comprising the entire mitochondrial network. [Ca2+] is proportional to R.
For aequorin Ca2+ measurements, cells were transfected with a plasmid encoding low‐affinity mitochondrial matrix aequorin (mit‐Aeqmut), which was reconstituted by incubating cells for 1 h in mKRB, supplemented with CaCl2 1 mM and native coelenterazine (5 μM, Biotium). Measurements were performed as previously described 41.
IP3 measurement assay
In order to assess changes in intracellular IP3 levels, cells were transfected with a plasmid encoding the GFP‐tagged pleckstrin homology (PH) domain of PLC‐δ1 (GFP‐PHD). Quantification of IP3 generation was evaluated as variations in cytosolic GFP‐PHD fluorescence (F) normalized to initial cytosolic fluorescence (F0), due to the release of GFP‐PHD from the plasma membrane upon PIP2 cleavage and IP3 generation 43. Only cells (~80%) in which a plasma membrane localization of GFP‐PHD was evident were selected for analysis. Images were collected on a DM6000 inverted microscope (Leica, HCX Plan Apo 40× oil objective, NA 1.25). Excitation light was generated every 5 s by a 460 nm LED (Led Engin).
Measurements of mitochondrial membrane potential
Mitochondrial membrane potential was analyzed using the fluorescent potentiometric compound tetramethylrhodamine methyl ester (TMRM, 20 nM; Invitrogen). Cells were incubated in mKRB or DMEM without phenol red and with CsH (1 μM) to inhibit P‐glycoproteins. Recordings were performed either with a fluorescence microscope (Olympus IX71 or Leica DMI600B) or with a flow cytometer (FACSCanto II, Becton Dickinson). For live microscope experiments, recordings were carried out every 30 sec using CellR software (Olympus) or LAS AF software (Leica). For flow cytometry analyses, TMRM signals are measured every 15 min and analyzed with FACSDiva software (Becton Dickinson). Movies were realized using CellR software (Olympus).
Cell viability assays
Cell viability was assessed either by cytofluorimetry or by fluorescence microscopy. Cytofluorimetric recordings of phosphatidylserine exposure on the cell surface (increased staining of FITC‐conjugated Annexin V; Roche) and loss of plasma membrane integrity (7‐AAD staining; Sigma) were repeated every 15 min on a FACSCanto II instrument and analyzed with FACSDiva software. Double‐negative cells were considered viable. Fluorescence microscope recordings were performed with Leica DMI600B microscope and acquired with LAS AF software in the presence of Annexin V‐FITC, 7‐AAD, and TMRM pre‐incubated for 45 min. Images and movie obtained with LAS AF software were analyzed with ImageJ software.
Isolation of B lymphocytes
Cell samples that matched standard morphological and immunophenotypic criteria for B‐CLL were collected from 22 therapy‐free patients after obtaining informed consent according to the Declaration of Helsinki. This study was authorized by the Ethics Committee of the Padova University Hospital (Approve Code: n. 3529/AO/14). Patient characteristics are reported in Table 1. Cells were separated by Ficoll‐Hypaque gradient centrifugation (Euroclone), and B cells were purified from the PBMCs by removing T cells with the sheep erythrocyte rosetting method 44. Untreated peripheral blood B cells were isolated from the PBMCs of healthy donors by negative selection with the RosetteSep for isolation of B cells (StemCell Technologies). All samples were used when they contained ≥ 95% CD19+ cells, as assessed by flow cytometry.
In vitro tumorigenesis assays
For soft agar assays, cells in DMEM medium supplemented with 0.5% serum were mixed with low melting point agarose (Promega) at a final 0.6% concentration and plated on a bottom layer of DMEM with 1% LMP agarose. Fresh medium (DMEM 4% serum) was added every 3rd day. At day 15th, colonies were stained with Crystal Violet 0.005% and analyzed with ImageJ software.
For focus forming assays, cells were seeded in standard DMEM medium with 10% FBS, which was replaced with DMEM 0.5% FBS after cells reached confluence. Treatment with peptides was performed after formation of foci; dead cells were highlighted by Trypan Blue staining. Images were acquired using a Leica DMIL LED microscope equipped with a Leica ICC50 HD camera.
In vivo tumorigenesis assays
Colon cancer CT26 cells or breast cancer 4T1 cells were allografted in Balb/c mice according to a protocol approved from Italian Health Ministry (authorization number: 547/2016‐PR). Briefly, 100,000 CT26 cells or 200,000 4T1 cells were injected subcutaneously in the flank of male or female animals, respectively, in a 100 μl final volume containing 30% Matrigel (Corning). Tumors were visible under the skin after 7–9 days and measured with caliper (two major axes). Tumor volume was calculated using the formula: (a*b2)/2. Ultrasound inspections of representative tumors were performed using Vevo 2100 (Visualsonic, Fujifilm). Acquisitions, measurements, and 3D reconstructions of tumors were done using VevoLAB 1.7.0.7071 software. Peptides were injected as described in the text.
Measurements of extracellular acidification rate (ECAR)
In vivo ECAR was measured in order to assess changes in glycolytic activity in a kinetic mode on cell monolayers with an extracellular flux analyzer (Agilent Seahorse XF24), as described 45. ECAR values were then normalized for the protein content of each sample.
Author contributions
Conceptualization, FCi, AR, and PB; Investigation, FCi, RF, IM, and MP; Resources, OM, ND, AG, FF, FCh, and LT; Formal Analysis, FCi and RF; Visualization, FCi and RF; Funding Acquisition, AR and PB; Supervision, FCi and AR; Project Administration, AR; Writing‐Original Draft, AR; Writing‐Review and Editing, AR, FCi, RF, PP, LT, PP, and PB.
Conflict of interest
A patent application was filed by University of Padova for the use of the HK2‐targeting peptide described in the manuscript as an anti‐neoplastic tool in in vitro and in vivo experiments.
Supporting information
Expanded View Figures PDF
Movie EV1
Movie EV2
Movie EV3
Movie EV4
Movie EV5
Movie EV6
Movie EV7
Movie EV8
Movie EV9
Review Process File
Acknowledgements
This work was supported by grants from University of Padova, Neurofibromatosis Therapeutic Acceleration Program, Associazione Italiana Ricerca Cancro (AIRC grant IG 2017/20749 to A.R. and AIRC grant IG 2015/17067 to P.B.), Piano for Life Onlus, and Linfa OdV. IM was recipient of a Young Investigator Award Grant from the Children's Tumor Foundation.
EMBO Reports (2020) 21: e49117
References
- 1. Wilson JE (2003) Isozymes of mammalian hexokinase: structure, subcellular localization and metabolic function. J Exp Biol 206: 2049–2057 [DOI] [PubMed] [Google Scholar]
- 2. Vander Heiden MG, DeBerardinis RJ (2017) Understanding the intersections between metabolism and cancer biology. Cell 168: 657–669 [DOI] [PMC free article] [PubMed] [Google Scholar]
- 3. DeWaal D, Nogueira V, Terry AR, Patra KC, Jeon SM, Guzman G, Au J, Long CP, Antoniewicz MR, Hay N (2018) Hexokinase‐2 depletion inhibits glycolysis and induces oxidative phosphorylation in hepatocellular carcinoma and sensitizes to metformin. Nat Comm 9: 446 [DOI] [PMC free article] [PubMed] [Google Scholar]
- 4. Robey RB, Hay N (2006) Mitochondrial hexokinases, novel mediators of the antiapoptotic effects of growth factors and Akt. Oncogene 25: 4683–4696 [DOI] [PubMed] [Google Scholar]
- 5. Wang L, Xiong H, Wu F, Zhang Y, Wang J, Zhao L, Guo X, Chang LJ, Zhang Y, You MJ et al (2014) Hexokinase 2‐mediated Warburg effect is required for PTEN‐ and p53‐deficiency‐driven prostate cancer growth. Cell Rep 8: 1461–1474 [DOI] [PMC free article] [PubMed] [Google Scholar]
- 6. Patra KC, Wang Q, Bhaskar PT, Miller L, Wang Z, Wheaton W, Chandel N, Laakso M, Muller WJ, Allen EL et al (2013) Hexokinase 2 is required for tumor initiation and maintenance and its systemic deletion is therapeutic in mouse models of cancer. Cancer Cell 24: 213–228 [DOI] [PMC free article] [PubMed] [Google Scholar]
- 7. Bhalla K, Jaber S, Nahid MN, Underwood K, Beheshti A, Landon A, Bhandary B, Bastian P, Evens AM, Haley J et al (2018) Role of hypoxia in diffuse large B‐cell lymphoma: metabolic repression and selective translation of HK2 facilitates development of DLBCL. Sci Rep 8: 744 [DOI] [PMC free article] [PubMed] [Google Scholar]
- 8. Semenza GL (2013) HIF‐1 mediates metabolic responses to intratumoral hypoxia and oncogenic mutations. J Clin Invest 123: 3664–3671 [DOI] [PMC free article] [PubMed] [Google Scholar]
- 9. Mathupala SP, Ko YH, Pedersen PL (2009) Hexokinase‐2 bound to mitochondria: cancer's stygian link to the “Warburg Effect” and a pivotal target for effective therapy. Semin Cancer Biol 19: 17–24 [DOI] [PMC free article] [PubMed] [Google Scholar]
- 10. Roberts DJ, Tan‐Sah VP, Ding EY, Smith JM, Miyamoto S (2014) Hexokinase‐II positively regulates glucose starvation‐induced autophagy through TORC1 inhibition. Mol Cell 53: 521–533 [DOI] [PMC free article] [PubMed] [Google Scholar]
- 11. Miyamoto S, Murphy AN, Brown JH (2008) Akt mediates mitochondrial protection in cardiomyocytes through phosphorylation of mitochondrial hexokinase‐II. Cell Death Differ 15: 521–529 [DOI] [PubMed] [Google Scholar]
- 12. Pantic B, Trevisan E, Citta A, Rigobello MP, Marin O, Bernardi P, Salvatori S, Rasola A (2013) Myotonic dystrophy protein kinase (DMPK) prevents ROS‐induced cell death by assembling a hexokinase II‐Src complex on the mitochondrial surface. Cell Death Dis 4: e858 [DOI] [PMC free article] [PubMed] [Google Scholar]
- 13. Roberts DJ, Miyamoto S (2015) Hexokinase II integrates energy metabolism and cellular protection: akting on mitochondria and TORCing to autophagy. Cell Death Differ 22: 248–257 [DOI] [PMC free article] [PubMed] [Google Scholar]
- 14. Mathupala SP, Ko YH, Pedersen PL (2010) The pivotal roles of mitochondria in cancer: Warburg and beyond and encouraging prospects for effective therapies. Biochim Biophys Acta 1797: 1225–1230 [DOI] [PMC free article] [PubMed] [Google Scholar]
- 15. Wolf A, Agnihotri S, Micallef J, Mukherjee J, Sabha N, Cairns R, Hawkins C, Guha A (2011) Hexokinase 2 is a key mediator of aerobic glycolysis and promotes tumor growth in human glioblastoma multiforme. J Exp Med 208: 313–326 [DOI] [PMC free article] [PubMed] [Google Scholar]
- 16. Suh DH, Kim MA, Kim H, Kim MK, Kim HS, Chung HH, Kim YB, Song YS (2014) Association of overexpression of hexokinase II with chemoresistance in epithelial ovarian cancer. Clin Exp Med 14: 345–353 [DOI] [PubMed] [Google Scholar]
- 17. Akins NS, Nielson TC, Le HV (2018) Inhibition of glycolysis and glutaminolysis: an emerging drug discovery approach to combat cancer. Curr Top Med Chem 18: 494–504 [DOI] [PMC free article] [PubMed] [Google Scholar]
- 18. Chiara F, Castellaro D, Marin O, Petronilli V, Brusilow WS, Juhaszova M, Sollott SJ, Forte M, Bernardi P, Rasola A (2008) Hexokinase II detachment from mitochondria triggers apoptosis through the permeability transition pore independent of voltage‐dependent anion channels. PLoS ONE 3: e1852 [DOI] [PMC free article] [PubMed] [Google Scholar]
- 19. Masgras I, Rasola A, Bernardi P (2012) Induction of the permeability transition pore in cells depleted of mitochondrial DNA. Biochim Biophys Acta 1817: 1860–1866 [DOI] [PubMed] [Google Scholar]
- 20. Cieri D, Vicario M, Giacomello M, Vallese F, Filadi R, Wagner T, Pozzan T, Pizzo P, Scorrano L, Brini M et al (2018) SPLICS: a split green fluorescent protein‐based contact site sensor for narrow and wide heterotypic organelle juxtaposition. Cell Death Differ 25: 1131–1145 [DOI] [PMC free article] [PubMed] [Google Scholar]
- 21. Csordas G, Weaver D, Hajnoczky G (2018) Endoplasmic reticulum‐mitochondrial contactology: structure and signaling functions. Trends Cell Biol 28: 523–540 [DOI] [PMC free article] [PubMed] [Google Scholar]
- 22. Prudent J, McBride HM (2017) The mitochondria‐endoplasmic reticulum contact sites: a signalling platform for cell death. Curr Opin Cell Biol 47: 52–63 [DOI] [PubMed] [Google Scholar]
- 23. Rieusset J (2018) The role of endoplasmic reticulum‐mitochondria contact sites in the control of glucose homeostasis: an update. Cell Death Dis 9: 388 [DOI] [PMC free article] [PubMed] [Google Scholar]
- 24. Filadi R, Theurey P, Pizzo P (2017) The endoplasmic reticulum‐mitochondria coupling in health and disease: molecules, functions and significance. Cell Calcium 62: 1–15 [DOI] [PubMed] [Google Scholar]
- 25. Olson ES, Aguilera TA, Jiang T, Ellies LG, Nguyen QT, Wong EH, Gross LA, Tsien RY (2009) In vivo characterization of activatable cell penetrating peptides for targeting protease activity in cancer. Integr Biol 1: 382–393 [DOI] [PMC free article] [PubMed] [Google Scholar]
- 26. Isaacson KJ, Martin Jensen M, Subrahmanyam NB, Ghandehari H (2017) Matrix‐metalloproteinases as targets for controlled delivery in cancer: an analysis of upregulation and expression. J Control Release 259: 62–75 [DOI] [PMC free article] [PubMed] [Google Scholar]
- 27. Rebecchi MJ, Pentyala SN (2000) Structure, function, and control of phosphoinositide‐specific phospholipase C. Physiol Rev 80: 1291–1335 [DOI] [PubMed] [Google Scholar]
- 28. Horowitz LF, Hirdes W, Suh BC, Hilgemann DW, Mackie K, Hille B (2005) Phospholipase C in living cells: activation, inhibition, Ca2+ requirement, and regulation of M current. J Gen Physiol 126: 243–262 [DOI] [PMC free article] [PubMed] [Google Scholar]
- 29. Cannino G, Ciscato F, Masgras I, Sanchez‐Martin C, Rasola A (2018) Metabolic plasticity of tumor cell mitochondria. Front Oncol 8: 333 [DOI] [PMC free article] [PubMed] [Google Scholar]
- 30. Berridge MJ, Bootman MD, Roderick HL (2003) Calcium signalling: dynamics, homeostasis and remodelling. Nat Rev Mol Cell Biol 4: 517–529 [DOI] [PubMed] [Google Scholar]
- 31. Rasola A, Bernardi P (2011) Mitochondrial permeability transition in Ca(2 + )‐dependent apoptosis and necrosis. Cell Calcium 50: 222–233 [DOI] [PubMed] [Google Scholar]
- 32. Rasola A, Bernardi P (2014) The mitochondrial permeability transition pore and its adaptive responses in tumor cells. Cell Calcium 56: 437–445 [DOI] [PMC free article] [PubMed] [Google Scholar]
- 33. Bernardi P, Rasola A, Forte M, Lippe G (2015) The mitochondrial permeability transition pore: channel formation by F‐ATP synthase, integration in signal transduction, and role in pathophysiology. Physiol Rev 95: 1111–1155 [DOI] [PMC free article] [PubMed] [Google Scholar]
- 34. Storr SJ, Carragher NO, Frame MC, Parr T, Martin SG (2011) The calpain system and cancer. Nat Rev Cancer 11: 364–374 [DOI] [PubMed] [Google Scholar]
- 35. Fabbri G, Dalla‐Favera R (2016) The molecular pathogenesis of chronic lymphocytic leukaemia. Nat Rev Cancer 16: 145–162 [DOI] [PubMed] [Google Scholar]
- 36. Gu JJ, Singh A, Xue K, Mavis C, Barth M, Yanamadala V, Lenz P, Grau M, Lenz G, Czuczman MS et al (2018) Up‐regulation of hexokinase II contributes to rituximab‐chemotherapy resistance and is a clinically relevant target for therapeutic development. Oncotarget 9: 4020–4033 [DOI] [PMC free article] [PubMed] [Google Scholar]
- 37. Martini V, Gattazzo C, Frezzato F, Trimarco V, Pizzi M, Chiodin G, Severin F, Scomazzon E, Guzzardo V, Saraggi D et al (2017) Cortactin, a Lyn substrate, is a checkpoint molecule at the intersection of BCR and CXCR4 signalling pathway in chronic lymphocytic leukaemia cells. Br J Haematol 178: 81–93 [DOI] [PubMed] [Google Scholar]
- 38. Lee HJ, Li CF, Ruan D, He J, Montal ED, Lorenz S, Girnun GD, Chan CH (2019) Non‐proteolytic ubiquitination of Hexokinase 2 by HectH9 controls tumor metabolism and cancer stem cell expansion. Nat Commun 10: 2625 [DOI] [PMC free article] [PubMed] [Google Scholar]
- 39. Raucher D, Ryu JS (2015) Cell‐penetrating peptides: strategies for anticancer treatment. Trends Mol Med 21: 560–570 [DOI] [PubMed] [Google Scholar]
- 40. Pizzi M, Agostinelli C, Righi S, Gazzola A, Mannu C, Galuppini F, Fassan M, Visentin A, Piazza F, Semenzato GC et al (2017) Aberrant expression of CD10 and BCL6 in mantle cell lymphoma. Histopathology 71: 769–777 [DOI] [PubMed] [Google Scholar]
- 41. Filadi R, Leal NS, Schreiner B, Rossi A, Dentoni G, Pinho CM, Wiehager B, Cieri D, Cali Pizzo P et al (2018) TOM70 sustains cell bioenergetics by promoting IP3R3‐mediated ER to mitochondria Ca(2+) transfer. Curr Biol 28: 369–382 e366 [DOI] [PubMed] [Google Scholar]
- 42. Fedeli C, Filadi R, Rossi A, Mammucari C, Pizzo P (2019) PSEN2 (presenilin 2) mutants linked to familial Alzheimer disease impair autophagy by altering Ca(2+) homeostasis. Autophagy 15: 2044–2206 [DOI] [PMC free article] [PubMed] [Google Scholar]
- 43. Hirose K, Kadowaki S, Tanabe M, Takeshima H, Iino M (1999) Spatiotemporal dynamics of inositol 1,4,5‐trisphosphate that underlies complex Ca2 + mobilization patterns. Science 284: 1527–1530 [DOI] [PubMed] [Google Scholar]
- 44. Frezzato F, Trimarco V, Martini V, Gattazzo C, Ave E, Visentin A, Cabrelle A, Olivieri V, Zambello R, Facco M et al (2014) Leukaemic cells from chronic lymphocytic leukaemia patients undergo apoptosis following microtubule depolymerization and Lyn inhibition by nocodazole. Br J Haematol 165: 659–672 [DOI] [PubMed] [Google Scholar]
- 45. Masgras I, Ciscato F, Brunati AM, Tibaldi E, Indraccolo S, Curtarello M, Chiara F, Cannino G, Papaleo E, Lambrughi M et al (2017) Absence of neurofibromin induces an oncogenic metabolic switch via mitochondrial ERK‐mediated phosphorylation of the chaperone TRAP1. Cell Rep 18: 659–672 [DOI] [PubMed] [Google Scholar]
- 46. De Smet P, Parys JB, Callewaert G, Weidema AF, Hill E, De Smedt H, Erneux C, Sorrentino V, Missiaen L (1999) Xestospongin C is an equally potent inhibitor of the inositol 1,4,5‐trisphosphate receptor and the endoplasmic‐reticulum Ca(2+) pumps. Cell Calcium 26: 9–13 [DOI] [PubMed] [Google Scholar]
Associated Data
This section collects any data citations, data availability statements, or supplementary materials included in this article.
Supplementary Materials
Expanded View Figures PDF
Movie EV1
Movie EV2
Movie EV3
Movie EV4
Movie EV5
Movie EV6
Movie EV7
Movie EV8
Movie EV9
Review Process File


