Abstract
Background
G protein-coupled receptors (GPCRs) are involved in several signaling pathways. However, the roles of many GPCRs in tumor oncogenesis and progression are not fully understood. In our previous study, we concluded that the absence of Gpr110 decelerates the development of liver brosis/cirrhosis into tumorigenesis. In our current study, the role of GPR110 in the oncogenesis and progression of lung cancer was observed.
Methods
After collecting tumor tissues from lung cancer patients, the expression of GPR110 was analyzed by both Western blotting and real-time PCR. Immunofluorescence was used to observe GPR110 expression in human lung cancer cells. A CCK8 kit was used to analyze the proliferation of human lung cancer cells transfected with Gpr110. Changes in cell migration were evaluated with wound healing and Transwell assays. A nude mouse xenograft model was constructed. Lung cancer model was induced in Gpr110-/- mice with urethane.
Results
GPR110 mRNA and protein expression was significantly higher in lung cancer tissue. GPR110 was barely expressed in H460, A549, H1299, and SPC-A1 cells, but its expression in PC-9 and QG56 cells was significantly higher. Overexpression of GPR110 promoted the proliferation and cell aggregation of H1299 cells and H1299 cell migration was also enhanced. Overexpression of GPR110 in H1299 cells significantly promoted tumor development in the nude mice tumor xenograft model. There was no statistical significance between the Gpr110+/+ and Gpr110-/- mice despite the lesions in the Gpr110-/- mice group decreasing at 35 and 40 weeks after the initial injection of urethane.
Conclusions
Our findings indicate that GPR110 promotes the progression of lung cancer through accelerating cell proliferation and migration.
Keywords: Gpr110, lung cancer, urethane, Xenograft model
Introduction
G protein-coupled receptors (GPCRs) is a term applied to a group of more than 1,000 receptors that are signally linked to the G protein (guanosine triphosphate-binding protein) family (1). As membrane proteins, GPCRs are distributed on the cell membrane (2). GPCRs receive and transmit extracellular signals to within the cell by activating different types of G proteins and their downstream signaling pathways, causing changes in cell status.
GPCRs are made up of a polypeptide chain that spans the cell membrane (3-5). The C-terminus of the polypeptide chain and the intracellular loop of the fifth and sixth transmembrane helices (numbered from the N-terminus of the polypeptide chain) are binding sites for the G protein. The extracellular portion of the receptor is the binding site for various molecules. The G protein contains three subunits, α, β, and γ. It straddles the cell membrane and can receive signals from the outside the cell. Through its interaction with intracellular substances, the G protein acts as a bridge for extracellular information to enter the cell.
Currently, our understanding of many GPCRs is very limited, mainly due to how many there are. One example is G protein-coupled receptor 110 (GPR110), which is also known as adhesion G protein-coupled receptor F1 (ADGRF1) (6). The oncogenesis-related activity of GPR110 was initially reported in 2010 (7). However, ten years later, little progress has been made on the biological function of GPR110 and its role in tumorigenesis and cancer progression. In previous study, we constructed a Gpr110-/- mouse model and determined the role of Gpr110 in hepatocarcinogenesis. Our findings confirmed that when Gpr110 is absent, the development of liver brosis/cirrhosis into tumorigenesis is decelerated (8). To achieve a greater understanding of the role of GPR110 in lung cancer oncogenesis and progression, we collected tumor tissue from lung cancer patients. GPR110 in these samples was analyzed, and the role of GPR110 in lung cancer progression was considered in vitro and in vivo. We present the following article in accordance with the ARRIVE reporting checklist (available at http://dx.doi.org/10.21037/atm-20-3146).
Methods
Patients and specimen collection
Lung cancer tissues from 40 patients at the Department of Thoracic Surgery, Shanghai Pulmonary Hospital were obtained for analysis, including 15 patients with squamous cell carcinoma, 14 patients with adenocarcinoma, 6 patients with large cell carcinoma, 5 patients with adenosquamous carcinoma. None of the patients had received anticancer therapy prior to the surgical procedure. Each patient was confirmed with lung cancer by pathological analysis.
Western blot analysis
Western blot was performed following the routine protocol. H1299 cells were lysed in RIPA buffer (50 mM Tris, pH 7.4, 150 mM NaCl, 5 mM EDTA, pH 8.0, 30 mM NaF, 1 mM Na3VO4, 40 mM β-glycerophosphate, 0.1 mM PMSF, 10% glycerol and 1% Nonidet-P40) and equal total protein of cell lysates from each condition were resolved by 15% SDS-PAGE followed by immunoblotting. The primary antibodies were as the following: anti-GFP (ab183734, Abcam, MA, USA), 1:10,000; anti-GAPDH (ab125247, Abcam, MA, USA).
Real-time PCR
Trizol reagent (Thermo Fisher Scientific) was used to extract total RNA based on the instructions of the manufacturer. Total RNA was quantified with NanoDrop 1000 (Nanodrop, Wilmington, DE, USA). The TAKARA Reverse Transcription kit-PrimeScript™ RT Master Mix (Takara, Dalian, China) was used to perform reverse transcription reaction with 500 ng of the total RNA. The expression of GPR110 on mRNA level was determined by QPCR with SYBR® qPCR Mix (Takara, Dalian, China) and the ABI 7500 Real-Time PCR System (Applied Biosystems, Thermo Fisher Scientific, New York, USA). The PCR conditions were as follow: step 1: pre-denaturation: 95 °C for 30 seconds, step 2: repeat for 40 times, denaturation at 95 °C for 15 seconds, annealing at 60 °C for 30 seconds, step 3: dissociation. The expression of specific transcripts was normalized against GAPDH, the entire experiment was performed in triplicate. Primers used were: GPR110 (forward: 5'-ACGCAACCTAGCAATACC-3', reverse: 5'-AGCAGCACCACAACGAA-3'), GAPDH (forward: 5'-TGGTATCGTGGAAGGACTCATGAC-3', reverse: 5'-ATGCCAGTGAGCTTCCCGTTCAGC-3').
Construction of GPR110 overexpression vector
The Coding sequence (CDS) of human GPR110 gene was cloned in vitro by polymerase chain reaction (PCR) method and connected to the linear PEGFR-N2 vector for constructing PEGFR-N2-GPR110 eukaryotic expression plasmid by homologous recombination technology. The plasmid was identified by sequencing. After identification, it was transfected into H1299 cells and its expression was detected at 48 h. The primers for PCR cloning and connection were: for cloning GPR110 gene CDS region (forward: 5'-ACGCAACCTAGCAATACC-3', reverse: 5'-AGCAGCACCACAACGAA-3'); for connection [forward (including NotI restriction site): 5'-ATAAGAATGCGGCCGCGATGAAAGTTG-3' reverse (including XbaI restriction site): 5'-GCTCTAGATTATTCATTTGAGACAAA-3'].
Cell migration assay
Wound healing and Transwell assays were used to analyze cell migration. For the wound healing assay, at least 5 horizontal lines (interval, 0.5 cm) were evenly drawn with a marker pen behind the 6-well plate. Then, 2×10⁵ cells were added to the wells. The following day, the tip was hung down to the horizontal line and a scratch was made. The cells were washed 3 times with PBS, and then cultured in a 37 °C 5% CO2 incubator with serum-free medium. After 24 h, photographs of the cells were taken. The migration distance of cells was measured with Image-Pro Plus software. All experiments were conducted independently in triplicate. For Transwell assay, the H1299 cells (1×10⁴ cells) were seeded with serum-free DMEM medium in the plate’s upper chamber, and the bottom chamber was filled with complete DMEM medium before incubation at 37 °C for 24 h. The Transwell membrane was fixed, stained, and subsequently photographed with an Olympus light microscope. The cells were then counted. The experiment was independently conducted in triplicate.
Immunohistochemical (IHC) staining
IHC staining was performed after the tissue sections were prepared. The tissue slides were incubated with primary antibody at 4 °C overnight, and again with secondary antibody at room temperature for 1 h. After DAB staining, counterstaining was carried out using hematoxylin, and the results were determined by OLYMPUS optical microscopy. Photographs were taken and evaluated by three pathologists. The primary antibodies were as the following: anti-GPR110 (ab150547, Abcam, MA, USA, 1:200), anti-Ki-67 (#9027, Cell Signaling Technology, MA, USA, 1:400).
Immunofluorescence
The sterile slides were placed in a 6-well cell culture plate and seeded with QG56, H1299, H460, A549, PC-9, and SPC-A1 cells. After 24 h, the slides were immersed in PBS (3 times for 3 min each time), and fixing with 4% paraformaldehyde took place for 15 min, following PBS washing (3 times for 3 min each time). Then, 0.5% Triton X-100 was permeabilized at room temperature for 20 min, and the slides were once again immersed in PBS (3 times for 3 min each time). Drops of goat serum were added to each slide and blocking was carried out at room temperature for 30 min. The primary antibody was added to each slide, and the slides were placed in a wet box for incubation at 4 °C overnight. The slides were incubated in the wet box with the fluorescent secondary antibody for 1 h at 37 °C. After PBST washing, DAPI was added for 5 min. The plate was then sealed with a sealing liquid containing an anti-fluorescence quencher, and the image was observed under a fluorescence microscope. The primary antibodies were as the following: anti-GPR110 (ab75306, Abcam, MA, USA, 1:200), anti-GFP (ab183734, Abcam, MA, USA, 1:500).
Cell proliferation and cell aggregation
A 96-well was seeded with H1299 cells (2×10³). Cell growth was determined by the CCK8 kit. For cell aggregation assay, 1×10⁵ single H1299 cells were resuspended in 500 µL of serum-free medium, before the suspension was placed in a 1.5 mL centrifuge tube. At 37 °C, the cells were vibrated at 80 rpm for 1 h, after cell aggregation occurred, the cells were fixed with 2% (v/v) glutaraldehyde. Pictures were then taken under the microscope.
Xenograft model
All of the animal experiments in this study received approval from the Animal Care and Use Committee of Shanghai Jiao Tong University School of Medicine.
Nude mice were purchased from Shanghai South Model Biotechnology Co., Ltd. Six-week-old male nude mice (BALB/c) were kept (six per cage) in a specific pathogen-free room on a 12-hr light/dark schedule at 25±1 °C, the body weight of nude mice were about 18–20 g. The mice were fed an autoclaved chow diet and had free access to water. We used 12 nude mice for the experiment, prior to being inoculated, the mice were divided at random into two groups (6 mice per group). H1299 cells with GPR110 overexpression and with vector were subcutaneously injected into the mice separately to form the subcutaneous model, 6 mice per group. Tumor growth was monitored with vernier caliper every 4 days. After 4 weeks, the mice were sacrificed. The tumors were stripped from the mouse subcutaneously. The tumors were fixed with paraform aldehyde (4%) before they were dehydrated and embedded in paraffin. H&E and Ki-67 immunohistochemistry staining of the paraffinized tissue sections were conducted according to standard protocols. No adverse events in the entire animal experiment.
Urethane-induced lung cancer in Gpr110-/- mice
In this study, we constructed a Gpr110-/- mouse model. Mice with a homozygous deletion of Gpr110 were maintained on a 129SvJ background. The construction of the Gpr110-/- mouse model was reported in 2017 (8). Briefly, the targeting vector was designed to delete exon 12 to exon 14 of the Gpr110 gene. The targeting vector contained a 5.0 kb 5’ arm and a 4.2 kb 3’ arm. PGK-Neo and HSV-TK cassettes were used for positive and negative selections, respectively. Four-week-old Gpr110-/- mice and wild type mice were selected and administered an intraperitoneal injection of urethane (200 mg/kg) twice a week for four weeks. Forty mice per group, half male and female. The samples were harvested at 18, 35, 40, and 56 weeks after the first injection. No adverse events in the entire animal experiment.
Statistical analysis
Values presented are expressed as mean ± SD. The χ2 test was used to compare qualitative variables; and quantitative variables were analyzed by the t-test, Analysis was performed with the SPSS Version 18.0 software package for Windows (Chicago, IL, USA). All statistical tests were two-sided, and P<0.05 was considered to represent statistical significance.
Results
Expression of GPR110 in human lung cancer tissues
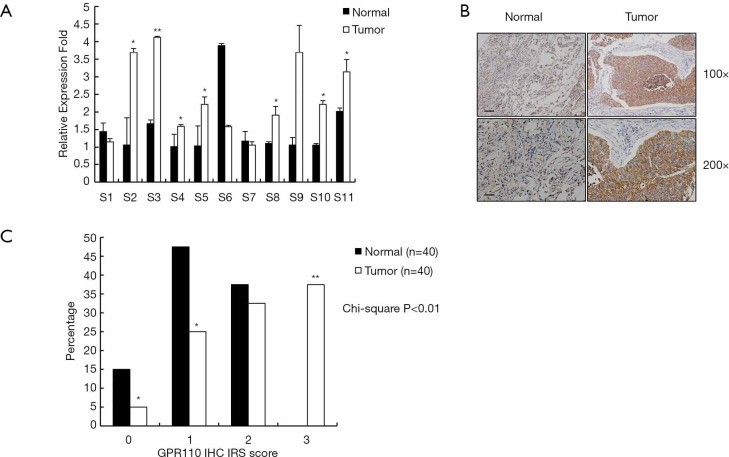
The relative expression of GPR110 mRNA in 11 human lung cancer samples was determined by QPCR assay. The expression of GPR110 mRNA in the lung cancer tissues was significantly higher than in the normal tissues (Figure 1A). By IHC staining, the expression of GPR110 at the protein level was also determined. The results showed that GPR110 protein expression in the lung cancer tissues was significantly higher than in the normal tissues. The GPR110 high expression ratio was 62.5% (25/40) (Figure 1B,C).
Figure 1.
GPR110 expression in human lung cancer tissues. (A) GPR110 mRNA levels in 11 lung cancer patients. Values are presented as mean ± SD. *, P<0.05; **, P<0.01. (B) GPR110 in a lung cancer patient, detected by immunohistochemistry. Scale bar, 100 µm, upper picture; scale bar, 50 µm, lower picture. (C) GPR110 expression scores in lung cancer and adjacent normal tissues. *, P<0.05; **, P<0.01.
GPR110 expression in human lung cancer cell lines
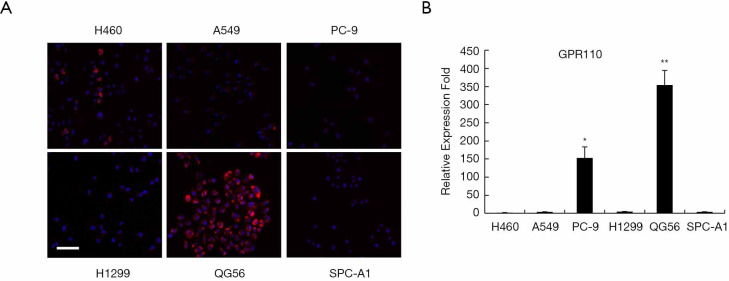
Next, we determined the expression of GPR110 in human lung cancer cell line H460 (with p16 gene deletion), human lung adenocarcinoma cell line A549 (with KRAS mutation), human lung adenocarcinoma cell line PC-9 (with exon 19 deletion mutation), human lung adenocarcinoma cell line H1299 (with p53 gene deletion), human lung squamous cell carcinoma cell line QG56, and human lung adenocarcinoma cell line SPC-A1. GPR110 was barely expressed in the H460, A549, H1299, and SPC-A1 cells, but its expression was significantly higher in the PC-9 and QG56 cells (Figure 2).
Figure 2.
The expression of GPR110 in human lung cancer cell lines. (A) GPR110 in 6 lung cancer cell lines, detected by immunofluorescence staining (200×), scale bar, 50 µm. (B) GPR110 mRNA levels in 6 lung cancer cell lines. Values are presented as mean ± SD. *, P<0.05; **, P 0.01.
Overexpression of GPR110 promoted the proliferation and cell aggregation of H1299 cells
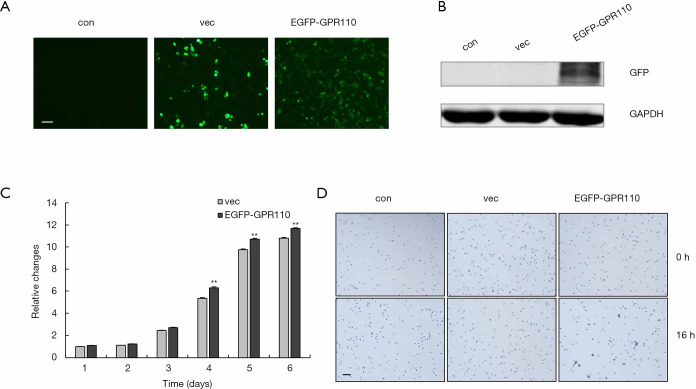
To analyze the role of GPR110 in lung cancer progression, we selected H1299 cells which had very low GPR110 background expression as a model. We constructed the GPR110 expression vector and, after verifying the expression efficiency, it was transfected into the H1299 cells (Figure 3A,B). We observed cell behavior for 6 consecutive days and observed overexpression of GPR110 to significantly promote the H1299 cell proliferation (Figure 3C). Cell aggregation is a biological feature of tumor cells; therefore, we also measured the effect of GPR110 on lung cancer cell aggregation. Compared with the control group, the H1299 cells with GPR110 overexpression showed obvious aggregation after 16 hours of GPR110 transfection (Figure 3D).
Figure 3.
GPR110 promoted the proliferation and aggregation of H1299 cells. (A) GPR110 vector expression in H1299 cells observed by immunofluorescence (100×), scale bar, 100 µm. (B) The verification of vector expression efficiency by Western blotting assay. (C) The growth curve of H1299 cells with and without GPR110 transfection. Data are shown as mean (± SD) from three independent experiments, **, P<0.01. (D) H1299 cells with and without GPR110 transfection observed by cell aggregation assay (40×), scale bar, 200 µm.
Overexpression of GPR110 enhanced the migration of H1299 cells
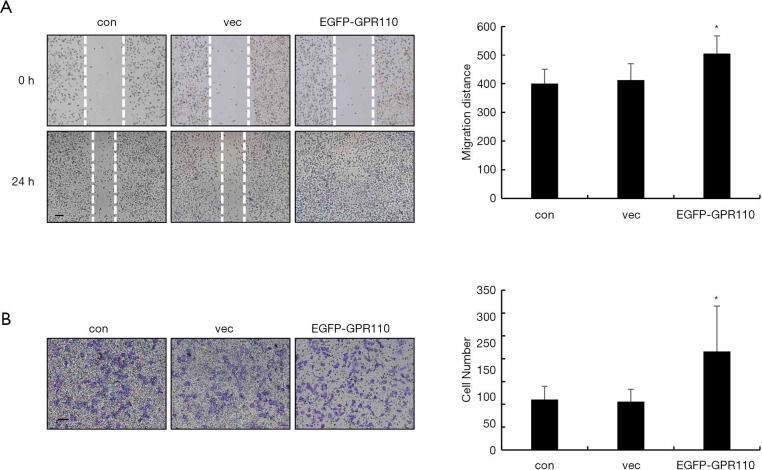
Tumor metastasis is initiated by cell migration and invasion. Therefore, we next analyzed the effect of GPR110 on the lung cancer cell migration. We evaluated changes in cell migration ability using the wound healing and Transwell assays, respectively. Within 48 h, the gap in H1299 cells with overexpressed levels of GPR110 disappeared, while the gap in the control cells only narrowed by half within the same amount of time (Figure 4A). In another experiment, a comparison of the number of cells migrating through the Transwell pores revealed that overexpression of GPR110 had a doubling effect on the number of H1299 cells that migrated (Figure 4B).
Figure 4.
The effect of GPR110 on H1299 cell migration. (A) Wound healing assay analysis of cell migration ability (100×), scale bar, 100 µm; migration distance was measured. Data are shown as mean (± SD) from three independent experiments. *, P<0.05. (B) Transwell assay analysis of cell migration ability (100×), scale bar, 100 µm; the number of cells that had penetrated the membrane was counted. Data are shown as mean (± SD) from three independent experiments. *, P<0.05.
Overexpression of GPR110 in H1299 cells significantly promoted tumor growth in the nude mice tumor xenograft model
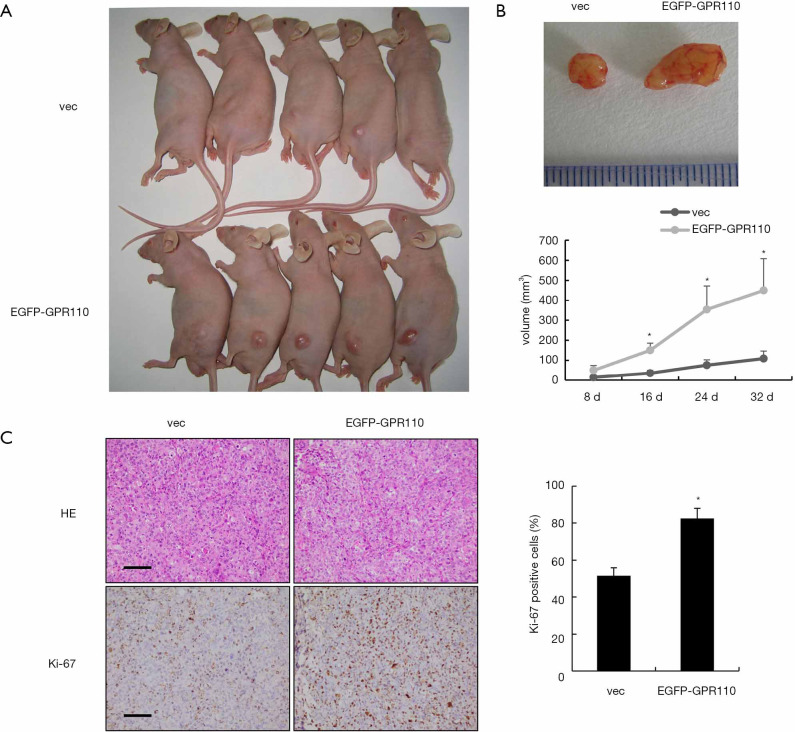
We constructed a Xenograft model to determine whether GPR110 can accelerate the tumorigenic effect of H1299 cells in vivo. Tumor growth was monitored every 4 days. A month later, we found that the tumor tissue masses stemming from the H1299 cells with GPR110 overexpression were larger than those in the control group (Figure 5A). The total tumor volume in the group with GPR110 overexpression was higher than in the control group (Figure 5B). By detecting Ki-67 expression in the tumor tissue, we also found that GPR110 overexpression significantly promoted the proliferation of H1299 cells in vivo (Figure 5C).
Figure 5.
GPR110 overexpression in H1299 cells significantly promoted tumor growth in the nude mice tumor xenograft model. (A) Representative photographs of the nude mice tumor xenograft, showing the mice subcutaneously injected with H1299 cells with GPR110 overexpression (n=6) and the control group (n=6). (B) Tumor nodules extracted from the nude mice tumor xenograft model: vaccinal tumor tissue masses from mice subcutaneously injected with H1299 cells with GPR110 overexpression and the control group. Tumor volume was quantified and statistical analysis was carried out. The values are presented as mean ± SD. *, P<0.05. (C) H&E staining of tumor sections and immunohistochemical staining of Ki-67 in the tumor area (200×), scale bar, 50 µm. *, P<0.05.
The role of Gpr110 in urethane induced mice lung cancer
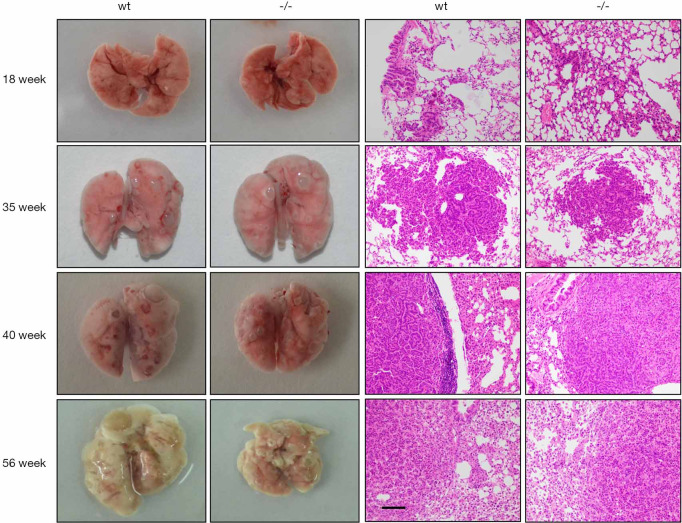
Due to the lack of the necessary microenvironment, a molecule’s biological function is not always fully reflected in the results of in vitro cell experiments. In our previous study, we determined the expression of Gpr110 in multiple tissues from mice, and almost no Gpr110 expression was detected in lung tissue. To maximize the simulation of the lung cancer oncogenesis and progression, we induced lung cancer in Gpr110-/- mice with urethane. We observed the number and the volume of the lesions on the lung of two groups mice at 18, 35, 40, and 56 weeks after the first injection of urethane, we found that the number and the volume of lesions that had formed on the lung of the two groups of mice was comparable at 18 and 35 weeks. However, in the Gpr110-/- mice group the number of lesions were not significantly different between the two groups mice. Then we fixed the lung of mice with paraform aldehyde (4%) before they were dehydrated and embedded in paraffin. H&E and of the paraffinized tissue sections were conducted according to standard protocols. H&E staining showed that the pathological manifestations of the lesions between two groups is similar. Ki-67 Immunohistochemistry staining showed that the proliferation of tumor cells was not significantly different between the two groups of mice (Figure 6).
Figure 6.
The urethane-induced lung cancer in Gpr110−/− mice. Representative photographs of the cancer lesions in the Gpr110+/+ and Gpr110−/− mice, and HE staining of the tumor tissue (200×), scale bar, 50 µm.
Discussion
GPR110 is a member of the adhesion GPCR family, a group of GPCRs characterized by their relatively long N terminus (9,10). Based on the GRAFS classification system, there are five subfamilies of GPCR: glutamate, rhodopsin, adhesion, frizzled/taste2, and secretin. The characteristic difference between the adhesion subfamily and the others is that some functional domains are located in the long N terminus; however, the biological function of adhesion GPCRs is still barely known. At present, because GPR110 is highly expressed in many tumors, it is primarily understood to be an oncogene (11-15), and our results refined this conclusion.
Through the analysis of different genotype samples and human cell lines, we discovered that the expression of GPR110 was specifically increased in human lung squamous cell carcinoma cell line QG56, which indicate that GPR110 especially plays an important role in the development of this pathological type of lung cancer. Our results also showed the behavior of GPR110 in promoting the proliferation and migration of lung cancer cells, which suggest that GPR110 may be involved in signaling pathways related to cell proliferation and migration, this requires a lot of research work on molecular mechanisms. In our nude mouse tumor xenograft model, tumor growth was significantly promoted by GPR110 overexpression in H1299 cells. Nevertheless, there was no significant difference between the Gpr110+/+ and Gpr110-/- mice when lung cancer was induced with urethane, although this may be attributed to an inappropriate dose and low expression of GPR110 in normal mouse lung tissue.
The G protein takes its name from its close association with guanosine triphosphate (GTP) and guanosine diphosphate (GDP). In its inactivated state, GDP binds to the α subunit and the GPCRs migrate across the inner surface of the cell membrane. When the G protein meets the corresponding receptor, the receptor binds to the corresponding signal molecule, and the G protein releases GDP and binds to GTP in the cytosol. After binding to GTP, the G-activated protein further breaks down into two parts, both of which continue to activate downstream effector proteins. The enzyme-activated substance in the cell can convert the α subunit-linked GTP into GDP, thereby terminating its activity. When the inactive α subunit rejoins the beta and gamma subunits, it forms a G protein complex and a new cycle begins. The high expression of GPR110 in lung cancer tissue not only promotes the proliferation of human lung cancer cells but also elevates the ability of lung cancer cells to migrate, and in turn contributes to lung cancer progression. GPCRs are important drug-targeting molecules which oversee the regulation of most cellular responses to drugs and hormones (16,17). Currently, at least 30% of marketed drugs can activate or block GPCR activity. Therefore, our findings indicate that GPR110 might also provide a potential target for managing the progression of lung cancer. This requires our further research on the molecular mechanism of GPR110 regulating lung cancer development.
Conclusions
Our findings indicate that GPR110 promotes the progression of lung cancer and that GPR110 may present a target for anti-lung cancer treatment.
Supplementary
The article’s supplementary files as
Acknowledgments
Funding: This work was supported by National Natural Science Foundation of China (81502383). Shanghai Municipal Key Clinical Specialty (shslczdzk01302). Foundation of Shanghai Pulmonary Hospital (fk1911).
Ethical Statement: The authors are accountable for all aspects of the work in ensuring that questions related to the accuracy or integrity of any part of the work are appropriately investigated and resolved. The study was approved by Medical and Life Science Ethics Committee of Tongji University (2015yxy43). All of the animal experiments in this study received approval from the Animal Care and Use Committee of Shanghai Jiao Tong University School of Medicine.
Footnotes
Reporting Checklist: The authors have completed the ARRIVE reporting checklist. Available at http://dx.doi.org/10.21037/atm-20-3146
Data Sharing Statement: Available at http://dx.doi.org/10.21037/atm-20-3146
Conflicts of Interest: All authors have completed the ICMJE uniform disclosure form (available at http://dx.doi.org/10.21037/atm-20-3146). The authors have no conflicts of interest to declare.
References
- 1.Weis WI, Kobilka BK. The Molecular Basis of G Protein-Coupled Receptor Activation. Annu Rev Biochem 2018;87:897-919. 10.1146/annurev-biochem-060614-033910 [DOI] [PMC free article] [PubMed] [Google Scholar]
- 2.Manglik A, Kruse AC. Structural Basis for G Protein-Coupled Receptor Activation. Biochemistry 2017;56:5628-34. 10.1021/acs.biochem.7b00747 [DOI] [PMC free article] [PubMed] [Google Scholar]
- 3.Coleman JL, Ngo T, Smith NJ. The G protein-coupled receptor N-terminus and receptor signalling: N-tering a new era. Cell Signal 2017;33:1-9. 10.1016/j.cellsig.2017.02.004 [DOI] [PubMed] [Google Scholar]
- 4.Thal DM, Glukhova A, Sexton PM, et al. Structural insights into G-protein-coupled receptor allostery. Nature 2018;559:45-53. 10.1038/s41586-018-0259-z [DOI] [PubMed] [Google Scholar]
- 5.Yen HY, Hopper JTS, Liko I, et al. Ligand binding to a G protein-coupled receptor captured in a mass spectrometer. Sci Adv 2017;3:e1701016. 10.1126/sciadv.1701016 [DOI] [PMC free article] [PubMed] [Google Scholar]
- 6.Fredriksson R, Lagerström MC, Höglund PJ, et al. Novel human G protein-coupled receptors with long N-terminals containing GPS domains and Ser/Thr-rich regions. FEBS Lett 2002;531:407-14. 10.1016/S0014-5793(02)03574-3 [DOI] [PubMed] [Google Scholar]
- 7.Lum AM, Wang BB, Beck-Engeser GB, et al. Orphan receptor GPR110, an oncogene overexpressed in lung and prostate cancer. BMC Cancer 2010;10:40. 10.1186/1471-2407-10-40 [DOI] [PMC free article] [PubMed] [Google Scholar]
- 8.Ma B, Zhu J, Tan J, et al. Gpr110 deficiency decelerates carcinogen-induced hepatocarcinogenesis via activation of the IL-6/STAT3 pathway. Am J Cancer Res 2017;7:433-47. [PMC free article] [PubMed] [Google Scholar]
- 9.Bjarnadóttir TK, Geirardsdóttir K, Ingemansson M, et al. Identification of novel splice variants of Adhesion G protein-coupled receptors. Gene 2007;387:38-48. 10.1016/j.gene.2006.07.039 [DOI] [PubMed] [Google Scholar]
- 10.Lee JW, Huang BX, Kwon H, et al. Orphan GPR110 (ADGRF1) targeted by N-docosahexaenoylethanolamine in development of neurons and cognitive function. Nat Commun 2016;7:13123. 10.1038/ncomms13123 [DOI] [PMC free article] [PubMed] [Google Scholar]
- 11.Shi H, Zhang S. Expression and prognostic role of orphan receptor GPR110 in glioma. Biochem Biophys Res Commun 2017;491:349-354. 10.1016/j.bbrc.2017.07.097 [DOI] [PubMed] [Google Scholar]
- 12.Liu Z, Zhang G, Zhao C, et al. Clinical Significance of G Protein-Coupled Receptor 110 (GPR110) as a Novel Prognostic Biomarker in Osteosarcoma. Med Sci Monit 2018;24:5216-24. 10.12659/MSM.909555 [DOI] [PMC free article] [PubMed] [Google Scholar]
- 13.Bhat RR, Yadav P, Sahay D, et al. GPCRs profiling and identification of GPR110 as a potential new target in HER2+ breast cancer. Breast Cancer Res Treat 2018;170:279-92. 10.1007/s10549-018-4751-9 [DOI] [PMC free article] [PubMed] [Google Scholar]
- 14.Zhu X, Huang G, Jin P. Clinicopathological and prognostic significance of aberrant G protein-couple receptor 110 (GPR110) expression in gastric cancer. Pathol Res Pract 2019;215:539-45. 10.1016/j.prp.2018.12.004 [DOI] [PubMed] [Google Scholar]
- 15.Sadras T, Heatley SL, Kok CH, et al. Differential expression of MUC4, GPR110 and IL2RA defines two groups of CRLF2-rearranged acute lymphoblastic leukemia patients with distinct secondary lesions. Cancer Lett 2017;408:92-101. 10.1016/j.canlet.2017.08.034 [DOI] [PubMed] [Google Scholar]
- 16.Purcell RH, Hall RA, Adhesion G. Protein-Coupled Receptors as Drug Targets. Annu Rev Pharmacol Toxicol 2018;58:429-49. 10.1146/annurev-pharmtox-010617-052933 [DOI] [PMC free article] [PubMed] [Google Scholar]
- 17.Miao Y, McCammon JA. G-protein coupled receptors: advances in simulation and drug discovery. Curr Opin Struct Biol 2016;41:83-9. 10.1016/j.sbi.2016.06.008 [DOI] [PMC free article] [PubMed] [Google Scholar]
Associated Data
This section collects any data citations, data availability statements, or supplementary materials included in this article.
Supplementary Materials
The article’s supplementary files as


