Abstract
Background
With the increase in incidence and mortality of endometrial cancer (EC), there is an urgent need to explore non-invasive strategies for identifying EC patients and facilitating risk stratification. The alteration of immunoglobulin G (IgG) N-glycome has been indicated in autoimmune diseases and several cancer types, demonstrating a significant association with disease pathogenesis and progression. However, little has been investigated in the IgG N-glycome of EC patients.
Methods
A total of 94 EC patients and 112 healthy females were recruited and sorted into an EC cohort and a control cohort. Serum samples were obtained from every participant, and IgG N-glycome profiling was conducted using ultra-performance liquid chromatography (UPLC).
Results
A total of 24 directly measured N-glycans and 11 derived traits based on the shared glycan structures were analyzed in the EC and control cohorts. We detected a significant downregulation of galactosylation and sialylation in the EC cohort compared with the control cohort, while glycans with bisecting N-acetylglucosamine (GlcNAc) were elevated in EC patients. Receiver operating characteristic (ROC) analysis based on glycan traits showed good diagnostic performance of IgG N-glycans for EC. Furthermore, by exploring the association of IgG N-glycome with prognostic risk factors in EC, we observed that lower levels of galactosylation and sialylation were correlated with high-risk factors including older age, non-endometrioid histologic subtypes, advanced stage, poor differentiation of tumor, and >50% myometrial invasion (MI).
Conclusions
Our results suggest that the IgG N-glycome profile could be a potential biomarker for EC diagnosis and a promising indicator for prognostic risk factors, and thus may facilitate the early detection of EC and the identification of high-risk patients.
Keywords: IgG N-glycome, endometrial cancer (EC), biomarker, risk factors
Introduction
Endometrial cancer (EC) is the most frequently diagnosed gynecological malignancy and the fourth most common cancer in women overall, with over 320,000 new cases and an estimated 76,000 global deaths being attributable to EC (1). The primary risk factors associated with EC include increased levels of estrogen due to obesity and diabetes, infertility, early age at menarche, late age at menopause, tamoxifen use, and Lynch syndrome (2,3). The majority of EC cases are diagnosed at an early stage with disease confined to the uterus due to early signs of irregular vaginal bleeding often prompting patients to seek clinical care (4).
Classically, EC is subdivided into two types on the basis of histological features. Type I tumors comprise primarily endometrioid histology which is mainly estrogen-dependent, while type II tumors comprise non-endometrioid histologic subtypes (e.g., serous, clear cell, mucinous or squamous histology). However, given the extensive heterogeneity and overlap in EC subtypes in terms of clinical manifestations, biological behaviors, tumor morphologies, and genetic features, the dualistic classification scheme of EC has limited value in the evaluation of prognosis and therapeutic efficacy. The Cancer Genome Atlas (TCGA) has proposed an in-depth categorization based on molecular profiles of EC subtypes, which further classifies endometrioid and serous subtypes into four distinct genomic classes: (I) polymerase ε (POLE)-ultramutated tumors; (II) microsatellite-instable (MSI) tumors; (III) copy-number low/microsatellite stable (MSS) tumors; and (IV) copy-number high (serous-like) tumors. Prognosis is promising for patients with stage I endometrioid endometrial carcinoma (EEC) grade 1–2, with less than 50% myometrial invasion (MI), and without lymphovascular space invasion (LVSI) (5,6). In contrast, female patients with high-grade tumors and at an advanced stage when first diagnosed are associated with a higher mortality rate and an increased risk for recurrence (6). Thus, the identification of high-risk factors is of paramount importance given the rise in disease incidence and mortality. Despite this need, there is a dearth of effective biomarkers and easy-to-perform methods which could facilitate disease diagnosis and pre-operative assessment, and thus, the detection of high-risk patients and appropriate risk stratification remains a challenging task.
Glycosylation acts as one of the most important post-translational modifications (PTMs), and is defined as the enzymatic process of adding carbohydrates site-specifically to other molecules like proteins. Glycosylation contributes to the regulation of the three-dimensional structure of protein, which in turn alters its biological activity (7). It has been proposed that altered glycome composition is correlated with cancer cell biology, ranging from cellular adhesion to cell proliferation (8,9). Given the fundamental role of glycosylation in the regulation of tumor pathogenesis and immune response, glycome and glycoproteome have been suggested as potential biomarkers in clinical assessment and as attractive targets for treatment. Immunoglobulin G (IgG) represents a highly abundant glycoprotein in human serum and is a key component in humoral immune response. A number of studies have demonstrated that disordered IgG glycosylation is responsible for a myriad of pathological processes (10,11), and it has been further implicated in various cancer types (12-15) in which IgG N-glycome influences disease pathogenesis-related alteration. Furthermore, the efficacy of anti-cancer antibodies depends principally on the triggering of complement-dependent cellular cytotoxicity (CDC) and antibody-dependent cellular cytotoxicity (ADCC) which could be modulated by IgG glycosylation. An in-depth understanding of the IgG glycosylation in disease pathogenesis and progression could spur the development of novel therapeutics.
In the present study, we explored IgG N-glycome in 94 EC patients and 112 healthy females using the ultra-performance liquid chromatography (UPLC) method. We observed a remarkable downregulation of IgG galactosylation and sialylation, along with an increased abundance of glycans with bisecting N-acetylglucosamine (GlcNAc) in patients with EC in comparison with the control cohort. Also, IgG N-glycome also showed discriminative power in identifying EC patients with high-risk factors. Thus, we propose that an IgG N-glycome profile may serve as a valuable biomarker for EC and as a potential indicator for the identification of high-risk patients. We present the following article in accordance with the REMARK reporting checklist (available ar http://dx.doi.org/10.21037/atm-20-3504).
Methods
Study population and sample collection
The study comprised a total of 94 eligible cases with pathologically confirmed epithelial endometrial carcinoma. In all, 112 age- and sex-matched healthy females who had no family history of cancer or precancerous lesions were included as the control cohort. Inclusion criteria for EC patients were the following: (I) patients who were over 18 years old; and (II) patients with epithelial EC histologically confirmed with hysteroscopy or surgery. Exclusion criteria were the following: (I) patients who had received chemotherapy or radiation therapy or who had undergone surgery prior to sample collection; (II) patients with recurrent EC; (III) patients with other cancers besides EC; and (IV) patients with detectable infections before sample collection. All serum samples were obtained from all participants between June 1, 2018 and November 20, 2019, and were frozen at −80 °C before analysis. For EC patients, serum samples were collected prior to any treatment. All EC patients in the study underwent full surgical staging according to International Federation of Gynecology and Obstetrics (FIGO) 2009 criteria based on surgical and pathological findings. Surgical procedure included total abdominal or laparoscopic hysterectomy and bilateral salpingo-oophorectomy (TH/BSO) with tailored lymphadenectomy. All patients and healthy volunteers gave informed consent. The study was conducted in accordance with the principles of Declaration of Helsinki. Approval of this study was obtained from the Medical Ethics Committee of Ren Ji Hospital, Shanghai Jiao Tong University School of Medicine.
IgG N-glycome profiling
Isolation of IgG from serum samples
IgG was isolated from the serum sample of every participant by affinity chromatography using a deep 96-well protein G monolithic plate as per the manufacturer’s protocol. Next, 70 µL of serum was diluted with 100 µL of binding buffer (20 mM Na3PO4, pH 7.0) before it was applied to the protein G plate. The plate was washed 3 times to remove unbound proteins after incubation at room temperature for 45 minutes. Before IgG elution, 0.1 CV of neutralization buffer (Tris-HCl, pH 9.0) was added to the 96-well plate. Subsequently, IgG was eluted from the protein G monoliths with 2 CV of elution buffer (0.1M glycine, pH 2.8) and further collected in the above-mentioned 96-well plate. The concentration of IgG was determined by a bicinchoninic acid (BCA) kit (Thermo Fisher Scientific).
Enzymatic release and purification of IgG N-glycans
As described previously, IgG N-glycans were released by incubation with 10 µL PNGase F (New England Biolabs) at 37 °C overnight (16). Then, the solution containing released N-glycans was added to the porous graphitized carbon (PGC) plate (Grace) which was washed with 200 µL of 0.1% (v/v) trifluoroacetic acid (TFA) in 80% acetonitrile (ACN)/H2O (v/v) and followed by 0.1% (v/v) TFA in H2O. After removing extra salts and buffer by washing PGC plate twice with 100 µL H2O, the N-glycans were eluted with 60 µL of 0.05% (v/v) TFA in 25% ACN/H2O (v/v) and the eluate was further dried before fluorescence labeling.
IgG N-glycan fluorescence labeling and hydrophilic interaction chromatography (HILIC)-UPLC analysis
IgG N-glycans were fluorescence-labeled with 2-aminobenzamide (2-AB) before UPLC analysis as previously described in other study (17). Briefly, 20 mg of 2-AB (Sigma-Aldrich) was mixed with 400 µL of dimethyl sulfoxide (DMSO) and glacial acetic acid mixture (v/v, 7/3), followed by the addition of 24 mg of sodium cyanoborohydride (SC, Sigma-Aldrich). After applying 3 µL of the above-mentioned labeling mixture to each N-glycan sample in the 96-well plate and mixing well, the mixture was incubated for 2 hours at 60 °C, after which 50 µL of ultrapure water was added. Prior to UPLC analysis, the solution was filtered through 0.22 µm filter membrane. The labeled IgG N-glycans were sequentially analyzed by hydrophilic interaction chromatography (HILIC) on a Waters Acquity UPLC instrument comprising a quaternary solvent manager, a sample manager, and a fluorescence detector (λex =330 nm, λem =420 nm) as described in previous literature (18). The chromatographic parameters are provided in Table S1. An automatic processing method was used for data processing, and each HILIC-UPLC chromatogram was manually corrected after a traditional integration algorithm. The released N-glycans were separated into 24 chromatographic peaks (GP1-GP24, with GP8 consisting of GP8a and GP8b; GP16, consisting of GP16a and GP16b; and GP18, consisting of GP18a and GP18b).
Table S1. Chromatographic parameters of UPLC.
| Chromatographic system | Waters Bio Core System H-Class UPLC |
|---|---|
| Column | ACQUITY UPLC® BEH Amide 1.7 ìm 2.1×100 mm |
| Detector | Fluorescence detector: λex =330 nm, λem =420 nm |
| Column Temp. | 60 °C |
| Autosampler Temp. | 2–8 °C |
| Injection volume | 2 µL |
| Mobile phases | A: 100 mM ammonium formate, pH 4.50±0.05 |
| B: 100% acetonitrile (ACN) |
Statistical analysis
Before analysis, the experimental variability was controlled by normalization of each individual glycan peak, in which the peak area of each basic glycan was divided by the total integrated area of the corresponding chromatogram of the sample, and the amount of glycans in each peak was expressed as the percentage of the total integrated area. To better summarize distinctive glycosylation patterns, 11 derived traits were calculated based on the shared glycan structures (including galactose, sialic acid, core fucose, and bisecting GlcNAc) of 24 directly measured glycans using a previously described method (19) (calculation formulas for derived traits are provided in Table S2). All glycan traits were quantified and presented as median and the interquartile range (IQR, 25–75% percentiles).
Table S2. The calculation formulas of derived glycan traits.
| Derived traits | Formula |
|---|---|
| G0n | (GP2 + GP3 + GP4 + GP5 + GP6)/(GP1 + GP2 + … + GP14 + GP15) |
| G1n | (GP7 + GP8a + GP8b + GP9 + GP10 + GP11)/(GP1 + GP2 + … + GP14 + GP15) |
| G2n | (GP12 + GP13 + GP14 + GP15)/(GP1 + GP2 + … + GP14 + GP15) |
| S total | GP16a + GP16b + GP17 + GP18a + GP18b + GP19 + GP21 + GP22 + GP23 + GP24 |
| S1 total | GP16a + GP16b + GP17 + GP18a + GP18b + GP19 |
| S2 total | GP21 + GP22 + GP23 + GP24 |
| Bisecting GlcNAc | GP3 + GP6 + GP8a + GP10 + GP11 + GP13 + GP15 + GP18a + GP19 + GP22 + GP24 |
| F total | GP1 + GP4 + GP6 + GP8b + GP9 + GP10 + GP11 + GP14 + GP15 + GP16a + GP16b + GP18b + GP19 + GP23 + GP24 |
| Fn | (GP4 + GP8b + GP9 + GP14)/(GP1 + GP2 + … + GP14 + GP15) |
| FBn | (GP6 + GP10 + GP11 + GP15)/(GP1 + GP2 + … + GP14 + GP15) |
| FBn/Fn | (GP6 + GP10 + GP11 + GP15)/(GP4 + GP8b + GP9 + GP14) |
The normality of the continuous variables was tested using Shapiro-Wilk test. Continuous variables were compared using a two-sample t-test in case of normal distribution; otherwise, Mann-Whitney U test was applied. Comparisons of categorical variables were made via chi-squared or Fisher’s exact tests as appropriate. Logistic regression analysis, with age and body-mass index (BMI) included as additional covariates, was used to perform association analyses between disease status and glycan traits. Differences in glycan traits between the EC and control cohort were visualized by principal components analysis (PCA). The reported P values in the study were two-sided and statistical significance was considered when P<0.05. Statistical analyses were carried out using IBM SPSS 22.0 (IBM Corporation, Armonk, NY, USA) and GraphPad Prism 8.0.1 (GraphPad, San Diego, CA, USA). PCA analysis was visualized using Origin 2018 (OriginLab, Northampton, MA, USA), and forest plot was generated by Stata 15.0 (StataCorp., College Station, TX, USA).
Results
Characteristics of study cohorts
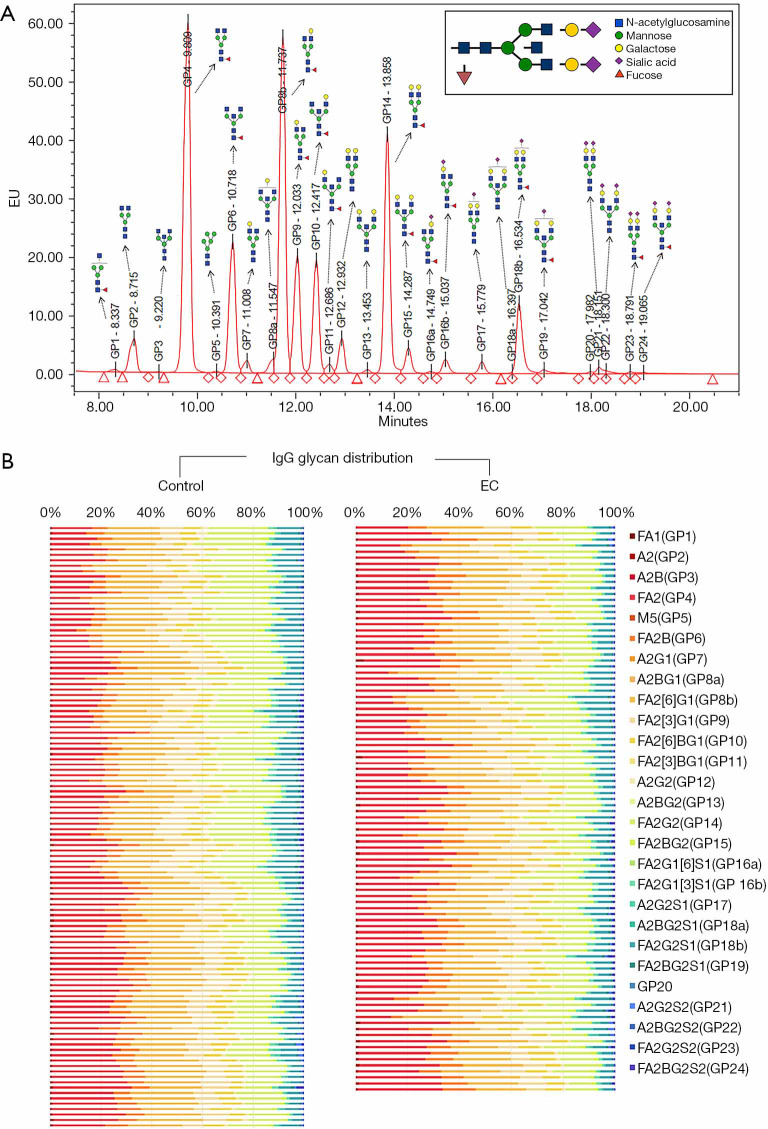
A total of 94 patients with EC and 112 healthy females were recruited, and the basic demographic characteristics of these participants are summarized in Table 1. The mean (SD) age of participants recruited was 57.13 (8.30) for EC patients and 55.68 (9.97) for the control cohort. No significant difference was identified in terms of BMI or menopausal status between these cohorts. IgG N-glycome was analyzed in the serum samples from each participant, and a representative IgG-N-glycomic profile is presented in Figure 1A. The detailed compositions of IgG N-glycome from the EC and control cohorts are given in Figure 1B.
Table 1. Baseline demographics of EC and control cohort.
| Clinical characteristics | EC (n=94) | Control (n=112) | P value |
|---|---|---|---|
| Age, mean (SD) | 57.13 (8.30) | 55.68 (9.97) | 0.26a |
| BMI, mean (SD) | 24.98 (3.96) | 25.16 (2.74) | 0.34b |
| Menopause, n (%) | 0.062c | ||
| Yes | 64 (68.0) | 62 (55.0) | |
| No | 30 (32.0) | 50 (45.0) |
a, by two-sample t-test; b, by Mann-Whitney U test; c, by Fisher’s exact test. BMI, body mass index; EC, endometrial cancer.
Figure 1.
UPLC analysis of immunoglobulin G (IgG) glycome in the EC and control cohort. (A) A representative chromatogram of a sample from an EC patient. The composition of total IgG N-glycans was separated into 24 chromatographic glycan peaks (GP1–GP24, with GP8 consisting of GP8a and GP8b, GP16 consisting of GP16a and GP16b, and GP18 consisting of GP18a and GP18b); each glycan peak corresponded to a specific glycan structure named according to the system presented in Supplementary Materials. (B) A heatmap of individual glycan structures (columns) for each individual (rows) in two cohorts (EC and control). Note that GP20 was not named because of its undetermined glycan structure.
The IgG N-glycome profile differed between the EC and control cohorts
Galactosylation and sialylation of IgG
The galactosylation of IgG is known to be a significant modulator of the activation of anti-inflammatory signaling cascade via enhancing the association between inhibitory FcγRIIB and dectin-1, which inhibits the pro-inflammatory role of C5aR in the recruitment and activation of inflammatory cells (20). There is also evidence suggesting that terminal galactoses can improve binding of C1q to IgG1 and IgG3 subtypes, and boost CDC efficacy (21,22), indicating a complex engagement of terminal galactoses on IgG in various biological pathways. Sialic acid, which is sequentially added to terminal galactose, can transform IgG into anti-inflammatory profile by enhancing the binding of IgG to lectin receptors (23) and is well recognized for its anti-inflammatory property in intravenous IgG (IVIG) (24,25) which contributes to the amelioration of various diseases.
By comparing the IgG N-glycome between the EC and control cohorts, we demonstrated a statistically significant decrease in the level of galactosylation in EC patients compared with the control cohort, with an elevation in IgG-G0 represented by major agalactosylated glycans GP4 (P<0.0001, Table 2) and derived trait G0n (P<0.0001, Table 3), followed by an accompanying decline in IgG-G1 (P=0.019 for G1n, Table 3) and IgG-G2, represented by GP14 (P<0.0001, Table 2) and derived trait G2n (P<0.0001, Table 3). Sialylated IgG glycans, especially the monosialylated ones, were in the lower proportion in the EC cohort compared with the control cohort, with the former cohort possessing lower levels of S total (P=0.002, Table 3) and S1 total (P=0.001). Glycans with two terminal sialic acids (S2 total) demonstrated no considerable difference between the EC and control cohorts. Nevertheless, it should be noted that major sialylated structures were monosialylated, while disialylated ones only accounted for only a small proportion.
Table 2. Differences of directly measured glycans in the EC and control cohorts.
| Glycan peak | Description of glycan structures | Median (IQR) | P | ||
|---|---|---|---|---|---|
| Control (n=112) | EC (n=94) | ||||
| GP1a | Percentage of FA1 glycan in total IgG glycans |
|
0.12 (0.086–0.16) | 0.11 (0.079–0.14) | 0.52 |
| GP2 | Percentage of A2 glycan in total IgG glycans |

|
0.53 (0.38–0.71) | 0.60 (0.38–0.84) | 0.045* |
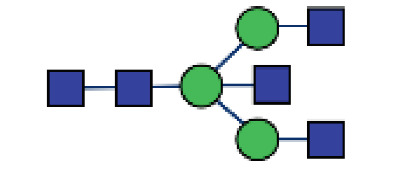
| GP3 | Percentage of A2B glycan in total IgG glycans |
|
0.074 (0.061–0.11) | 0.069 (0.046–0.94) | 0.027* |
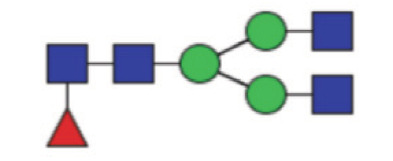
| GP4 | Percentage of FA2 glycan in total IgG glycans |
|
21.14 (17.02–25.68) | 26.10 (21.95–30.06) | <0.0001* |
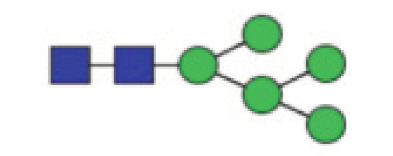
| GP5 | Percentage of M5 glycan in total IgG glycans |
|
0.11 (0.082–0.31) | 0.081 (0.066–0.11) | <0.0001* |
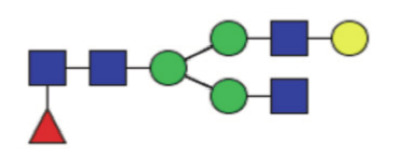
| GP6 | Percentage of FA2B glycan in total IgG glycans |
|
6.06 (5.00–7.20) | 7.60 (5.78–8.80) | <0.0001* |
| GP7 | Percentage of A2G1 glycan in total IgG glycans |
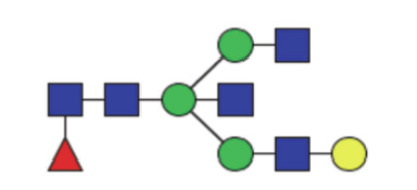
|
0.32 (0.25–0.42) | 0.30 (0.21–0.38) | 0.16 |
| GP8a | Percentage of A2BG1 glycan in total IgG glycans |
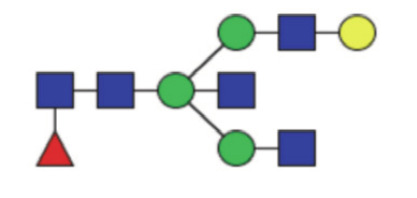
|
0.13 (0.052–0.23) | 0.15 (0.10–0.27) | 0.51 |
| GP8b | Percentage of FA2[6]G1 glycan in total IgG glycans |
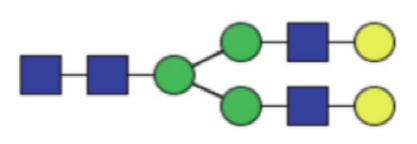
|
21.39 (19.81–22.80) | 21.14 (19.47–22.62) | 0.43 |
| GP9 | Percentage of FA2[3]G1 glycan in total IgG glycans |
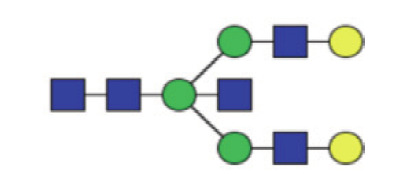
|
9.71 (8.30–11.09) | 9.47 (8.258–10.60) | 0.49 |
| GP10 | Percentage of FA2[6]BG1 glycan in total IgG glycans |
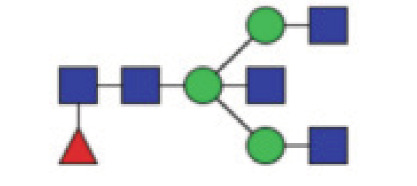
|
6.26 (5.47–7.02) | 6.73 (5.86–7.83) | 0.004* |
| GP11 | Percentage of FA2[3]BG1 glycan in total IgG glycans |

|
0.65 (0.54–0.92) | 0.70 (0.61–0.82) | 0.67 |
| GP12 | Percentage of A2G2 glycan in total IgG glycans |
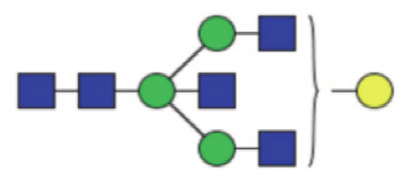
|
1.06 (0.78–1.53) | 0.79 (0.57–0.98) | <0.0001* |
| GP13 | Percentage of A2BG2 glycan in total IgG glycans |
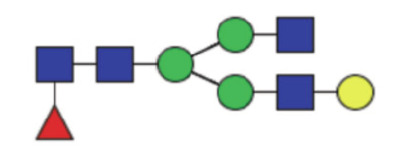
|
0.18 (0.14–25) | 0.17 (0.15–0.22) | 0.62 |
| GP14 | Percentage of FA2G2 glycan in total IgG glycans |
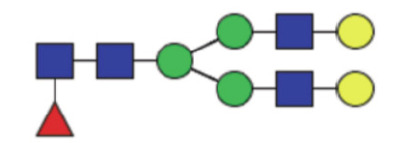
|
17.35 (14.53–20.49) | 14.14 (11.79–16.55) | <0.0001* |
| GP15 | Percentage of FA2BG2 glycan in total IgG glycans |
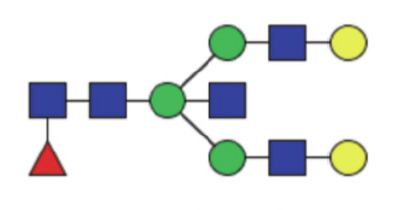
|
1.90 (1.58–2.39) | 1.71 (1.33–2.13) | 0.010* |
| GP16a | Percentage of FA2G1[6]S1 glycan in total IgG glycans |
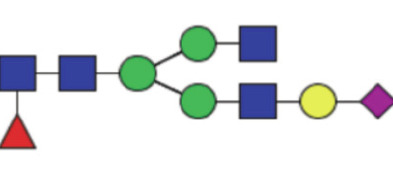
|
0.16 (0.13–0.21) | 0.15 (0.12–0.19) | 0.11 |
| GP16b | Percentage of FA2G1[3]S1 glycan in total IgG glycans |
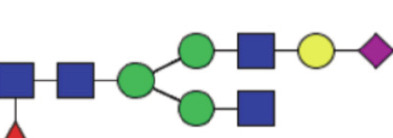
|
1.49 (1.22–1.85) | 1.59 (1.21–1.84) | 0.60 |
| GP17 | Percentage of A2G2S1 glycan in total IgG glycans |

|
0.84 (0.66–1.12) | 0.54 (0.41–0.67) | 0.001* |
| GP18a | Percentage of A2BG2S1 glycan in total IgG glycans |
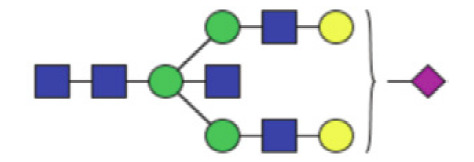
|
0.029 (0.019–0.060) | 0.037 (0.025–0.051) | 0.17 |
| GP18b | Percentage of FA2G2S1 glycan in total IgG glycans |
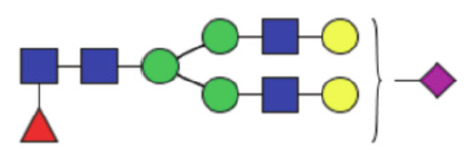
|
6.16 (4.66–8.04)) | 4.97 (3.77–6.38) | 0.001* |
| GP19 | Percentage of FA2BG2S1 glycan in total IgG glycans |
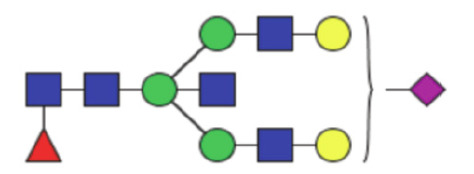
|
0.62 (0.38–0.86) | 0.61 (0.46–0.78) | 0.24 |
| GP20 | Glycan structure not clearly determined | 0.13 (0.082–0.17) | 0.11 (0.083–0.15) | 0.057 | |
| GP21 | Percentage of A2G2S2 glycan in total IgG glycans |

|
0.45 (0.30–0.69) | 0.33 (0.21–0.58) | 0.022* |
| GP22 | Percentage of A2BG2S2 glycan in total IgG glycan |
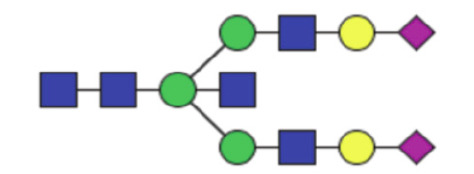
|
0.094 (0.063–0.14) | 0.11 (0.069–0.20) | 0.14 |
| GP23 | Percentage of FA2G2S2 glycan in total IgG glycans |
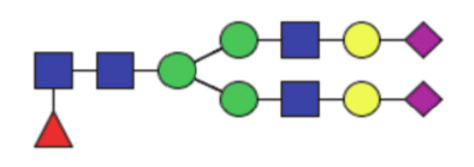
|
0.20 (0.10–0.40) | 0.18 (0.12–0.38) | 0.83 |
| GP24 | Percentage of FA2BG2S2 glycan in total IgG glycans |
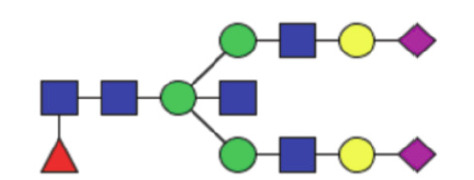
|
0.22 (0.084–0.52) | 0.23 (0.13–0.52) | 0.60 |
P values were adjusted for age and BMI. P values <0.05 are marked with “*”. B, bisecting GlcNAc; F, core fucose; G, galactose; S, sialic acid; GP, glycan peak; EC, endometrial cancer.
Table 3. Descriptive statistics for derived traits between the EC and control cohort.
| Derived traits | Description | Control, median (IQR) | EC, median (IQR) | ORa | Pa |
|---|---|---|---|---|---|
| Percentage of galactosylation | |||||
| G0n | Proportion of agalactosylated structures in neutral glycans | 31.62 (26.40–37.61) | 38.61 (33.25–43.06) | 1.15 (1.09–1.22) | <0.0001* |
| G1n | Proportion of monogalactosylated structures in neutral glycans | 44.02 (42.31–45.27) | 43.02 (40.95–45.14) | 0.87 (0.78–0.98) | 0.019* |
| G2n | Proportion of digalactosylated structures in neutral glycans | 23.70 (18.32–29.25) | 18.63 (15.43–21.96) | 0.83 (0.77–0.89) | <0.0001* |
| Percentage of sialylation | |||||
| S total | Proportion of sialylated structures in total IgG glycans | 11.68 (8.78–13.77) | 9.26 (7.42–11.40) | 0.85 (0.78–0.94) | 0.002* |
| S1 total | Proportion of monosialylated structures in total IgG glycans | 10.21 (7.72–11.94) | 8.06 (6.48–9.75) | 0.82 (0.73–0.92) | 0.001* |
| S2 total | Proportion of disialylated structures in total IgG glycans | 1.21 (0.69–1.87) | 1.03 (0.77–1.47) | 0.87 (0.60–1.26) | 0.45 |
| Percentage of fucosylation and bisecting GlcNAc | |||||
| F total | Proportion of fucosylated glycans in total IgG glycans | 95.51 (94.51–96.45) | 96.41 (95.63–97.03) | 1.52 (1.20–1.93) | 0.001* |
| Bisecting GlcNAc | Proportion of structures with GlcNAc in total IgG glycans | 16.91 (15.53–18.40) | 18.33 (16.09–20.95) | 1.17 (1.05–1.29) | 0.003* |
| Percentage of fucosylation +/− bisecting GlcNAc | |||||
| Fn | The percentage of fucosylated (without bisecting GlcNAc) structures in total neutral IgG glycans | 79.61 (77.86–81.38) | 79.03 (75.92–81.33) | 0.94 (0.87–1.02) | 0.141 |
| FBn | Proportion of fucosylated (with bisecting GlcNAc) structures in total neutral IgG glycans | 16.93 (15.69–18.83) | 18.30 (16.52–21.18) | 1.19 (1.08–1.32) | 0.001* |
| FBn/Fn | Ratio of fucosylated structures with and without bisecting GlcNAc | 21.28 (19.35–24.45) | 23.13 (20.23–27.69) | 1.10 (1.04–1.17) | 0.002* |
a, OR and P values were adjusted by age and BMI using bivariate logistic regression analysis. P values <0.05 are marked with “*”. B, bisecting GlcNAc; F, core fucose; G, galactose; S, sialic acid; OR, odds ratio. See Table 2 for the definitions of derived traits.
Core fucosylation and bisecting GlcNAc
It is well established that core fucosylation of IgG molecules significantly decreases IgG’s capacity to mediate ADCC though downregulating the affinity of the Fc fragment for FcγRIIIA (22,26) and that bisecting type N-glycans can increase affinity for FcγRs and enhance antibody-dependent cytotoxicity (27). However, the addition of bisecting GlcNAc can partially oppose the acquisition of core fucose during glycan synthesis (28), making it difficult to distinguish the functional roles of these two glycan modifications. In this study, we observed an increased abundance of bisecting type N-glycans (P=0.003 for bisecting GlcNAc) and a slight elevation of total fucosylation of IgG (P=0.001 for F total) in the EC cohort. However, it is worth noting that more than 90% of IgG N-glycans were core-fucosylated, which was also confirmed in both the EC and control cohort, with the percentage of core fucosylation up to 98.12% and 97.87%, respectively. Thus, the elevation of total fucosylation was not obvious in the EC cohort. In order to focus on the interplay between core fucose and bisecting GlcNAc, and to eliminate confusing effects of other glycosylation modifications, we further employed Fn (all structures with a core fucose and without bisecting GlcNAc in neutral glycans), FBn (all fucosylated structures with bisecting GlcNAc in neutral glycans), and FBn/Fn to better understand the relationship between these two glycosylation patterns. As a result, we observed a higher level of bisecting GlcNAc in the context of fucosylatin in the EC cohort compared with the control cohort (P=0.001 for FBn; P=0.002 for FBn/Fn) while no statistically significant difference in Fn was detected (P=0.141).
The potential diagnostic value of IgG N-glycome in EC
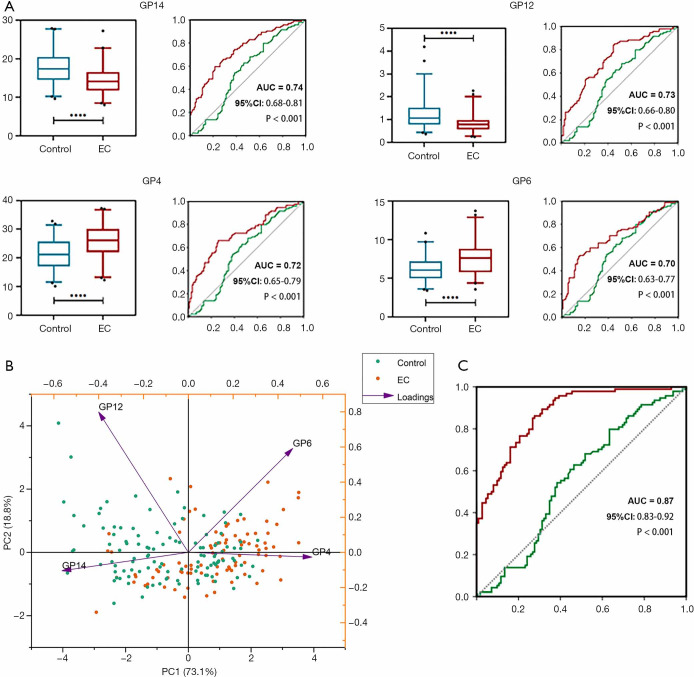
Examination of discriminative performance of each directly measured glycan trait using receiver operating curve (ROC) curve analysis identified several glycans as potential biomarkers for EC. Glycan structure GP14 had the highest diagnostic performance (area under the curve, AUC =0.74, 95% CI: 0.68–0.81, P<0.001, Figure 2A), and GP12 (AUC = 0.73, 95% CI: 0.66–0.80, P<0.001, Figure 2A), GP4 (AUC =0.72, 95% CI: 0.65–0.79, P<0.001, Figure 2A), and GP6 (AUC =0.70, 95% CI: 0.63–0.77, P<0.001, Figure 2A) were among the strongest diagnostic parameters. We further visualized the separation between the EC and control cohort based on GP14, GP12, GP4, and GP6 using a PCA score plot (Figure 2B), with principal component (PC) 1 and PC2 accounting for 73.1% and 18.8% of the total variance, respectively. When discriminative performance of glycan traits between the EC and control cohort was examined based exclusively on 24 individual glycan traits, glycan traits which were considered significant according to the univariate analysis were included in the multivariate logistic regression analysis (forward: LR), and 7 glycan traits [A2 (GP2), M5 (GP5), FA2[6]BG1 (GP10), A2G2 (GP12), FA2G2 (GP14), FA2G2S1 (GP18b), and A2G2S2 (GP21)] remained significantly related to disease status. While age and BMI alone (AUC =0.56, P=0.14) failed to significantly discern these 2 cohorts, the addition of the above-mentioned glycan traits showed good differential performance (AUC =0.87, 95% CI: 0.83–0.92, P<0.0001, Figure 2C), indicating the diagnostic potential of IgG N-glycome in EC.
Figure 2.
Classification of endometrial cancer patients using IgG glycans. (A) ROC curve illustrating the performance of individual glycans (GP4, GP6, GP12, and GP14) for discriminating between the EC cohort and the control cohort. From the ROC results, age and BMI alone could not differentiate EC patients from healthy individuals (green line), and the addition of glycan traits increased discriminative power (red line). (B) Principal components analysis (PCA) score plot showing differences in GP4, GP6, GP12, and GP14 glycans between the EC and control cohorts. (C) ROC curve illustrating the combined performance of glycans in distinguishing EC samples from control samples. A green line represents the ROC curve for age and BMI only, while a red line represents the ROC curve for age and BMI with the addition of glycan traits. AUC, area under the curve; PC, principal component (see Figure 1 for other definitions).
Correlation between IgG N-glycome and clinicopathological features of EC
EC is not a uniform disease entity and is heterogenous in terms of histologic subtypes, surgical staging, grade, and molecular properties. Thus, a further analysis was carried out to investigate the association of the IgG N-glycome profile with various clinicopathological features in EC patients. We observed a significant downregulation of galactosylation (P=0.017 for G0n, P=0.0059 for G2n, Table 4) and sialylation (P=0.0070 for S, P=0.0051 for S1), with a slight elevation in the level of bisecting type N-glycans (P=0.048 for bisecting GlcNAc, Table S3) and decreased Fn (P=0.047) in the blood samples from patients older than 60 years old. When the correlation of IgG N-glycome with histologic types was explored, endometrioid EC was associated with a higher level of G2n (P=0.045), S total (P=0.040), and S1 total (P=0.042), while nonendometriod subtypes were subjected to a lower level of galactosylation and sialylation. In those patients with early-stage (stage IA) tumors, we observed a remarkably higher level of galactosylation (P<0.0001 for G0n, P=0.002 for G1n, P<0.0001 for G2n) and sialylation (P=0.011 for S total, P=0.005 for S1 total) in comparison with patients diagnosed with advanced stage (stage IB–IV). Furthermore, patients with well- and moderately differentiated tumors had a lower proportion of agalactosylated structures (P=0.022 for G0n) and a higher abundance of sialylated ones (P=0.002 for both S total and S1 total) than those patients with poorly differentiated tumors. A significant difference in galactosylation was also observed between patients with MI ≥50% and those with MI <50%, with the latter demonstrating more G2n (P=0.022) and less G0n (P=0.030). Neither LVSI nor estrogen receptor (ER)/progesterone receptor (PR) status manifested a close association with derived glycan traits.
Table 4. The association of glycan traits with clinicopathological characteristics in EC patients.
| Clinicopathological parameters | Group | No. | G0n | G1n | G2n | S total | S1 total | |||||||||
|---|---|---|---|---|---|---|---|---|---|---|---|---|---|---|---|---|
| Median (IQR) | P value | Median (IQR) | P value | Median (IQR) | P value | Median (IQR) | P value | Median (IQR) | P value | |||||||
| Age | <60y | 56 | 37.65 (29.82–42.17) | 0.017* | 43.42 (40.94–45.53) | 0.1599 | 20.52 (15.93–23.69) | 0.0059* | 10.25 (8.36–12.83) | 0.0070* | 8.68 (6.98–11.49) | 0.0051* | ||||
| ≥60y | 38 | 39.01 (36.60–44.75) | 42.13 (40.88–43.86) | 18.17 (13.49–19.29) | 8.36 (7.13–9.81) | 7.14 (6.06–8.54) | ||||||||||
| BMI | <25 | 53 | 38.41 (33.57–42.24) | 0.86 | 43.10 (40.62–44.85) | 0.8096 | 19.03 (15.73–21.87) | 0.70 | 9.51 (7.49–11.32) | 0.57 | 8.29 (6.62–9.75) | 0.64 | ||||
| ≥25 | 41 | 39.17 (30.45–43.29) | 42.97 (41.17–45.55) | 17.84 (14.57–23.11) | 8.95 (7.01–11.63) | 7.86 (6.07–9.79) | ||||||||||
| Histologic subtype | Endometrioid | 80 | 38.48 (32.53–42.21) | 0.111 | 43.02 (41.03–45.14) | 0.632 | 18.83 (15.69–22.82) | 0.045* | 9.49 (7.44–12.32) | 0.040* | 8.30 (6.54–10.34) | 0.042* | ||||
| Othera | 14 | 40.95 (36.59–45.22) | 42.84 (40.34–44.39) | 15.78 (13.86–19.11) | 8.86 (6.70–9.75) | 7.44 (6.11–8.31) | ||||||||||
| Differentiation | Well/moderate | 67 | 37.11 (30.48–42.40) | 0.018* | 43.45 (41.11–45.49) | 0.040* | 19.15 (15.83–23.54) | 0.031* | 9.81 (8.18–12.48) | 0.002* | 8.50 (7.03–11.47) | 0.002* | ||||
| Poor | 27 | 40.34 (37.53–44.44) | 42.06 (40.49–43.39) | 17.13 (14.35–19.16) | 8.26 (6.59-9.66) | 6.63 (5.95-8.53) | ||||||||||
| FIGO stage | IA | 52 | 35.43 (29.48–39.32) | <0.0001* | 43.87 (42.07–45.89) | 0.002* | 21.40 (17.73–24.68) | <0.0001* | 10.31 (7.95–13.28) | 0.011* | 8.93 (7.03–11.76) | 0.005* | ||||
| IB–IV | 42 | 40.87 (38.06–45.51) | 41.75 (40.13–43.77) | 15.96 (13.80–19.15) | 8.49 (7.25–9.72) | 7.13 (6.11–8.53) | ||||||||||
| MI | <50% | 69 | 37.67 (30.45–41.44) | 0.022* | 43.45 (41.13–45.65) | 0.066 | 19.11 (15.95–23.21) | 0.030* | 9.57 (7.49–12.38) | 0.73 | 8.33 (6.65–10.32) | 0.54 | ||||
| ≥50% | 25 | 41.03 (36.23–45.25) | 42.06 (40.54–43.39) | 16.36 (13.75–19.15) | 9.13 (7.24–9.77) | 7.86 (6.14–8.53) | ||||||||||
| LVSI | Present | 19 | 38.47 (32.29–42.25) | 0.173 | 43.31 (41.24–45.29) | 0.11 | 18.96 (15.61–22.00) | 0.32 | 9.14 (7.35–11.28) | 0.52 | 7.93 (6.38–9.75) | 0.68 | ||||
| Absent | 75 | 40.80 (35.95–45.81) | 41.11 (39.48–43.89) | 17.26 (14.35–21.27) | 9.68 (8.39–11.75) | 8.33 (6.66–10.51) | ||||||||||
| ER/PR | Positive | 81 | 37.67 (32.33–42.70) | 0.233 | 43.18 (41.00–45.22) | 0.41 | 18.97 (15.63–22.75) | 0.24 | 9.42 (7.45–12.27) | 0.11 | 8.23 (6.56–10.32) | 0.12 | ||||
| Negative | 13 | 40.87 (39.72–43.29) | 41.77 (40.71–43.71) | 16.36 (14.67–19.24) | 9.22 (6.87–9.61) | 7.86 (6.06–8.52) | ||||||||||
P values were adjusted for age and BMI using bivariate logistic regression analysis. P values <0.05 are annotated with “*”. a, other histologic subtypes including clear cell, serous, and undifferentiated endometrial cancer. BMI, body mass index; EC, endometrial cancer; FIGO, International Federation of Gynecology and Obstetrics; MI, myometrial invasion; LVSI, lympho-vascular space invasion; ER, estrogen receptor; PR, progesterone receptor. See Table 2 for detailed definitions of derived traits.
Table S3. The association of other derived glycan traits with clinicopathological characteristics in EC patients.
| Clinicopathological parameters | Group | No. | S2 | F total | Fn | FBn | B | |||||||||
|---|---|---|---|---|---|---|---|---|---|---|---|---|---|---|---|---|
| Median (IQR) | P value | Median (IQR) | P value | Median (IQR) | P value | Median (IQR) | P value | Median (IQR) | P value | |||||||
| Age | <60 y | 56 | 1.03 (0.84–1.50) | 0.49 | 96.49 (95.72–96.49) | 0.29 | 79.41 (77.29–81.35) | 0.047* | 17.65 (16.38–19.86) | 0.062 | 17.50 (15.89–19.70) | 0.048* | ||||
| ≥60 y | 38 | 1.03 (0.70–1.45) | 96.24 (95.48–96.86) | 77.68 (74.26–80.37) | 19.98 (16.82–22.20) | 19.84 (16.61–21.80) | ||||||||||
| BMI | <25 | 53 | 1.11 (0.72–1.47) | 0.64 | 96.54 (95.72–97.09) | 0.89 | 79.43 (76.33–82.50) | 0.10 | 18.04 (15.33–20.97) | 0.14 | 18.05 (15.35–20.69) | 0.13 | ||||
| ≥25 | 41 | 0.99 (0.81–1.49) | 96.37 (95.50–97.03) | 78.66 (75.38–80.22) | 18.81 (17.06–21.51) | 18.59 (16.98–21.19) | ||||||||||
| Histologic subtype | Endometrioid | 80 | 1.04 (0.79–1.47) | 0.30 | 96.37 (95.58–96.96) | 0.72 | 78.85 (75.79–81.30) | 0.18 | 18.46 (16.67–21.25) | 0.26 | 18.48 (16.29–20.96) | 0.21 | ||||
| Othera | 14 | 0.90 (0.67–1.36) | 96.87 (95.84–97.27) | 80.21 (78.48–82.08) | 16.81 (15.95–19.43) | 16.72 (15.72–19.38) | ||||||||||
| Grade | G1–G2 | 67 | 1.11 (0.84–1.53) | 0.086 | 96.54 (95.64–97.16) | 0.48 | 79.15 (75.97–81.36) | 0.72 | 18.21 (16.31–21.29) | 0.90 | 18.38 (16.09–20.65) | 0.97 | ||||
| G3 | 27 | 0.89 (0.64–1.13) | 96.19 (95.46–96.91) | 78.68 (75.79–81.06) | 18.51 (16.60–21.15) | 18.38 (16.09–20.97) | ||||||||||
| FIGO stage | IA | 52 | 1.12 (0.76–1.53) | 0.69 | 96.54 (05.74–97.15) | 0.13 | 79.18 (76.53-81.56) | 0.25 | 18.21 (16.10–20.97) | 0.32 | 18.17 (15.82–20.37) | 0.33 | ||||
| IB–IV | 42 | 1.00 (0.77–1.35) | 96.26 (95.54–96.95) | 78.78 (74.28–80.77) | 18.66 (16.76–21.99) | 18.58 (16.21–21.66) | ||||||||||
| MI | <50% | 69 | 1.08 (0.76–1.46) | 0.40 | 96.44 (95.74–97.16) | 0.14 | 79.05 (76.18–81.29) | 0.99 | 18.34 (16.60–21.15) | 0.97 | 18.38 (16.25–20.69) | 0.78 | ||||
| ≥50% | 25 | 0.99 (0.76–1.73) | 96.10 (95.33–96.92) | 79.02 (74.82–81.76) | 18.15 (16.19–22.98) | 17.62 (15.93–21.24) | ||||||||||
| LVSI | Present | 19 | 1.04 (0.72–1.45) | 0.24 | 96.44 (95.69–97.13) | 0.45 | 78.99 (75.75–81.36) | 0.29 | 18.35 (16.19–21.29) | 0.27 | 18.47 (15.82–21.06) | 0.23 | ||||
| Absent | 75 | 1.02 (0.84–1.74) | 96.01 (95.25–96.94) | 79.05 (76.78–90.59) | 17.65 (16.71–20.50) | 17.27 (16.25–19.76) | ||||||||||
| ER/PR | Positive | 81 | 1.04 (0.76–1.49) | 0.30 | 96.37 (95.60–97.04) | 0.71 | 79.15 (76.10–81.70) | 0.17 | 18.21 (16.11–20.97) | 0.098 | 18.06 (15.82–20.58) | 0.10 | ||||
| Negative | 13 | 0.98 (0.66–1.31) | 96.75 (96.03–97.07) | 78.49 (73.34–79.99) | 18.86 (16.93–24.52) | 18.66 (16.69–23.72) | ||||||||||
P values were adjusted for age and BMI using bivariate logistic regression analysis. P values <0.05 are annotated with “*”. a, other histologic subtypes include clear cell, serous, and undifferentiated endometrial cancer. BMI, body mass index; EC, endometrial cancer; FIGO, International Federation of Gynecology and Obstetrics; MI, myometrial invasion; LVSI, lymphovascular space invasion; ER, estrogen receptor; PR, progesterone receptor. See Table 2 for detailed definitions of derived traits.
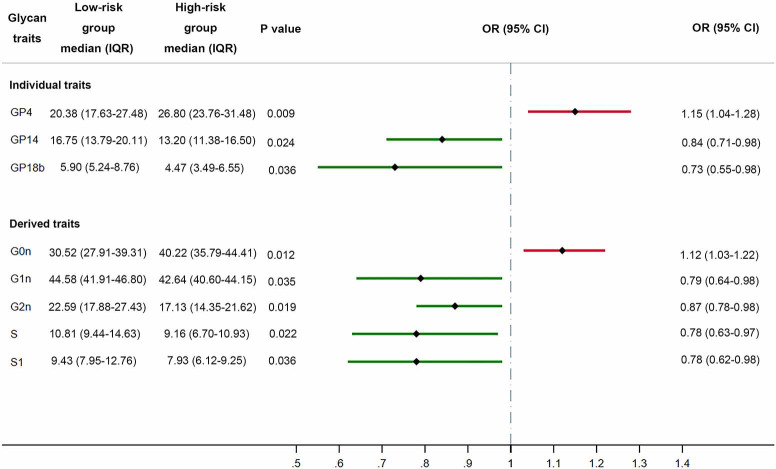
Advanced age is closely associated with increased incidence and poor prognosis of EC, especially for those older than 60 years old. Thus, identification of prognostic risk factors for those younger patients could be of critical significance for therapeutic decision-making. In order to examine the relationship between distribution of IgG N-glycome and high-risk factors for EC, we further classified patients less than 60 years old into the low-risk group (n=29) and the high-risk group (n=27) based on the presence of high-risk factors which include stage I EEC, grade 3 with outer 50% MI, or with LVSI; stage II–III EEC; and stage I–III with non-endometrioid histologies. Notably, patients belonging to the high-risk group manifested a significantly lower level of galactosylation and sialylation while those in the low-risk group possessed more galactosylated IgG glycans, whether they were monogalactosylated (P=0.035 for G1n, Figure 3), digalactosylated [P=0.024 for FA2G2 (GP14), P=0.019 for G2n], sialylated [P=0.036 for FA2G2S1 (GP18b), P=0.022 for S total, P=0.036 for S1 total]. Glycans with two terminal sialic acids were also more abundant in the low-risk group, though the difference was not statistically significant (P=0.056 for S2 total, Table S4). However, we did not observe strong correlations of bisecting GlcNAc and fucosylation with high-risk factors (Table S4). Non-invasive serum tumor markers, which are commonly evaluated in pre-operation assessment, including CEA, CA19-9, CA125, and HE4, were also analyzed between these two groups. In the high-risk group, 10 patients (37%) demonstrated abnormally elevated tumor markers, while 9 patients (31%) in the low-risk group had tumor markers above normal range. Nevertheless, the number of patients with abnormal tumor markers showed no significant difference between high-risk and low-risk groups (Fisher’s exact test, P=0.7789).
Figure 3.
Forest plot demonstrating the differences of glycan traits (individual and derived traits) between the low-risk and high-risk groups. A grey dot-dashed line represents the reference line (OR =1), a solid red line represents an OR >1, and a solid green line represents an OR <1. P values were adjusted for age and BMI. GP, glycan peak; S, S total; S1, S1 total.
Table S4. The association of other derived traits with different risk groups.
| Derived traits | Low-risk (n=29), median (IQR) | High-risk (n=27), median (IQR) | P value |
|---|---|---|---|
| S2 total | 1.27 (0.91–1.67) | 0.93 (0.79–1.08) | 0.056 |
| Bisecting GlcNAc | 17.53 (15.82–19.57) | 17.45 (16.09–19.76) | 0.93 |
| F | 96.37 (95.51–97.27) | 96.70 (95.85–97.30) | 0.99 |
| Fn | 79.24 (76.70–81.32) | 80.07 (77.61–81.76) | 0.91 |
| FBn | 17.92 (16.17–19.97) | 17.65 (16.60–19.46) | 0.95 |
Discussion
The past decade has witnessed a sustained increase in the incidence and mortality rate for EC, necessitating the exploration of efficacious biomarkers to provide early detection and diagnosis of endometrial malignancies. The significant relevance of IgG N-glycome has been established in autoimmune diseases like rheumatoid arthritis (29) and systemic lupus erythematosus (30), and also in cancers like colorectal cancer (12,29), ovarian cancer (31), and prostate cancer (32). Despite this research, few studies have shed light on the N-glycome profile of EC as an independent disease entity. In the present study, by comprehensively analyzing the IgG N-glycome composition of EC patients and healthy females using a high-throughput and quantitative method, we identified a significant downregulation of galactosylation in EC patients, represented by an increased level of agalactosylated IgG glycans [FA2 (GP4), FA2B (GP6)], and an accompanying decline in monogalactosylated {FA2[6]G1 (GP8b), FA2[3]G1 (GP9), FA2[6]BG1 (GP10)} and digalactosylated glycan structures [FA2G2 (GP14), FA2BG2 (GP15), and A2G2 (GP12)]. This downregulation of galactosylation in EC is consistent with the results of a previous pan-cancer study covering 12 types of cancers (13) and also with the results of colorectal cancer studies (12,29). Sialylation also demonstrated a concurrent decrease with galactosylation in the EC cohort, which was particularly evident in monosialylated glycoforms [FA2G2S1 (GP18b), FA2G1[3]S1 (GP16b), A2G2S1 (GP17)], but not in the disialylated ones. Of note, a similar pattern of galactosylation and sialylation has been reported in autoimmune diseases including rheumatoid arthritis (33,34) and systemic lupus erythematosus (35), in which a decreased level of galactosylation and sialylation was associated with aggravation of disease activity. Given that the mechanism of IgG glycosylation is poorly understood, this intriguing observation in both autoimmune diseases and EC represents a possible avenue of future research. Besides galactosylation and sialylation, the proportion of glycans with bisecting GlcNAc was upregulated in EC cases and coupled with a slight increase in total fucosylation. However, when derived traits Fn and FBn were further applied, we observed an increased proportion of fucosylated structures with bisecting GlcNAc (FBn) in the cancer cohort, indicating a possible interaction between these two glycan modifications on IgG. Further ROC analysis based on directly measured glycans showed the biomarker potential of IgG N-glycome in the diagnosis of EC, and this is worth investigating using an enlarged sample size.
The clinical application of non-invasive serum biomarkers has been widely exploited in the field of cancer as an efficient tool for screening and as a practical method to evaluate therapeutic effect and prognosis. CA125 is the most frequently applied serum biomarker in patients with EC, with HE-4 also showing similar prognostic value (36,37). However, many of these biomarkers have failed to preoperatively identify patients with high-risk factors and thus have their limitations in risk stratification in clinical practice. As we have demonstrated in the study, abnormally elevated tumor markers including CA125, HE4, CA199, and CEA did not achieve satisfactory accuracy in the separation of high-risk patients from low-risk ones, whereas IgG N-glycome exhibited diagnostic potential in differentiating between high-risk and low-risk groups with an age lower than 60 years. Through analysis of 24 directly measured glycan traits and 11 derived traits, we identified hypogalactosylation [represented by glycan trait FA2 (GP4), and derived traits G0n, G1n, and G2n] and hyposialylation [represented by glycan trait FA2G2S1 (GP18b), and derived traits S total and S1 total] as closely related to high-risk factors associated with poor prognosis. These thus have potential utility as valuable non-invasive biomarkers in the detection of risk factors in EC, which may allow further risk stratification and personalized treatment in clinical practice.
Glycosylation is a highly orchestrated process which is the result of the coordination of multiple enzymatic reactions, leading to a spatial reservoir of glycoforms (9). Slight alterations in the expression, activity, and localization of glycosyltransferases and glycosidases have been shown to induce pleiotropic effects involving a wide spectrum of glycoproteins. For example, the overexpression of fucosyltransferase (FUT8) (8), a glycogene responsible for the acquisition of core fucosylation, was observed acting as a promoter of metastasis in melanoma (38). Thus, the modification of IgG N-glycome in EC patients observed in this study, though seemingly epigenetic due to its unique non-template-based biosynthesis, could be a reflection of the disordered regulation of glycogenes involved in glycan synthesis, transport, and degradation. Currently, the intracellular mechanism with respect to the alteration of IgG N-glycome in the cancer environment is still not fully elucidated. Further study into this domain may give rise to novel therapeutics targeting glycosylation pathways in the cancer environment.
Research into biotherapeutics has developed rapidly in recent years, with the study of monoclonal antibodies (mAb) emerging as a promising immunotherapy for various malignancies and autoimmune disorders. The anticancer effect of mAbs depends on the triggered effector functions of ADCC and antibody-dependent cell-mediated phagocytosis (ADCP), which could be effectively enhanced through glycoengineering Fc-glycans on mAbs (39,40). For instance, reduced core fucosylation leads to the higher binding affinity of IgG to FcγRIIIa which is critical for significant improvement in ADCC (41) and ADCP (42), while enzymatic galactosylation also contributes to the optimization of ADCC efficacy (43). Thus, clarifying the mechanism of IgG N-glycome aberration and the function of IgG glycans in cancer may be conducive to deciphering the glyco-code and promoting the development of effective mAbs. In conclusion, by utilizing the high-throughput UPLC method, we showed that the IgG N-glycome profile of EC patients differed from that of healthy females, and observed a significant downregulation of galactosylation and sialylation, in addition to elevated levels of N-glycans with bisecting GlcNAc. We believe this is the first study to report an IgG N-glycome profile as a promising biomarker for the identification of high-risk EC patients, though further verification on a larger sample size is still required. This discovery may facilitate the early detection and assessment of endometrial malignancies and guide individualized treatment in clinical application. Additionally, a comprehensive profiling of IgG N-glycome allows for the identification of those glycan traits which undergo the most prominent alteration in EC patients compared with healthy individuals. An in-depth exploration of the intrinsic relationship among glycomic, genomic, and glycoproteomic aberrations is expected in order to decode underpinning mechanisms, which will ultimately be conducive to the precise and targeted treatment of EC patients.
Supplementary
The article’s supplementary files as
Acknowledgments
We would like to thank the patients and healthy volunteers for participation in the study.
Funding: This work was supported by grants from National Key Research and Development Program of China (2016YFC1302900), the National Natural Science Foundation of China (81974454, 81772770), the Program of Shanghai Hospital Development Center (16CR2001A), the Science and Technology Commission of Shanghai Municipality (18441904800, 17ZR1416700), and the Shanghai Municipal Commission of Health (201940284).
Ethical Statement: The authors are accountable for all aspects of the work in ensuring that questions related to the accuracy or integrity of any part of the work are appropriately investigated and resolved. All patients and healthy volunteers gave informed consent. This study was conducted in accordance with the principles of Declaration of Helsinki (as revised in 2013). Approval of this study was obtained from the Medical Ethics Committee of Ren Ji Hospital, Shanghai Jiao Tong University School of Medicine.
Footnotes
Reporting Checklist: The authors have completed the REMARK reporting checklist. Available at http://dx.doi.org/10.21037/atm-20-3504
Data Sharing Statement: Available at http://dx.doi.org/10.21037/atm-20-3504
Conflicts of Interest: All authors have completed the ICMJE uniform disclosure form (available at http://dx.doi.org/10.21037/atm-20-3504). The authors have no conflicts of interest to declare.
References
- 1.Lortet-Tieulent J, Ferlay J, Bray F, et al. International Patterns and Trends in Endometrial Cancer Incidence, 1978-2013. J Natl Cancer Inst 2018;110:354-61. 10.1093/jnci/djx214 [DOI] [PubMed] [Google Scholar]
- 2.Paucarmayta A, Taitz H, Casablanca Y, et al. TGF-β signaling proteins and CYP24A1 may serve as surrogate markers for progesterone calcitriol treatment in ovarian and endometrial cancers of different histological types. Transl Cancer Res 2019;8:1423-37. 10.21037/tcr.2019.07.36 [DOI] [PMC free article] [PubMed] [Google Scholar]
- 3.Onstad MA, Schmandt RE, Lu KH. Addressing the Role of Obesity in Endometrial Cancer Risk, Prevention, and Treatment. J Clin Oncol 2016;34:4225-30. 10.1200/JCO.2016.69.4638 [DOI] [PMC free article] [PubMed] [Google Scholar]
- 4.Liu H, Zhang W, Wang L, et al. GLI1 is increased in ovarian endometriosis and regulates migration, invasion and proliferation of human endometrial stromal cells in endometriosis. Ann Transl Med 2019;7:663. 10.21037/atm.2019.10.76 [DOI] [PMC free article] [PubMed] [Google Scholar]
- 5.Colombo N, Creutzberg C, Amant F, et al. ESMO-ESGO-ESTRO Consensus Conference on Endometrial Cancer: diagnosis, treatment and follow-up. Ann Oncol 2016;27:16-41. 10.1093/annonc/mdv484 [DOI] [PubMed] [Google Scholar]
- 6.Brooks RA, Fleming GF, Lastra RR, et al. Current recommendations and recent progress in endometrial cancer. CA Cancer J Clin 2019;69:258-79. [DOI] [PubMed] [Google Scholar]
- 7.Reily C, Stewart TJ, Renfrow MB, et al. Glycosylation in health and disease. Nature Reviews Nephrology 2019;15:346-66. 10.1038/s41581-019-0129-4 [DOI] [PMC free article] [PubMed] [Google Scholar]
- 8.Pinho SS, Reis CA. Glycosylation in cancer: mechanisms and clinical implications. Nat Rev Cancer 2015;15:540-55. 10.1038/nrc3982 [DOI] [PubMed] [Google Scholar]
- 9.Stowell SR, Ju T, Cummings RD. Protein glycosylation in cancer. Annu Rev Pathol 2015;10:473-510. 10.1146/annurev-pathol-012414-040438 [DOI] [PMC free article] [PubMed] [Google Scholar]
- 10.Gudelj I, Lauc G, Pezer M. Immunoglobulin G glycosylation in aging and diseases. Cell Immunol 2018;333:65-79. 10.1016/j.cellimm.2018.07.009 [DOI] [PubMed] [Google Scholar]
- 11.Quast I, Keller CW, Maurer MA, et al. Sialylation of IgG Fc domain impairs complement-dependent cytotoxicity. J Clin Invest 2015;125:4160-70. 10.1172/JCI82695 [DOI] [PMC free article] [PubMed] [Google Scholar]
- 12.Vučković F, Theodoratou E, Thaçi K, et al. IgG Glycome in Colorectal Cancer. Clin Cancer Res 2016;22:3078-86. 10.1158/1078-0432.CCR-15-1867 [DOI] [PMC free article] [PubMed] [Google Scholar]
- 13.Ren S, Zhang Z, Xu C, et al. Distribution of IgG galactosylation as a promising biomarker for cancer screening in multiple cancer types. Cell Res 2016;26:963-6. 10.1038/cr.2016.83 [DOI] [PMC free article] [PubMed] [Google Scholar]
- 14.Saldova R, Royle L, Radcliffe CM, et al. Ovarian cancer is associated with changes in glycosylation in both acute-phase proteins and IgG. Glycobiology 2007;17:1344-56. 10.1093/glycob/cwm100 [DOI] [PubMed] [Google Scholar]
- 15.Yi CH, Weng HL, Zhou FG, et al. Elevated core-fucosylated IgG is a new marker for hepatitis B virus-related hepatocellular carcinoma. Oncoimmunology 2015;4:e1011503. 10.1080/2162402X.2015.1011503 [DOI] [PMC free article] [PubMed] [Google Scholar]
- 16.Pucić M, Knezević A, Vidic J, et al. High throughput isolation and glycosylation analysis of IgG-variability and heritability of the IgG glycome in three isolated human populations. Mol Cell Proteomics 2011;10:M111.010090. [DOI] [PMC free article] [PubMed]
- 17.Menni C, Keser T, Mangino M, et al. Glycosylation of immunoglobulin g: role of genetic and epigenetic influences. PloS One 2013;8:e82558. 10.1371/journal.pone.0082558 [DOI] [PMC free article] [PubMed] [Google Scholar]
- 18.Gudelj I, Salo PP, Trbojević-Akmačić I, et al. Low galactosylation of IgG associates with higher risk for future diagnosis of rheumatoid arthritis during 10 years of follow-up. Biochim Biophys Acta Mol Basis Dis 2018;1864:2034-9. [DOI] [PubMed]
- 19.Russell AC, Šimurina M, Garcia MT, et al. The N-glycosylation of immunoglobulin G as a novel biomarker of Parkinson's disease. Glycobiology 2017;27:501-10. 10.1093/glycob/cwx022 [DOI] [PubMed] [Google Scholar]
- 20.Karsten CM, Pandey MK, Figge J, et al. Anti-inflammatory activity of IgG1 mediated by Fc galactosylation and association of FcγRIIB and dectin-1. Nat Med 2012;18:1401-6. 10.1038/nm.2862 [DOI] [PMC free article] [PubMed] [Google Scholar]
- 21.Peschke B, Keller CW, Weber P, et al. Fc-Galactosylation of Human Immunoglobulin Gamma Isotypes Improves C1q Binding and Enhances Complement-Dependent Cytotoxicity. Front Immunol 2017;8:646. 10.3389/fimmu.2017.00646 [DOI] [PMC free article] [PubMed] [Google Scholar]
- 22.Dekkers G, Treffers L, Plomp R, et al. Decoding the Human Immunoglobulin G-Glycan Repertoire Reveals a Spectrum of Fc-Receptor- and Complement-Mediated-Effector Activities. Front Immunol 2017;8:877. 10.3389/fimmu.2017.00877 [DOI] [PMC free article] [PubMed] [Google Scholar]
- 23.Anthony RM, Wermeling F, Karlsson MCI, et al. Identification of a receptor required for the anti-inflammatory activity of IVIG. Proc Natl Acad Sci U S A 2008;105:19571-8. 10.1073/pnas.0810163105 [DOI] [PMC free article] [PubMed] [Google Scholar]
- 24.Schwab I, Nimmerjahn F. Intravenous immunoglobulin therapy: how does IgG modulate the immune system? Nat Rev Immunol 2013;13:176-89. 10.1038/nri3401 [DOI] [PubMed] [Google Scholar]
- 25.Pagan JD, Kitaoka M, Anthony RM. Engineered Sialylation of Pathogenic Antibodies In Vivo Attenuates Autoimmune Disease. Cell 2018;172:564-577.e13. 10.1016/j.cell.2017.11.041 [DOI] [PMC free article] [PubMed] [Google Scholar]
- 26.Iida S, Misaka H, Inoue M, et al. Nonfucosylated therapeutic IgG1 antibody can evade the inhibitory effect of serum immunoglobulin G on antibody-dependent cellular cytotoxicity through its high binding to FcgammaRIIIa. Clin Cancer Res 2006;12:2879-87. 10.1158/1078-0432.CCR-05-2619 [DOI] [PubMed] [Google Scholar]
- 27.Arnold JN, Wormald MR, Sim RB, et al. The impact of glycosylation on the biological function and structure of human immunoglobulins. Annu Rev Immunol 2007;25:21-50. 10.1146/annurev.immunol.25.022106.141702 [DOI] [PubMed] [Google Scholar]
- 28.Benedetti E, Pučić-Baković M, Keser T, et al. Network inference from glycoproteomics data reveals new reactions in the IgG glycosylation pathway. Nat Commun 2017;8:1483. 10.1038/s41467-017-01525-0 [DOI] [PMC free article] [PubMed] [Google Scholar]
- 29.Theodoratou E, Thaçi K, Agakov F, et al. Glycosylation of plasma IgG in colorectal cancer prognosis. Sci Rep 2016;6:28098. 10.1038/srep28098 [DOI] [PMC free article] [PubMed] [Google Scholar]
- 30.Sjöwall C, Zapf J, von Löhneysen S, et al. Altered glycosylation of complexed native IgG molecules is associated with disease activity of systemic lupus erythematosus. Lupus 2015;24:569-81. 10.1177/0961203314558861 [DOI] [PubMed] [Google Scholar]
- 31.Ruhaak LR, Kim K, Stroble C, et al. Protein-Specific Differential Glycosylation of Immunoglobulins in Serum of Ovarian Cancer Patients. J Proteome Res 2016;15:1002-10. 10.1021/acs.jproteome.5b01071 [DOI] [PMC free article] [PubMed] [Google Scholar]
- 32.Kazuno S, Furukawa J-I, Shinohara Y, et al. Glycosylation status of serum immunoglobulin G in patients with prostate diseases. Cancer Med 2016;5:1137-46. 10.1002/cam4.662 [DOI] [PMC free article] [PubMed] [Google Scholar]
- 33.Bondt A, Hafkenscheid L, Falck D, et al. ACPA IgG galactosylation associates with disease activity in pregnant patients with rheumatoid arthritis. Ann Rheum Dis 2018;77:1130-6. [DOI] [PubMed] [Google Scholar]
- 34.Sun D, Hu F, Gao H, et al. Distribution of abnormal IgG glycosylation patterns from rheumatoid arthritis and osteoarthritis patients by MALDI-TOF-MS. Analyst 2019;144:2042-51. 10.1039/C8AN02014K [DOI] [PubMed] [Google Scholar]
- 35.Vučković F, Krištić J, Gudelj I, et al. Association of systemic lupus erythematosus with decreased immunosuppressive potential of the IgG glycome. Arthritis Rheumatol 2015;67:2978-89. 10.1002/art.39273 [DOI] [PMC free article] [PubMed] [Google Scholar]
- 36.Rižner TL. Discovery of biomarkers for endometrial cancer: current status and prospects. Expert Rev Mol Diagn 2016;16:1315-36. 10.1080/14737159.2016.1258302 [DOI] [PubMed] [Google Scholar]
- 37.Li J, Dowdy S, Tipton T, et al. HE4 as a biomarker for ovarian and endometrial cancer management. Expert Rev Mol Diagn 2009;9:555-66. 10.1586/erm.09.39 [DOI] [PMC free article] [PubMed] [Google Scholar]
- 38.Agrawal P, Fontanals-Cirera B, Sokolova E, et al. A Systems Biology Approach Identifies FUT8 as a Driver of Melanoma Metastasis. Cancer cell 2017;31:804-819.e7. 10.1016/j.ccell.2017.05.007 [DOI] [PMC free article] [PubMed] [Google Scholar]
- 39.Li W, Zhu Z, Chen W, et al. Crystallizable Fragment Glycoengineering for Therapeutic Antibodies Development. Front Immunol 2017;8:1554. 10.3389/fimmu.2017.01554 [DOI] [PMC free article] [PubMed] [Google Scholar]
- 40.Chang MM, Gaidukov L, Jung G, et al. Small-molecule control of antibody N-glycosylation in engineered mammalian cells. Nat Chem Biol 2019;15:730-6. 10.1038/s41589-019-0288-4 [DOI] [PubMed] [Google Scholar]
- 41.Shinkawa T, Nakamura K, Yamane N, et al. The absence of fucose but not the presence of galactose or bisecting N-acetylglucosamine of human IgG1 complex-type oligosaccharides shows the critical role of enhancing antibody-dependent cellular cytotoxicity. J Biol Chem 2003;278:3466-73. 10.1074/jbc.M210665200 [DOI] [PubMed] [Google Scholar]
- 42.Reusch D, Tejada ML. Fc glycans of therapeutic antibodies as critical quality attributes. Glycobiology 2015;25:1325-34. 10.1093/glycob/cwv065 [DOI] [PMC free article] [PubMed] [Google Scholar]
- 43.Aoyama M, Hashii N, Tsukimura W, et al. Effects of terminal galactose residues in mannose α1-6 arm of Fc-glycan on the effector functions of therapeutic monoclonal antibodies. mAbs 2019;11:826-36. 10.1080/19420862.2019.1608143 [DOI] [PMC free article] [PubMed] [Google Scholar]
Associated Data
This section collects any data citations, data availability statements, or supplementary materials included in this article.
Supplementary Materials
The article’s supplementary files as


