

Abstract
Because of their size (1–10 μm), microbubble-based drug delivery agents suffer from confinement to the vasculature, limiting tumor penetration and potentially reducing the drug efficacy. Nanobubbles (NBs) have emerged as promising candidates for ultrasound-triggered drug delivery because of their small size, allowing drug delivery complexes to take advantage of the enhanced permeability and retention effect. In this study, we describe a simple method for production of nested-nanobubbles (Nested-NBs) by encapsulation of NBs (∼100 nm) within drug-loaded liposomes. This method combines the efficient and well-established drug-loading capabilities of liposomes while utilizing NBs as an acoustic trigger for drug release. Encapsulation was characterized using transmission electron microscopy with an encapsulation efficiency of 22 ± 2%. Nested-NBs demonstrated echogenicity using diagnostic B-mode imaging, and acoustic emissions were monitored during high-intensity focused ultrasound (HIFU) in addition to monitoring of model drug release. Results showed that although the encapsulated NBs were destroyed by pulsed HIFU [peak negative pressure (PNP) 1.54–4.83 MPa], signified by loss of echogenicity and detection of inertial cavitation, no model drug release was observed. Changing modality to continuous wave (CW) HIFU produced release across a range of PNPs (2.01–3.90 MPa), likely because of a synergistic effect of mechanical and increased thermal stimuli. Because of this, we predict that our NBs contain a mixed population of both gaseous and liquid core particles, which upon CW HIFU undergo rapid phase conversion, triggering liposomal drug release. This hypothesis was investigated using previously described models to predict the existence of droplets and their phase change potential and the ability of this phase change to induce liposomal drug release.
Keywords: nanobubbles; liposome; ultrasound; drug delivery; triggered release; phase change, droplets
1. Introduction
Chemotherapy, in combination with surgery or radiotherapy, is one of the primary treatment methods for malignant tumors and can significantly increase patient survival rates. However, treatment efficacy is currently limited by the negative side effects and drug resistance present during systemic delivery.1 The ability to target and locally deliver chemotherapeutics would help to reduce toxic side effects but also increase drug efficacy and treatment effectiveness. Drug-loaded liposomes, such as Doxil and Onivyde, reduce the exposure of healthy tissues to drug and are currently approved for clinical use. However, because of the lack of a triggered release mechanism in addition to hepatic and renal clearance, drug efficacy is not maximized.2 Methods for triggering release using mechanical and thermal approaches such as ultrasound (US)3 and near-infrared lasers4 are currently being developed for improving controlled local release. The use of US is appealing because of its widespread availability, noninvasive nature and potential for image guidance during treatment. US imaging utilizes high-frequency sound waves that propagate through the tissue, using the back-scattered waves to construct an image. Microbubbles (MBs) are commonly used as ultrasound contrast agents (UCAs) because of their high acoustic impedance mismatch with the surrounding tissue, while their size of 1–10 μm allows facile circulation through the vasculature. MB stability is enhanced by using high-molecular-weight, low-solubility gases such as perfluorocarbons5 or sulfur hexafluoride (SF6),6 as well as a coating, typically a phospholipid monolayer, a protein, or a polymer.7−9 Recently, research has focused on the potential use of MBs as theranostic agents.10,11 MBs driven by an US field can enhance sonoporation in cell membranes, which has been shown to increase drug uptake.9,12−14 Therapeutics can be incorporated with MBs in multiple ways including therapeutic gas,15 direct attachment of drugs to the lipid shell,16 and attachment of drug-filled liposomes,17−19 which can be released by increasing the US intensity. Surface functionalization of the MB shells can be used to provide molecular targeting17 and improved stealth properties.20 However, to increase tumor biodistribution and take advantage of the enhanced permeation and retention effect provided by the leaky vasculature, the drug delivery complex should be <400 nm.21,22 As such, nanobubbles (NBs), submicron bubbles of typically 200–600 nm in diameter,23,24 are an attractive prospect for drug delivery and have shown increased tumor accumulation and retention compared to MBs.25,26 We have previously reported the production and characterization of NBs using microfluidics27 with others using methods such as mechanical agitation and sonication.28−30 The inverse relationship between Laplace pressure and bubble radius leads to predicted lifetimes on the order of microseconds.31,32 In spite of this, NBs have demonstrated remarkable stability,27,33,34 which has raised speculation as to their physical state and the nature of stabilization.31,32,35,36 NBs provide US contrast enhancement at frequencies below their resonance and hence provide promise for diagnostic use.37,38 Further, they have also been used for the delivery of therapeutics either by co-delivery39 or by direct incorporation of their payload.26,29,40,41
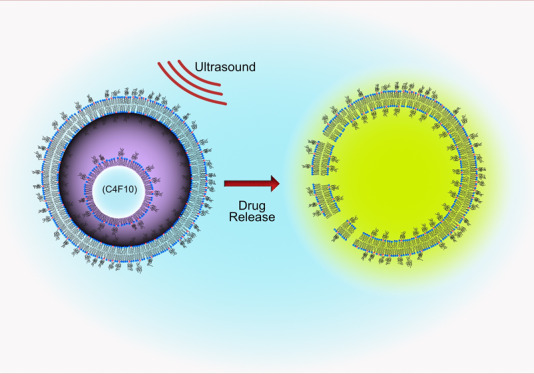
In this paper, we introduce Nested-Nanobubbles (Nested-NBs) as submicron US-triggered drug delivery vehicles. Nested-NBs consist of an outer liposomal shell containing both the encapsulated drug payload and one or more NBs that can act as internal nuclei for an US-triggered release. The NBs were produced using microfluidics27 and encapsulated together with calcein within liposomes via thin-film rehydration. Encapsulation of NBs was demonstrated using transmission electron microscopy (TEM), and Nested-NB echogenicity was characterized using clinical B-mode ultrasound imaging, which subsequently decreased after the high-intensity focused ultrasound (HIFU) trigger. Nested-NBs were loaded with calcein to act as a model drug, and for pulsed HIFU exposures, no release was observed. However, the use of a continuous wave (CW) US exposure triggered calcein release for a free-field peak negative pressure (PNP) ranging from 2.01 ± 0.10 MPa to 3.90 ± 0.10 MPa. Our results suggest that the release mechanism is a synergistic effect of mechanical and thermal stimuli and that our NB populations contain a mixture of particles, both their gaseous and liquid phases, the latter of which undergo a low-pressure phase change. This drug delivery vehicle provides the acoustic diagnostic properties of NBs combined with the therapeutic advantages offered by liposomes and with the additional benefit of an external triggered release mechanism.
2. Methods
2.1. Microfluidic Production of NBs and MBs
NBs and MBs were prepared from a mixture of DPPC (1,2-dipalmitoyl-sn-glycero-3-phosphocholine) and DPSE-PEG2000 (1,2-distearoyl-sn-glycero-3-phosphoethanolamine-N-[methoxy(polyethylene glycol)-2000]) in a 95:5 molar ratio and a total lipid concentration of 2 mg/mL (Avanti Polar Lipids, AL, USA). Lipids were dissolved in a 1:1 mixture of chloroform and methanol and dried under nitrogen to remove the solvent and subsequently resuspended in phosphate-buffered saline (PBS) solution containing 1% (v/v) glycerol. The lipid solution was then combined with C4F10 (PFB) gas in a multiplexed microspray microfluidic device for bubble production as described in Peyman et al.27
2.2. NB Isolation
NBs were passively isolated from MBs via flotation because of intrinsic MB buoyancy. A spherical bubble in a medium has an ascension velocity described by the Hadamard–Rybczynski equation (eq 1).42 For a PFB bubble with a radius of 1 μm, it would take 47 min to travel 1 cm. For a bubble in the same medium with a radius of 75 nm, it would take 840 min to travel the same distance and as such can be regarded as neutrally buoyant. After 1 h, a syringe and a fine needle were used to remove the NB sample from the bottom of the vial and subsequently filtered through a 800 nm polytetrafluoroethylene (PTFE) membrane to remove any large bubbles.
| 1 |
where U is the ascension velocity, g is the gravitational acceleration (9.81 ms–1), R is the radius, Δρ is the difference in density between the medium and the core, μ is the dynamic viscosity of water (8.9 × 10⁻⁴ Pa s), and μ′ is the dynamic viscosity of C4F10 (1.2 × 10⁻⁵ Pa s).
2.3. NB Size and Concentration Determination
2.3.1. Nanoparticle Tracking Analysis
Single-particle tracking was used to analyze NB populations using the NanoSight nanoparticle tracking analysis (NTA) (NanoSight NS300, Malvern Panalytical, UK). Samples were illuminated with a 488 nm laser, and individual particles were tracked using NTA 3.3 software. The samples were diluted (1:1000) in PBS prior to measurement, and measurements were repeated in triplicate.
2.3.2. Resonant Mass Measurement
Resonant mass measurement (RMM) (Archimedes, Malvern Panalytical, UK) was used to demonstrate and analyze the populations of positively buoyant (bubbles) and negatively buoyant particles in NB solutions. Archimedes was equipped with a MicroH sensor capable of measuring particle diameters between 150 and 5000 nm and precalibrated with 1 μm polystyrene beads (ThermoScientific Microsphere Size Standards 4010A). The samples were diluted (1:500) in PBS prior to measurements. During the measurement, the NB sample was loaded initially for 120 s and analyzed at pressures of 3, 2, and 3 psi for determining the sample, reference, and experiment values. The limit of detection was set to 25 mHz to provide consistency for all measurements. Particle densities were set to 0.0112 and 1.3 g/mL for positively buoyant and negatively buoyant particles, respectively, corresponding to the density of PFB gas and lipid vesicles.43
2.4. Liposome and Nested-NB Production
A combination of DSPC (1,2-distearoyl-sn-glycero-3-phosphocholine), cholesterol, and DSPE-PEG2000 was dried under nitrogen in round-bottom flasks in a 63:32:5 molar ratio at a total lipid concentration of 15 mg/mL. The lipid film was resuspended in either PBS buffer for liposome production or with NBs at the stock concentration for Nested-NB production and rehydrated via stirring for 1 h. For calcein loading, the solution pH was adjusted using 10 M NaOH to pH 10.5, and calcein was added to a final concentration of 100 mM prior to rehydration. Rehydrated lipid solution was homogenized via extrusion by passing through a 400 nm PTFE membrane. Free calcein and NBs were removed via centrifugation at 17,000g for 20 min and washed with PBS; centrifugation and washing were repeated once (Scheme 1).
Scheme 1. Preparation of Nested-NBs by Isolation of NBs via Buoyancy, Thin-Film Rehydration of a Lipid Film and Cleaning via Centrifugation.

2.5. Transmission Electron Microscopy
For TEM, samples were prepared in a phosphate-free buffer, and 5 μL of the sample was pipetted onto glow-discharged carbon grids. After 30 s of incubation, the sample was washed with buffer, and 5 μL of 1% uranyl acetate was added for 30 s, then removed, and left to air-dry. Images were taken at a range of magnifications ranging from 11,000 to 46,000× using a transmission electron microscope (FEI Tecnai T12, USA). Images were analyzed manually using ImageJ (NIH, USA) to determine the particle diameter.
2.6. Encapsulation and Release Efficiency
Fluorescence spectroscopy was used to quantify the release of calcein from within Nested-NBs and liposomes from ultrasound exposures. Because of the high concentration of encapsulated calcein within the liposomes, calcein fluorescence was initially quenched. However, when released from the liposome into the bulk medium, calcein concentration decreases and fluorescence subsequently unquenches. Nested-NB and liposome samples were diluted (1:25) in PBS to increase the sensitivity of the fluorescence assay. Sample fluorescence was measured using a microplate reader (SpectraMax M2E, Molecular Devices, USA) with excitation and emission wavelengths of 460 and 515 nm, respectively. Nested-NB and LS sample fluorescence was measured for nonexposed samples (negative control), exposed samples, and samples lysed with 0.1% Triton-X (positive control) to calculate the percentage of calcein released from the samples. Percentage release was calculated by eq 2, where FLHIFU, FL+control, and FL–control are the fluorescence intensities for HIFU-exposed, positive, and negative control samples, respectively.
| 2 |
2.7. Ultrasound Imaging
B-mode diagnostic US images of NB and Nested-NB populations were produced using a 3–8 MHz linear array probe (V-Scan, GE Healthcare, IL, USA). The samples were imaged in a wall-less agar flow phantom, produced by mixing 3% of mass agar and 8% of mass glycerol with degassed water.44 The mixture was heated in a microwave and manually stirred intermittently until a homogenous solution was produced. The mixture was poured into a three-dimensional printed mold containing a 4 mm outer diameter tube and left to cool. The tube was removed after the agar had set, and Luer lock fittings were attached for sample loading. Mean grayscale intensity (MGI) of B-mode images was calculated in the region of interest (ROI) using MATLAB (Mathworks Inc, USA).
2.8. HIFU and Passive Cavitation Detection
A single-element HIFU transducer was used for US-mediated NB destruction. A 1.1 MHz center frequency HIFU transducer (H-102, Sonic Concepts, USA) was used for all HIFU experiments. The transducer was connected to a +55 dB power amplifier (A300, E&I Ltd, USA) via an impedance matching circuit. A computer-controlled function generator (33220A, Agilent, USA) was used to provide sinusoidal burst cycles to the transducer. The free-field pressure was measured using a membrane hydrophone (Precision Acoustic Ltd, Dorchester, UK) with a 400 μm sensitive element, calibrated by the National Physics Laboratory (Middlesex, UK).45 All pressures stated are based from their free-field calibrations with errors of ±0.1 MPa. The HIFU transducer was coupled to the sample using a coupling cone containing degassed Milli-Q water. A TTL digital delay pulse generator (9524, Quantum Composers, MT, USA) was used to synchronize the HIFU pulse and data acquisition system. A broad-band-focused detection (Y-102, Sonic Concepts, WA, USA) was positioned in the central aperture of the HIFU transducer and coaligned with its focal region. It was connected to a 5 MHz high pass filter (Allen Avionics, USA) and a 40 dB preamplifier (Spectrum GmbH, Germany). A 14-bit data acquisition (DAQ) card (M4i.4420-x8, Spectrum GmbH, Germany) was used to record acoustic emissions. A desktop PC was used to control all hardware and postprocessing using MATLAB. For each HIFU pulse, 163 μs of cavitation data was recorded and fast Fourier transformed into the frequency domain. Frequency data were comb-filtered to remove harmonics, leaving only broad-band emissions.46 Additionally, the inverse comb filter was applied to remove broad-band emissions, leaving only ultraharmonic emissions. Data were recorded for 0.5 s on either side of the 5 s HIFU exposure with initial values before HIFU was used as a noise baseline. To maximize the magnitude of acoustic emissions, the concentrations of Nested-NBs and liposomes were maintained as high as possible while remaining constant between the two samples at 1.56 × 10¹¹ particles/mL.
3. Results and Discussion
3.1. NB Characterization
NBs were produced using the microfluidic microspray approach and separated from the MBs by floatation of the MBs and collection of the subnatent. NB populations were characterized using three separate techniques: NTA, RMM, and TEM. Using NTA, the NB concentration and size, measured across five sample preparations, were found to be 5.79 ± 0.66 × 10¹¹/mL, with a modal size of 106 ± 4 nm (Figure 1a). NBs were also analyzed using RMM (Figure 1b), a technique that can distinguish between positively buoyant particles (i.e., ones that are less dense than the solution) and negatively buoyant particles (i.e., denser than the solution). RMM also measures the size and concentration of the positively and negatively buoyant particles. The average concentrations and sizes measured from three separate samples were found to be 1.17 ± 0.68 × 10⁹/mL and 3.54 ± 1.20 × 10⁹/mL with respective modal sizes of 212 ± 12 nm and 321 ± 32 nm for the positively and negatively buoyant particles, respectively (Figure 1b). The negatively buoyant population likely consists of a combination of lipid particles that were not converted into bubbles as well as potentially containing PFB droplets, which due to their small size have condensed from a gas into liquid PFB droplets. However, the limit of detection of the RMM system was around 200 nm, thus failing to determine the nature of the particles, making up the largest contribution to the NTA data circa 100 nm. Additionally, NBs were imaged using TEM, and their size distribution was analyzed. A total of 252 NBs across 31 images were counted, and their sizes were analyzed, demonstrating a log-normal distribution with a size of 120 ± 48 nm (Figure 1c), with a representative TEM image shown in Figure 1d. A small proportion of <100 nm particles was measured via TEM, again likely to be lipid vesicles or PFB droplets below the detection threshold for both NTA and RMM analyses. Comparison between the three measurement techniques used shows agreement between both NTA and TEM results, in terms of their respective modal sizes and the population distributions. However, for RMM, the limit of detection is higher than that of the modal particle size; thus, a large proportion of the NB population is likely missing. Notwithstanding this, RMM is still useful for confirming the presence of submicron bubbles, as opposed to just particles.
Figure 1.

Characterization of NBs using (a) NTA, (b) RMM showing both [b(i)] positively and [b(ii)] negatively buoyant particles, and (c) TEM with a representative image shown in (d).
NBs were imaged using B-mode imaging (3–8 MHz broad band, linear array, MI = 0.8) using a flow phantom to assess their echogenicity at clinically relevant imaging parameters. The NB concentration was measured via NTA and diluted to concentrations of ∼109 to 1011 NBs/mL–1 to determine contrast enhancement across a range of concentrations. MGI of the B-mode images was measured in the ROI of the flow phantom (as shown in Figure 2a(i)) for each concentration and showed a linear increase in MGI with increasing concentration (Figure 2a(ii)). It is also notable that the MI used for this experiment was larger than that typically used for micron-scale UCAs (<0.3), as greater than this typically induces MB destruction. However, NBs were stable during imaging experiments.
Figure 2.

[a(i)] Representative clinical frequency B-mode (3–8 MHz linear array, MI = 0.8) images of NBs and PBS in a flow phantom and [a(ii)] change in MGI for NBs with varying concentrations. (b) MGI of B-mode images of the NB sample after application of HIFU with varying PNP. (c) Concentration of negatively buoyant and positively buoyant particles before and after HIFU exposure at a PNP of 4.83 MPa with 1% duty cycle, measured via RMM.
NBs were also exposed to HIFU, and the B-mode MGI was measured prior to and post-exposure to determine whether NB destruction had been achieved. The PNP was varied between 1.06 and 6.75 MPa using a PRF of 1 kHz and 1% duty cycle for a total of 5 s. MGI decreased exponentially with increasing pressure reaching a minimum MGI after exposure at 4.83 MPa (Figure 2b). NB destruction was also demonstrated using RMM, where positively buoyant particle concentration decreased by an order of magnitude, from 4.38 × 10⁸ to 3.24 × 10⁷ NBs/mL after HIFU exposure. The negatively buoyant particle concentration remained unchanged (Figure 2c). Full population distributions before and after HIFU exposure are shown in Figure S1.
3.2. Nested-NB Production and Characterization
Nested-NBs were produced by passive encapsulation of the NBs inside the phospholipid liposomes. Calcein loaded at a concentration to give self-quenching was also encapsulated to simulate a model small-molecule drug. After encapsulation, free calcein and small particles (<200 nm), believed to be a combination of both unencapsulated NBs and empty liposomes, were removed by centrifugation, as described in Section 2.4. The population distribution of the Nested-NBs post-cleaning is shown in Figure 3a. After cleaning, the Nested-NBs mean size increased from 182.6 ± 0.2 to 318.9 ± 7.1 nm, and there was a concomitant decrease in concentration from 1.82 ± 0.09 × 10¹² to 2.45 ± 0.10 × 10¹¹ particles/mL (Figure S2). Additionally, after cleaning, the MGI of B-mode images of Nested-NBs decreased from 30.5 ± 1.9 to 11.3 ± 0.7 as would be expected with the removal of free NBs (Figure S3).
Figure 3.

Nested-NB population distribution measured by (a) NTA and (b) TEM, showing distribution for both the Nested-NB and the encapsulating liposome. (c,d) Representative TEM images of Nested-NBs showing two individual Nested-NBs and a larger field of view, respectively.
The efficiency of NB encapsulation, within Nested-NBs, was determined using TEM. A total of 124 individual liposomes were analyzed across 38 images, with 22 ± 2% of liposomes encapsulating single or multiple NBs. On an average, each Nested-NB contained 1.29 ± 0.01 NBs. The Nested-NB size distribution measured via TEM is shown in Figure 3b, with populations for both their outer liposomal shell and encapsulated NBs analyzed. Representative images are shown in Figure 3c,d, demonstrating clear encapsulation of a nesting particle within an outer liposomal shell. Population distributions followed a normal distribution with modal sizes of nesting particles and liposomes at 140 ± 69 and of 251 ± 130 nm, respectively.
3.3. US-Triggered Release
Nested-NBs were exposed to HIFU to provide a mechanism for triggered NB destruction and subsequent payload release. Initially, Nested-NBs and liposome-only controls were insonated at free-field PNPs of 1.54, 2.96, and 4.83 MPa for a total of 5 s with duty cycles of either 1 or 50%. The release profiles are shown in Figure 4a,b respectively. At these exposure parameters, no significant calcein release was observed from Nested-NBs compared to liposome-only controls. To determine whether these exposures were inducing destruction of the encapsulated NBs, Nested-NBs were imaged using B-mode ultrasound before and after HIFU exposure. Nested-NBs initially demonstrated echogenicity, which after insonation at 4.83 MPa at 50% duty cycle decreased by 92.4 ± 5.6% from 60.3 ± 2.4 to 4.6 ± 0.8 (a.u.), suggesting NB destruction (Figure 4b inset).
Figure 4.

Release profiles for Nested-NBs and liposome controls after ultrasound exposure at PNPs ranging from 1.54 to 4.83 MPa at (a) 1% duty cycle and (b) 50% duty cycle. Inset: MGI of B-mode imaging of Nested-NBs before and after HIFU exposure at 4.83 MPa at 50% duty cycle.
The lack of observed release from HIFU-mediated NB destruction led us to further investigate the interaction between Nested-NBs and the applied HIFU field. Passive cavitation detection (PCD) was used to observe acoustic emissions during insonation. Nested-NB, liposome, and PBS samples were each exposed to HIFU at the previously described parameters. Acoustic emissions were converted into the frequency domain by fast Fourier transform and the magnitude of the broad-band noise and ultraharmonic emissions were determined to quantify the occurrence of inertial cavitation (bubble destruction) and stable cavitation (bubble oscillation). Because of the high PNP, NB destruction was expected to occur during the initial pulse cycles of the HIFU exposure. To quantify the change in the magnitude of acoustic emissions over time, broad-band and ultraharmonic emissions were cumulatively integrated with increasing pulse number and then normalized per pulse. Full temporal emissions for the whole exposure duration are shown in Figure S4. For both broadband (Figure 5a) and ultraharmonic (Figure 5b) emissions, Nested-NBs demonstrate increased activity at the beginning of the exposure, which decreased with increasing pulse number to the value found for nonacoustically active liposomes. This suggests that the NBs present initially in the Nested-NB sample provide an increase in both broadband and harmonic emissions, as NBs undergo stable and inertial cavitation. As the HIFU exposure progresses, the broadband and harmonic emissions decrease until eventually by the end of the exposure. The Nested-NB and liposome samples are indistinguishable from each other, with no NBs remaining. This is also in agreement with the near-total loss of contrast shown by B-mode imaging (Figure 4b). Both Nested-NB and liposome samples demonstrated increased broadband and harmonic emissions compared to a PBS control, likely due to nonacoustically active liposomes providing cavitation nuclei. The relatively high value of the PBS control can be attributed to a combination of both cavitation induced within the solution and acoustic reflections from the sample holder because of the relatively high PNP. Because of the lack of release observed from Nested-NBs, it is possible that the detected inertial cavitation is occurring in the bulk solution or that the encapsulated NBs are being destroyed but not capable of inducing drug release.
Figure 5.

(a) Normalized broadband emissions and (b) normalized ultraharmonic emissions measured using PCD during insonation at 4.83 MPa and 50% duty cycle for Nested-NBs, liposomes, and PBS samples. Data show the acoustic emissions integrated over the number of pulses and then normalized per pulse.
By changing the modality of the HIFU exposure from pulsed to CW, we found that Nested-NBs showed calcein release for PNPs ranging from 2.01 to 3.90 MPa with an exposure time of 5 s. Figure 6a shows the release profiles for both Nested-NBs (solid) and liposomes (hashed). The amount of release increased with increasing PNP for both samples up to a maximum Nested-NB release of 52.9 ± 10.3% with a corresponding liposome-only release of 35.3 ± 9.2%. Considering only the difference in release between Nested-NBs and liposomes, a maximum difference of 26.2 ± 10.3% was achieved at 2.96 MPa (Figure 6b). The difference in release is comparable to the encapsulation efficiency of NBs within Nested-NBs (22 ± 2%), which would suggest that the efficacy of release of the Nested-NB is approaching 100%. Increasing the PNP further led to a decrease in the difference in the release profiles. For the Nested-NB sample, any release observed above that of the NB encapsulation efficiency would likely be attributed to thermally induced release. Additionally, because no release was previously observed with pulsed HIFU exposures (Figure 4), the ability of CW HIFU to induce release is helpful in identifying the release mechanism. Although NBs are present in the Nested-NB sample, RMM (Figure 1b) identified that 79 ± 4% of the population concentration consists of negatively buoyant particles. As such, it is reasonable to assume that a similar proportion of encapsulated particles within the Nested-NBs would be negatively buoyant. Additionally, because the modal size of encapsulated particles (∼140 nm) is less than the limit of detection of RMM (∼200 nm), the existence of bubbles of this size cannot be confirmed. Because of the inverse relationship between the Laplace pressure and bubble radius (eq 3), in addition to the density of the PFB gas core used in our experiments, it is increasingly likely that as particle size decreases, a subpopulation of PFB droplets would exist.
| 3 |
where ΔP is the pressure difference between the inside and outside of the particle, σ is the surface tension of the interface, and r is the particle size.
Figure 6.

(a) Release profile of Nested-NBs and liposome controls after CW HIFU exposure at PNPs ranging from 2.01 to 3.90 MPa. (b) Difference in the release of Nested-NBs compared to liposome controls.
The bulk boiling point of PFB is −1.7° C; however, confinement into either a bubble or a droplet will elevate this boiling temperature because of the associated pressure increase. This elevation can be described by the Clausius–Clapeyron relation modified to include the Laplace effect as given in eq 4.47
| 4 |
where T1 is the elevated boiling temperature, T0 is the boiling point (271.4 K) at atmospheric pressure P0 (101.3 kPa), Mw is the molecular weight of PFB (238.03 g/mol), ΔvapH is the enthalpy of vaporization (100 kJ/kg), σ is the surface tension, and rd is the droplet radius.
The predicted elevated boiling temperature for PFB particles of varying diameter is shown in Figure 7a for surface tensions ranging from 5 to 20 mN/m, covering expected values for fluorocarbon droplets and bubbles.49 For PFB particles at room temperature with diameters between 100 and 200 nm, the majority of particles lie below the vaporization curve and would be expected to exist as liquid droplets. Previous work in our group has also shown that our NB sample experiences a rapid increase in size, measured via dynamic light scattering, when heated above a threshold temperature of 57 °C, suggesting the occurrence of a phase transition from liquid to gas.27 This transition temperature matches closely to the predicted value in Figure 7a for a surface tension of 10–15 mN/m. Additionally, we see that the predicted vaporization temperature for these values lies within the range of temperatures measured during our CW HIFU release exposures (Figure S5), supporting the hypothesis of a phase-change release trigger.
Figure 7.

(a) Vaporization temperature of a PFB droplet with varying surface tension calculated using the Clausius–Clapeyron relationship (Eq 4). (b) Predicted final bubble diameter after vaporization of a PFB droplet comparing three models documented from ref.48
To determine whether droplet vaporization would be capable of inducing liposomal drug release, a model developed by Evans et al.48 was used to predict the expected diameter increase of the resultant bubble post-vaporization. There are three models with increasing complexity, which we have labeled elementary, developed, and intermediate. Briefly, the developed model accounts for a change in solubility of the core after vaporization, whereas the elementary model neglects this. The intermediate model adds additional complexity by assuming partial equilibration of the core with a surrounding region around the particle. The predicted bubble size postvaporization is shown in Figure 7b for all the three models, assuming a droplet surface tension of σd = 10 mN/m and bubble surface tension of σb = 20 mN/m. For droplets of 100–200 nm diameter, all models produced similar results with an expected bubble diameter postvaporization of >300 nm, that is, larger than the modal size of our encapsulating liposomes, which suggests that this expansion is capable of releasing the encapsulated payload.
4. Conclusions
This study demonstrated the diagnostic and therapeutic potential of Nested-NBs. Perfluorobutane (PFB) NBs were co-loaded with the model drug into liposomes of less than 300 nm in diameter. The resultant Nested-NBs displayed good echogenicity at clinically relevant imaging frequencies (3–8 MHz). The triggered release was investigated using continuous and pulsed HIFU. Pulsed HIFU led to NB destruction but did not lead to significant drug release. In contrast, CW HIFU produced drug release across a range of PNPs. We can understand our observations if, at room temperature, our Nested-NBs contain a mix of both encapsulated PFB NBs and PFB droplets. During CW HIFU, the sample temperature was also found to increase above a predicted threshold such that the PFB droplets underwent a phase change from the liquid to gas state. The subsequent increase in their diameter, by a factor of 3, led to liposome rupture and drug release. Thus, Nested-NBs have both diagnostic potential, providing contrast enhancement for clinically relevant ultrasound frequencies, and the ability to trigger drug release through the vaporization of PFB droplets.
Acknowledgments
The authors would like to acknowledge the following funders: Medical Research Council (MR/M009084/1) and Engineering and Physical Sciences Research Council (EP/P023266/1 and EP/S001069/1). S.D.E. is supported by the National Institute for Health Research infrastructure at Leeds. The views expressed are those of the author(s) and not necessarily those of the National Health Service, the National Institute for Health Research, or the Department of Health. D.V.B.B. thanks K. de Silva for support through the provision of an Alumni PhD scholarship. The authors acknowledge the Wellcome Trust for funding toward the TEM facilities (090932/Z/09/Z). The authors would like to thank Malvern Instruments for providing access to the Archimedes RMM system and specifically Judith Hadley and Robert Coyne for technical assistance. The data used in the figures of this paper are available at https://doi.org/10.5518/789.
Supporting Information Available
The Supporting Information is available free of charge at https://pubs.acs.org/doi/10.1021/acsami.0c07022.
RMMs of NB populations before and after HIFU; change in B-mode intensity after cleaning of Nested-NBs; NTA populations and TEM images before and after cleaning of Nested-NBs; broad-band and harmonic emissions for total duration of HIFU exposure for Nested-NBs, liposomes, and PBS; and maximum sample temperature measured during HIFU exposure (PDF)
Author Contributions
D.V.B.B. performed the research, analyzed the data, and wrote the manuscript. J.R.M. assisted with the experimental procedure for HIFU and PCD experiments including the analysis tools. R.H.A.-S., P.L.C., S.A.P., J.R.M., and S.D.E. helped to design the experimental plan, analyze the data, and write the manuscript.
The authors declare no competing financial interest.
Supplementary Material
References
- Shapiro C. L.; Recht A. Side Effects of Adjuvant Treatment of Breast Cancer. N. Engl. J. Med. 2001, 344, 1997–2008. 10.1056/NEJM200106283442607. [DOI] [PubMed] [Google Scholar]
- Luo R.; Li Y.; He M.; Zhang H.; Yuan H.; Johnson M.; Palmisano M.; Zhou S.; Sun D. Distinct Biodistribution of Doxorubicin and the Altered Dispositions Mediated by Different Liposomal Formulations. Int. J. Pharm. 2017, 519, 1–10. 10.1016/j.ijpharm.2017.01.002. [DOI] [PubMed] [Google Scholar]
- Klibanov A. L.; Shevchenko T. I.; Raju B. I.; Seip R.; Chin C. T. Ultrasound-Triggered Release of Materials Entrapped in Microbubble-Liposome Constructs: A Tool for Targeted Drug Delivery. J. Controlled Release 2010, 148, 13–17. 10.1016/j.jconrel.2010.07.115. [DOI] [PMC free article] [PubMed] [Google Scholar]
- Wu G.; Mikhailovsky A.; Khant H. A.; Fu C.; Chiu W.; Zasadzinski J. A. Remotely Triggered Liposome Release by Near-Infrared Light Absorption via Hollow Gold Nanoshells. J. Am. Chem. Soc. 2008, 130, 8175–8177. 10.1021/ja802656d. [DOI] [PMC free article] [PubMed] [Google Scholar]
- Kok M. P.; Segers T.; Versluis M. Bubble Sorting in Pinched Microchannels for Ultrasound Contrast Agent Enrichment. Lab Chip 2015, 15, 3716–3722. 10.1039/c5lc00370a. [DOI] [PubMed] [Google Scholar]
- Owen J.; Grove P.; Rademeyer P.; Stride E.; Owen J.; Grove P.; Rademeyer P.; Stride E. The Influence of Blood on Targeted Microbubbles. J. R. Soc., Interface 2014, 11, 2014062. 10.1098/rsif.2014.0622. [DOI] [PMC free article] [PubMed] [Google Scholar]
- Sirsi S. R.; Borden M. A. Microbubble Compositions, Properties and Biomedical Applications. Bubble Sci., Eng., Technol. 2009, 1, 3–17. 10.1179/175889709X446507. [DOI] [PMC free article] [PubMed] [Google Scholar]
- Lee M.; Lee E. Y.; Lee D.; Park B. J. Stabilization and Fabrication of Microbubbles: Applications for Medical Purposes and Functional Materials. Soft Matter 2015, 11, 2067–2079. 10.1039/C5SM00113G. [DOI] [PubMed] [Google Scholar]
- van Rooij T.; Skachkov I.; Beekers I.; Lattwein K. R.; Voorneveld J. D.; Kokhuis T. J. A.; Bera D.; Luan Y.; van der Steen A. F. W.; de Jong N.; Kooiman K. Viability of Endothelial Cells after Ultrasound-Mediated Sonoporation: Influence of Targeting, Oscillation, and Displacement of Microbubbles. J. Controlled Release 2016, 238, 197–211. 10.1016/j.jconrel.2016.07.037. [DOI] [PubMed] [Google Scholar]
- Kooiman K.; Vos H. J.; Versluis M.; De Jong N. Acoustic Behavior of Microbubbles and Implications for Drug Delivery. Adv. Drug Delivery Rev. 2014, 72, 28–48. 10.1016/j.addr.2014.03.003. [DOI] [PubMed] [Google Scholar]
- Browning R.; Stride E. Microbubble-Mediated Delivery for Cancer Therapy. Fluids 2018, 3, 74. 10.3390/fluids3040074. [DOI] [Google Scholar]
- Kooiman K.; Foppen-Harteveld M.; Der Steen A. F. W. v.; De Jong N. Sonoporation of Endothelial Cells by Vibrating Targeted Microbubbles. J. Controlled Release 2011, 154, 35–41. 10.1016/j.jconrel.2011.04.008. [DOI] [PubMed] [Google Scholar]
- Lentacker I.; De Cock I.; Deckers R.; De Smedt S. C.; Moonen C. T. W. Understanding Ultrasound Induced Sonoporation: Definitions and Underlying Mechanisms. Adv. Drug Delivery Rev. 2014, 72, 49–64. 10.1016/j.addr.2013.11.008. [DOI] [PubMed] [Google Scholar]
- McLaughlan J.; Ingram N.; Smith P. R.; Harput S.; Coletta P. L.; Evans S.; Freear S. Increasing the Sonoporation Efficiency of Targeted Polydisperse Microbubble Populations Using Chirp Excitation. IEEE Trans. Ultrason., Ferroelect., Freq. Contr. 2013, 60, 2511–2520. 10.1109/TUFFC.2013.2850. [DOI] [PubMed] [Google Scholar]
- Fix S. M.; Borden M. A.; Dayton P. A. Therapeutic Gas Delivery via Microbubbles and Liposomes. J. Controlled Release 2015, 209, 139–149. 10.1016/j.jconrel.2015.04.027. [DOI] [PubMed] [Google Scholar]
- Nesbitt H.; Sheng Y.; Kamila S.; Logan K.; Thomas K.; Callan B.; Taylor M. A.; Love M.; O’Rourke D.; Kelly P.; Beguin E.; Stride E.; McHale A. P.; Callan J. F. Gemcitabine Loaded Microbubbles for Targeted Chemo-Sonodynamic Therapy of Pancreatic Cancer. J. Controlled Release 2018, 279, 8–16. 10.1016/j.jconrel.2018.04.018. [DOI] [PubMed] [Google Scholar]
- Peyman S. A.; Abou-Saleh R. H.; McLaughlan J. R.; Ingram N.; Johnson B. R. G.; Critchley K.; Freear S.; Evans J. A.; Markham A. F.; Coletta P. L.; Evans S. D. Expanding 3D Geometry for Enhanced On-Chip Microbubble Production and Single Step Formation of Liposome Modified Microbubbles. Lab Chip 2012, 12, 4544. 10.1039/c2lc40634a. [DOI] [PubMed] [Google Scholar]
- Malik R.; Pancholi K.; Melzer A. Microbubble–Liposome Conjugate: Payload Evaluation of Potential Theranostic Vehicle. Nanobiomedicine 2016, 3, 1849543516670806. 10.1177/1849543516670806. [DOI] [PMC free article] [PubMed] [Google Scholar]
- Yan F.; Li L.; Deng Z.; Jin Q.; Chen J.; Yang W.; Yeh C.-K.; Wu J.; Shandas R.; Liu X.; Zheng H. Paclitaxel-Liposome-Microbubble Complexes as Ultrasound-Triggered Therapeutic Drug Delivery Carriers. J. Controlled Release 2013, 166, 246–255. 10.1016/j.jconrel.2012.12.025. [DOI] [PubMed] [Google Scholar]
- Neoh K. G.; Kang E. T. Functionalization of Inorganic Nanoparticles with Polymers for Stealth Biomedical Applications. Polym. Chem. 2011, 2, 747–759. 10.1039/c0py00266f. [DOI] [Google Scholar]
- Greish K.Enhanced Permeability and Retention (EPR) Effect for Anticancer Nanomedicine Drug Targeting. In Methods in Molecular Biology; Grobmyer S. R., Moudgil B. M., Eds.; Humana Press: Totowa, NJ, 2010; pp 25–37. [DOI] [PubMed] [Google Scholar]
- Maeda H. The Enhanced Permeability and Retention (EPR) Effect in Tumor Vasculature: The Key Role of Tumor-Selective Macromolecular Drug Targeting. Adv. Enzyme Regul. 2001, 41, 189–207. 10.1016/S0065-2571(00)00013-3. [DOI] [PubMed] [Google Scholar]
- Bosca F.; Bielecki P. A.; Exner A. A.; Barge A. Porphyrin-Loaded Pluronic Nanobubbles: A New US-Activated Agent for Future Theranostic Applications. Bioconjugate Chem. 2018, 29, 234–240. 10.1021/acs.bioconjchem.7b00732. [DOI] [PubMed] [Google Scholar]
- Wang L.; Zhang M.; Tan K.; Guo Y.; Tong H.; Fan X.; Fang K.; Li R.. Preparation of Nanobubbles Carrying Androgen Receptor SiRNA and Their Inhibitory Effects on Androgen-Independent Prostate Cancer When Combined with Ultrasonic Irradiation. PLoS One 2014, 9 (). https://doi.org/ 10.1371/journal.pone.0096586. [DOI] [PMC free article] [PubMed] [Google Scholar]
- Wu H.; Abenojar E. C.; Perera R.; De Leon A. C.; An T.; Exner A. A. Time-Intensity-Curve Analysis and Tumor Extravasation of Nanobubble Ultrasound Contrast Agents. Ultrasound Med. Biol. 2019, 45, 2502–2514. 10.1016/j.ultrasmedbio.2019.05.025. [DOI] [PMC free article] [PubMed] [Google Scholar]
- Nittayacharn P.; Yuan H.-X.; Hernandez C.; Bielecki P.; Zhou H.; Exner A. A. Enhancing Tumor Drug Distribution with Ultrasound-Triggered Nanobubbles. J. Pharm. Sci. 2019, 108, 3091. 10.1016/j.xphs.2019.05.004. [DOI] [PMC free article] [PubMed] [Google Scholar]
- Peyman S. A.; McLaughlan J. R.; Abou-Saleh R. H.; Marston G.; Johnson B. R. G.; Freear S.; Coletta P. L.; Markham A. F.; Evans S. D. On-Chip Preparation of Nanoscale Contrast Agents towards High-Resolution Ultrasound Imaging. Lab Chip 2016, 16, 679–687. 10.1039/C5LC01394A. [DOI] [PubMed] [Google Scholar]
- Xing Z.; Wang J.; Ke H.; Zhao B.; Yue X.; Dai Z.; Liu J. The Fabrication of Novel Nanobubble Ultrasound Contrast Agent for Potential Tumor Imaging. Nanotechnology 2010, 21, 145607. 10.1088/0957-4484/21/14/145607. [DOI] [PubMed] [Google Scholar]
- Wu M.; Zhao H.; Guo L.; Wang Y.; Song J.; Zhao X.; Li C.; Hao L.; Wang D.; Tang J. Ultrasound-Mediated Nanobubble Destruction (UMND) Facilitates the Delivery of A10-3.2 Aptamer Targeted and SiRNA-Loaded Cationic Nanobubbles for Therapy of Prostate Cancer. Drug Delivery 2018, 25, 226–240. 10.1080/10717544.2017.1422300. [DOI] [PMC free article] [PubMed] [Google Scholar]
- Chandan R.; Banerjee R. Pro-Apoptotic Liposomes-Nanobubble Conjugate Synergistic with Paclitaxel: A Platform for Ultrasound Responsive Image-Guided Drug Delivery. Sci. Rep. 2018, 8, 1–15. 10.1038/s41598-018-21084-8. [DOI] [PMC free article] [PubMed] [Google Scholar]
- Alheshibri M.; Qian J.; Jehannin M.; Craig V. S. J. A History of Nanobubbles. Langmuir 2016, 32, 11086–11100. 10.1021/acs.langmuir.6b02489. [DOI] [PubMed] [Google Scholar]
- Nirmalkar N.; Pacek A. W.; Barigou M. On the Existence and Stability of Bulk Nanobubbles. Langmuir 2018, 34, 10964–10973. 10.1021/acs.langmuir.8b01163. [DOI] [PubMed] [Google Scholar]
- Perera R. H.; Wu H.; Peiris P.; Hernandez C.; Burke A.; Zhang H.; Exner A. A. Improving Performance of Nanoscale Ultrasound Contrast Agents Using N,N-Diethylacrylamide Stabilization. Nanomedicine 2017, 13, 59–67. 10.1016/j.nano.2016.08.020. [DOI] [PMC free article] [PubMed] [Google Scholar]
- Hernandez C.; Abenojar E. C.; Hadley J.; De Leon A. C.; Coyne R.; Perera R.; Gopalakrishnan R.; Basilion J. P.; Kolios M. C.; Exner A. A. Sink or Float? Characterization of Shell-Stabilized Bulk Nanobubbles Using a Resonant Mass Measurement Technique. Nanoscale 2019, 11, 851–855. 10.1039/c8nr08763f. [DOI] [PMC free article] [PubMed] [Google Scholar]
- Tan B. H.; An H.; Ohl C.-D. How Bulk Nanobubbles Might Survive. Phys. Rev. Lett. 2020, 124, 134503. 10.1103/physrevlett.124.134503. [DOI] [PubMed] [Google Scholar]
- Hernandez C.; Nieves L.; De Leon A. C.; Advincula R.; Exner A. A. Role of Surface Tension in Gas Nanobubble Stability under Ultrasound. ACS Appl. Mater. Interfaces 2018, 10, 9949–9956. 10.1021/acsami.7b19755. [DOI] [PMC free article] [PubMed] [Google Scholar]
- Pellow C.; Acconcia C.; Zheng G.; Goertz D. E.. Threshold-Dependent Nonlinear Scattering from Porphyrin Nanobubbles for Vascular and Extravascular Applications. Phys. Med. Biol. 2018, 63 (). https://doi.org/ 10.1088/1361-6560/aae571. [DOI] [PubMed] [Google Scholar]
- JafariSojahrood A.; Nieves L.; Hernandez C.; Exner A.; Kolios M. C.. Theoretical and Experimental Investigation of the Nonlinear Dynamics of Nanobubbles Excited at Clinically Relevant Ultrasound Frequencies and Pressures: The Role Oflipid Shell Buckling. IEEE International Ultrasonics Symposium, 2017, No. December, 6–9.
- Cavalli R.; Bisazza A.; Trotta M.; Argenziano M.; Lembo D.; Civra A.; Donalisio M. New Chitosan Nanobubbles for Ultrasound-Mediated Gene Delivery: Preparation and in Vitro Characterization. Int. J. Nanomed. 2012, 7, 3309–3318. 10.2147/IJN.S30912. [DOI] [PMC free article] [PubMed] [Google Scholar]
- Nguyen A. T.; Wrenn S. P. Acoustically Active Liposome-Nanobubble Complexes for Enhanced Ultrasonic Imaging and Ultrasound-Triggered Drug Delivery. Wiley Interdiscip. Rev.: Nanomed. Nanobiotechnol. 2014, 6, 316–325. 10.1002/wnan.1255. [DOI] [PubMed] [Google Scholar]
- Peng Y.; Zhu L. Preparation Of Nanobubbles Modified With A Small-Molecule CXCR4 Antagonist For Targeted Drug Delivery To Tumors And Enhanced Ultrasound Molecular Imaging. Int. J. Nanomed. 2019, 14, 9139. 10.2147/IJN.S210478. [DOI] [PMC free article] [PubMed] [Google Scholar]
- Ruckenstein E. Nanodispersions of Bubbles and Oil Drops in Water. Colloids Surf., A 2013, 423, 112–114. 10.1016/j.colsurfa.2013.01.056. [DOI] [Google Scholar]
- Abenojar E. C.; Nittayacharn P.; De Leon A. C.; Perera R.; Wang Y.; Bederman I.; Exner A. A. Effect of Bubble Concentration on the in Vitro and in Vivo Performance of Highly Stable Lipid Shell-Stabilized Micro- and Nanoscale Ultrasound Contrast Agents. Langmuir 2019, 35, 10192. 10.1021/acs.langmuir.9b00462. [DOI] [PubMed] [Google Scholar]
- Nie L.; McLaughlan J. R.; Cowell D. M. J.; Carpenter T. M.; Freear S.. Subharmonic Plane Wave Imaging of Liposome-Loaded Microbubbles. IEEE International Ultrasonics Symposium, 2018, 2018 January.
- McLaughlan J. R.; Cowell D. M. J.; Freear S.. Gold Nanoparticle Nucleated Cavitation for Enhanced High Intensity Focused Ultrasound Therapy. Phys. Med. Biol. 2018, 63 (). https://doi.org/ 10.1088/1361-6560/aa97e9. [DOI] [PubMed] [Google Scholar]
- McLaughlan J.; Rivens I.; Leighton T.; ter Haar G. A Study of Bubble Activity Generated in Ex Vivo Tissue by High Intensity Focused Ultrasound. Ultrasound Med. Biol. 2010, 36, 1327–1344. 10.1016/j.ultrasmedbio.2010.05.011. [DOI] [PubMed] [Google Scholar]
- Doinikov A. A.; Sheeran P. S.; Bouakaz A.; Dayton P. A. Vaporisation Dynamics of Volatile Perfluorocarbon Droplets: A Theoretical Model and in Vitro Validation. Med. Phys. 2014, 41, 102901. 10.1118/1.4894804. [DOI] [PMC free article] [PubMed] [Google Scholar]
- Evans D. R.; Parsons D. F.; Craig V. S. J. Physical Properties of Phase-Change Emulsions. Langmuir 2006, 22, 9538–9545. 10.1021/la062097u. [DOI] [PubMed] [Google Scholar]
- Abou-Saleh R. H.; Peyman S. A.; Johnson B. R. G.; Marston G.; Ingram N.; Bushby R.; Coletta P. L.; Markham A. F.; Evans S. D. The Influence of Intercalating Perfluorohexane into Lipid Shells on Nano and Microbubble Stability. Soft Matter 2016, 12, 7223–7230. 10.1039/C6SM00956E. [DOI] [PubMed] [Google Scholar]
Associated Data
This section collects any data citations, data availability statements, or supplementary materials included in this article.