

Abstract
In this study, we aimed to explore the effect of TrkB-PLC/IP3 pathway on intestinal inflammatory factors and enterocyte apoptosis in mice with colitis. The mouse model of ulcerative colitis was established by medication, and 40 SPF C57BL/6J mice (8 weeks old) were randomly divided into normal group (healthy mice, n = 10), control group (sham-operated mice, n = 10), model group (model mice without any treatment, n = 10), and K252a group (model mice treated with 100 μmol/kg TrkB-PLC/IP3 pathway inhibitor for 5 days before clysis, n = 10). The results showed that mice in the model and K252a groups, as compared with normal and control groups, had no significant changes in the levels and protein expressions of serum tumor necrosis factor-α (TNF-α) and TNF-γ in the colon tissues (P>0.05), and had a significant increase in disease activity index, colon mucosa damage index, tissue damage index scores, and levels and protein expressions of serum interleukin-4 (IL-4) and IL-8, but had a significant decrease in the level and protein expression of serum IL-10 (P<0.05). Mice in the model and K252a groups showed blocked enterocyte cycle progression, elevated apoptosis ratio, and significantly increased mRNA and protein expressions of Caspase3, Bax, FasL, and Fas, but significantly reduced mRNA and protein expressions of p-TrkB, PLC-γ1, IP3, and Bcl-2 (P<0.05). Moreover, intestinal inflammation and apoptosis induced by colitis in the K252a group became more aggravated by inhibiting the activity of TrkB-PLC/IP3 pathway. In conclusion, inhibition of TrkB-PLC/IP3 pathway can increase the expression of intestinal inflammatory factors and promote enterocyte apoptosis in mice with colitis.
Keywords: colitis, TrkB-PLC/IP3 pathway, intestinal inflammation, enterocyte, apoptosis
Introduction
Ulcerative colitis is a kind of chronic colitis with repeated attack and unknown etiology [1,2]. Recently, its incidence rate in human beings has increased year by year in China. Ulcerative colitis is considered to be a precancerous symptom of colon cancer and thus it is listed as one of the modern refractory diseases by the World Health Organization [3,4]. So far, the study on ulcerative colitis is mainly focused on clinical treatment, while there are few studies on related signaling pathways that affect ulcerative colitis [5–8].
The lesion site of ulcerative colitis is mainly found in the area from the colon submucosa to the entire mucosa, and the main manifestations include ulcer and inflammation. Enterocyte apoptosis may be one cause of ulcer [9,10]. The initial symptom of ulcerative colitis is intestinal flora alteration that triggers an abnormal immune response in the body, resulting in high expressions of inflammatory factors in the intestinal mucosa and further generation of inflammation [11–13].
In recent years, the effect of TrkB-PLC/IP3 pathway on the intestinal tract has drawn people’s attention. The TrkB-PLC/IP3 pathway is mainly composed of protein-tyrosine kinase receptor B (TrkB), phospholipase C (PLC), and inositol triphosphate (IP3). After the specific binding of brain-derived neurotrophic factor (BDNF) to TrkB, TrkB is phosphorylated to p-TrkB, which activates the signal transduction of downstream PLC/IP3, thereby playing roles in the increase of intracellular Ca2+ concentration, the enhancement of nerve-muscle excitation conduction, the promotion of cell mobility in the intestinal smooth muscle, and the promotion of intestinal motility [14–19]. At present, there is no research focusing on the regulatory mechanism of the TrkB-PLC/IP3 pathway on colitis. We speculate that the TrkB-PLC/IP3 pathway may contribute to the regulation of inflammatory response and enterocyte apoptosis for colitis. In this study, we measured the expressions of inflammatory factors and enterocyte apoptosis by establishing a ulcerative colitis mouse model and treating model mice with TrkB-PLC/IP3 pathway inhibitor K252a, in order to explore the effect of TrkB-PLC/IP3 pathway on intestinal inflammatory factors and enterocyte apoptosis in mice with colitis.
Materials and Methods
Laboratory animals
Forty SPF C57BL/6J mice (22.41 ± 2.34 g; 8 weeks of age) were purchased from the Beijing HFK Bioscience (Beijing, China). The weight and quality of laboratory mice met the national standards, and all mice were fed conventionally. The protocol and procedures employed were ethically reviewed and approved by the Animal Ethics Committee of The Second Hospital of Jilin University (Changchun, China), and experiments were performed in accordance with relevant institutional and national guidelines for the care and use of laboratory animals.
Establishment of colitis mice models
The colitis mice models were established by using 1% and 3% oxazolone solutions that was dissolved in 50% ethanol. First, the mice were allowed to acclimate for 1 week, then the mice were anesthetized with intraperitoneal injection of 100 mg/kg pentobarbital sodium (1%). The abdominal hairs of sham-operated mice and model mice were shaved, and 2 ml oxazolone (3%) were smeared on the skin surface to generate sensitization, once a day for 5 days. Then, 150 μl oxazolone (1%) were infused by inserting a 2 mm silicone tube into ~4 cm from the anus, in order to conduct clysis. The skin surface of sham-operated mice was smeared with 2 ml ethanol (50%), and 150 μl ethanol (50%) were used to conduct clysis; the remaining treatment was the same as that given in model mice. The body weight loss and diarrhea occurred 24 h after clysis, indicating a successful modeling. Mice after clysis and healthy mice were bred conventionally under the same rearing conditions.
Grouping
Mice were randomly divided into four groups (10 mice in each group): normal group (healthy mice), control group (sham-operated mice), model group (model mice without any treatment), and K252a group (model mice treated with 100 μmol/kg TrkB-PLC/IP3 pathway inhibitor). Mice in K252a group before clysis were intraperitoneally injected with 100 μmol/kg K252a once a day for 5 days.
Disease activity index scoring
Detailed scoring rules on disease activity index (DAI) were based on a previous report [8]. Briefly, mice were weighed 24 h after successful modeling, fecal status was recorded, occult blood was detected, and DAI was calculated. DAI was scored by overall consideration of mice weight loss, fecal viscosity, and hemafecia status. Scoring was as follows: no weight loss was scored as 0 point, weight loss <5% was scored as 1 point, weight loss of 5%–10% was scored as 2 points, weight loss of 10%–15% was scored as 3 points, and weight loss >15% was scored as 4 points; normal fecal viscosity was scored as 0, loose stool was scored as 2 points, and diarrhea was scored as 4 points; occult hemafecia was scored as 2 points and revealed hemafecia was scored as 4 points. The total score of weight loss, fecal viscosity, and hemafecia was divided by three to obtain a DAI score.
Colon mucosa damage index scoring
Detailed scoring rules on colon mucosa damage index (CMDI) were based on a previous report [8]. At 24 h after successful modeling, the morphological changes of colon mucosa were observed with the naked eye to score CMDI. The condition of no mucosa damage was scored as 0 point; the condition of mild edema and hemorrhage on the surface of intestinal mucosa was scored as 1 point; the condition of moderate hyperemia, edema, and erosion in the intestinal mucosa was scored as 2 points; the condition of severe hyperemia and edema, tissue necrosis, ulcer with a diameter of <1 cm in the intestinal mucosa, and thickening rectum wall with necrosis and inflammation was scored as 3 points; the condition of complete necrosis of the rectum wall and ulcer with a diameter of >1 cm was scored as 4 points.
Tissue damage index scoring
Detailed scoring rules on tissue damage index (TDI) were based on a previous report [8]. At 24 h after successful modeling, the lesions of mice were fixed with 100 ml/l formaldehyde and imbedded using paraffin to prepare paraffin sections. The sections were stained with hematoxylin and eosin. The morphology of sections was observed under an optical microscope, and TDI was scored. The scoring standards of TDI mainly included the inflammatory cell infiltration, the depth of infiltration, and the depth of an intestinal ulcer. No inflammatory cell infiltration was scored as 0 point; mild inflammatory cell infiltration was scored as 1 point; severe inflammatory cell infiltration was scored as 2 points. The depth of infiltration was scored as follows: infiltration to the mucosal layer was scored as 1 point; infiltration to the mucosa and submucosa was scored as 2 points; infiltration to the entire colon layer was scored as 3 points. The depth of intestinal ulcer was scored as follows: no ulcer was scored as 0 point; ulcer to the epithelium was scored as 1 point; ulcer to the lamina propria mucosa was scored as 2 points; ulcer to the muscularis mucosa was scored as 3 points.
Enzyme-linked immunosorbent assay
Enzyme-linked immunosorbent assay (ELISA) kits (eBioscience, San Diego, USA) were used to detect the serum levels of tumor necrosis factor-α (TNF-α), interleukin-4 (IL-4), IL-8, IL-10, and TNF-γ according to the instructions. The optical density value was measured with a BioTek Synergy 2 microplate reader (BioTek, Winooski, USA) at 450 nm. The standard curves were drawn to calculate the serum levels (pg/ml) of TNF-α, IL-4, IL-8, IL-10, and TNF-γ of mice.
Cell cycle and apoptosis detection by flow cytometry
The colon tissues of mice were cut into pieces and grinded by ground glass with phosphate-buffered saline (PBS) solution. The PBS solution was collected and filtered by a cell strainer (60 μm) to obtain suspension containing single cells. These cells were fixed with 95% ethanol, washed with PBS once and centrifuged at 250 g for 5 min. For cell cycle detection, cells were re-suspended with 100 μl of RnaseA (Beijing Baiaolaibo Technology, Beijing, China) and the suspension was incubated in a water bath at 37°C for 30 min in the dark; then 400 μl of PI dye solution (Sigma, St Louis, USA) was added into the suspension, and the suspension was incubated at 4°C for 30 min in the dark; the cell cycle distribution of samples was detected by a CytoFLEX flow cytometer (Beckman Coulter, Pasadena, USA) at 488 nm. For cell apoptosis detection, Annexin-V-FITC/PI dye solution was prepared according to the instruction of Annexin-V-FITC apoptosis assays kit (Sigma). A total of 1 × 10⁶ cells were re-suspended in 100 μl of dye solution, and the suspension was incubated at room temperature for 15 min; then the suspension was mixed with 1 ml HEPES buffer, and cell apoptosis was analyzed by determining the FITC and PI fluorescence intensities by the CytoFLEX flow cytometer at 525 and 620 nm, respectively.
Quantitative real-time polymerase chain reaction (qRT-PCR)
The colon tissues of mice were used to prepare tissue homogenate. Total RNA in the tissue homogenate was extracted using Trizol (Thermo Fisher, Waltham, USA), and the purity and concentration of the total RNA were determined. Sample RNAs were reversely transcribed into cDNAs using the reverse transcription kit (Merck, San Diego, USA). qRT-PCR was performed with cDNA as the template. Total reaction solution was 10 μl, including 0.5 μl PCR forward primer, 0.5 μl PCR reverse primer, 1 μl cDNA template, 3 μl ddH2O, and 5 μl (2×) SYBR® Premix Ex Taq™ II. qRT-PCR amplification procedure was as follows: pre-denaturation at 95°C for 4 min, 35 circles of denaturation at 94°C for 30 s and annealing at 60°C for 30 s, and extension at 72°C for 5 min. The reference gene for qRT-PCR was GAPDH. The primers for TrkB, PLC, IP3, Bax, Bcl-2, Caspase3, Fas, FasL, and GAPDH were synthesized by the Sangon Biotech (Shanghai, China). The sequence of the primers is listed in Table 1. Expression levels of mRNA were calculated using the 2-ΔΔCt method. ΔΔCt = ΔCtthe rest groups—ΔCtcontrol group. ΔCt = Cttarget gene—CtGAPDH. Ct represented the number of amplification cycles when the fluorescence intensity reached the threshold value after qPCR.
Table 1.
The sequences of primers used in qRT-PCR.
| Name | Sequence |
|---|---|
| TrkB | Forward: 5′-CTGGGGCTTATGCCTGCTG-3′ |
| Reverse: 5′-AGGCTCAGTACACCAAATCCTA-3′ | |
| PLC | Forward: 5′-TTCCAGATGGTCTATTTCCGGG-3′ |
| Reverse: 5′-CTTGGCACTTGCATCCTCC-3′ | |
| IP3 | Forward: 5′-CGTTTTGAGTTTGAAGGCGTTT-3′ |
| Reverse: 5′-CATCTTGCGCCAATTCCCG-3′ | |
| Bax | Forward: 5′-AGACAGGGGCCTTTTTGCTAC-3′ |
| Reverse: 5′-AATTCGCCGGAGACACTCG-3′ | |
| Bcl-2 | Forward: 5′-GCTACCGTCGTGACTTCGC-3′ |
| Reverse: 5′-CCCCACCGAACTCAAAGAAGG-3′ | |
| Caspase3 | Forward: 5′-CTCGCTCTGGTACGGATGTG-3′ |
| Reverse: 5′-TCCCATAAATGACCCCTTCATCA-3′ | |
| Fas | Forward: 5′-GCGGGTTCGTGAAACTGATAA-3′ |
| Reverse: 5′-GCAAAATGGGCCTCCTTGATA-3′ | |
| FasL | Forward: 5′-CAGCCCATGAATTACCCATGT-3′ |
| Reverse: 5′-ATTTGTGTTGTGGTCCTTCTTCT-3′ | |
| GAPDH | Forward: 5′-AGGTCGGTGTGAACGGATTTG-3′ |
| Reverse: 5′-GGGGTCGTTGATGGCAACA-3′ |
Western blot analysis
The intestinal mucosa of mice was used to prepare tissue homogenate. Total proteins were extracted from the tissue homogenate lysed on ice using RIPA. Centrifugation was then performed at 8500 g for 2 min to obtain the supernatant. After the protein concentration was measured using a BCA kit (Beyotime Biotechnology Co., Ltd, Shanghai, China), 160 μl supernatant were mixed with 40 μl 5× SDS loading buffer. The mixture was put into a boiling water bath for 10 min. Then, SDS-PAGE was performed. The proteins were transferred to a PVDF membrane, and the PVDF membrane was blocked with 5% skimmed milk powder. Then, the membrane was incubated with primary antibodies at room temperature for 2 h. The primary antibodies included rabbit polyclonal antibodies against p-TrkB (1:2000), TrkB (1:2000), PLC-γ1 (1:2000), PLC (1:3000), IP3 (1:1000), TNF-α (1:2000), TNF-γ (1:1000), IL-4 (1:2000), IL-8 (1:1000), IL-10 (1:3000), Bax (1:5000), Bcl-2 (1:2000), Caspase3 (1:500), Fas (1:1000), FasL (1:2000), and GAPDH (1:10,000). All of the above antibodies were purchased from (Abcam, Cambridge, UK). Then, the membrane was washed with tris-buffered saline tween (TBST) three times, 5–10 min every time. The membrane was then incubated with horse radish peroxidase-labeled goat anti-rabbit IgG second antibody (1:2000; Abcam) at room temperature for 2 h. Then, the membrane was washed again with TBST three times, 5–10 min every time. Finally, the membrane was placed in an E-gel imager (Thermo Fisher) and covered with developing agents. The protein bands were photographed through the Bio-Rad image analysis system (Bio-Rad, Hercules, USA). The gray value of the protein band was analyzed by Quantity One software (Bio-Rad). The relative level of protein was calculated by the gray value of the protein band relative to the gray value of the internal reference GAPDH band.
Statistical analysis
SPSS 21.0 software (SPSS Inc., Chicago, USA) was used to analyze the data. All data were presented as the mean ± standard deviation. Comparison among groups was performed using one-way ANOVA and Bonferroni post-hoc test for pairwise comparison. The significant difference was set at P<0.05.
Results
DAI, CMDI, and TDI scores
DAI scores of mice in the normal, control, model, and K252a groups were shown in Fig. 1A. There was no significant difference in DAI score between the normal group and control group (P>0.05). DAI scores in the model and K252a groups were significantly increased as compared with that in the normal group (both P<0.05). DAI score in K252a group was significantly higher than that in the model group (P<0.05).
Figure 1.
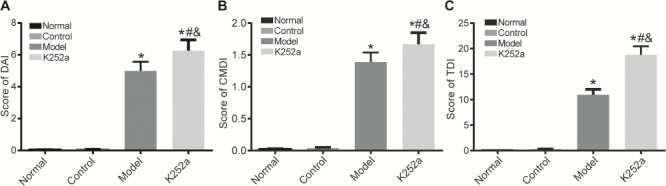
The scores of mice in the normal, control, model, and K252a groups (A) DAI score comparison. (B) CMDI score comparison. (C) TDI score comparison. *P<0.05 compared with the normal group, #P<0.05 compared with the control group, and &P<0.05 compared with the model group.
CMDI scores of mice in the normal, control, model, and K252a groups were shown in Fig. 1B. There was no significant difference in CMDI score between the normal group and control group (P>0.05). CMDI scores in the model and K252a groups were significantly increased when compared with that in the normal group (P<0.05). CMDI score in the K252a group was significantly higher than that in the model group (P<0.05).
TDI scores of mice in the normal, control, model, and K252a groups were shown in Fig. 1C. There was no significant difference in TDI score between the normal group and control group (P>0.05). TDI scores in the model and K252a groups were significantly increased when compared with that in the normal group (P<0.05). TDI score in the K252a group was significantly higher than that in the model group (P<0.05).
Serum levels of related inflammatory factors
The levels of TNF-α, TNF-γ, IL-4, IL-8, and IL-10 in the serum of mice in the normal, control, model, and K252a groups were detected by ELISA (Fig. 2). Compared with the normal group, there were no significant differences in the levels of TNF-α and TNF-γ in the other three groups (P>0.05), and mice in the model and K252a groups had significantly increased levels of IL-4 and IL-8 and significantly decreased IL-10 level (P<0.05). Mice in the K252a group had significantly increased levels of IL-4 and IL-8 but significantly decreased IL-10 level when compared with mice in the model group (P<0.05). There were no significant differences between the control group and normal group (P>0.05).
Figure 2.

Levels of related inflammatory factors in the serum detected by ELISA * P<0.05 compared with the normal group, #P<0.05 compared with the control group, and &P<0.05 compared with the model group.
Protein expressions of related inflammatory factors in the colon tissues
Protein expressions of inflammatory factors in the colon tissues were measured by western blot analysis (Fig. 3). Compared with the normal group, there were no significant differences in protein expressions of TNF-α and TNF-γ in the other three groups (P>0.05) and mice in the model and K252a groups had significantly increased protein expressions of IL-4 and IL-8 but significantly decreased IL-10 protein expression (P<0.05). Mice in the K252a group had significantly increased protein expressions of IL-4 and IL-8 but significantly decreased IL-10 protein expression when compared with mice in the model group (P<0.05). There were no significant differences between the control group and normal group (P>0.05).
Figure 3.

Protein expressions of inflammation-related genes in the colon tissues detected by western blot analysis (A) The results of western blot analysis. (B) Histogram of protein expression. *P<0.05 compared with the normal group, #P<0.05 compared with the control group, and &P<0.05 compared with the model group.
Enterocyte cell cycle distributions
Enterocyte cell cycle distribution in the normal, control, model, and K252a groups was detected by flow cytometry (Fig. 4). There were no significant differences in cell proportion in all phases between the control group and normal group (P>0.05). Compared with that in the normal group, cell proportion of the G0/G1 phase was significantly increased, while that of the S phase was significantly decreased in the model and K252a groups (P<0.05). In the K252a group, cell proportion of the G0/G1 phase was significantly increased, while that of the S phase was significantly decreased when compared with that in the model group (P<0.05). There were no significant differences in cell proportion in the G2/M phase among the four groups (P>0.05).
Figure 4.
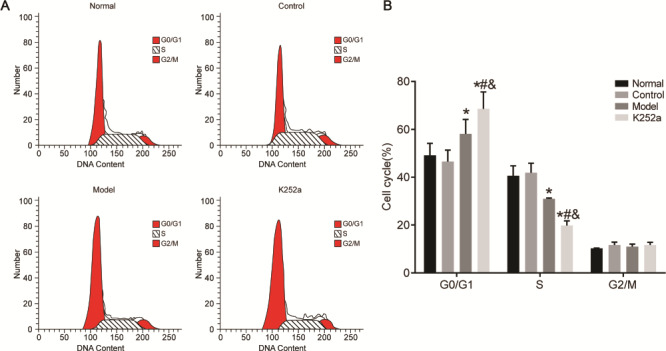
Enterocyte cell cycle distributions detected by flow cytometry (A) The results of flow cytometry. (B) Cell circle distribution. *P<0.05 compared with the normal group, #P<0.05 compared with the control group, and &P<0.05 compared with the model group.
Enterocyte apoptosis
Enterocyte apoptosis in the normal, control, model, and K252a groups was detected by flow cytometry (Fig. 5). There was no significant difference in apoptotic rate between the control group and normal group (P>0.05). Compared with that in the normal group, the apoptotic rate in the model and K252a groups was significantly increased (P<0.05). The apoptotic rate in the K252a group was significantly increased when compared with that in the model group (P<0.05).
Figure 5.
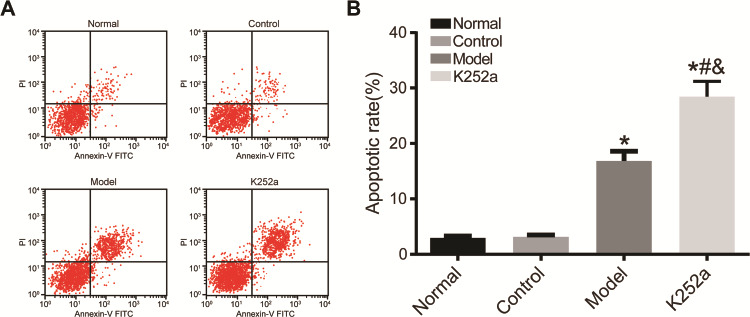
Enterocyte apoptosis detected by flow cytometry (A) The results of flow cytometry. (B) Histogram of enterocyte apoptosis rate. *P<0.05 compared with normal group, #P<0.05 compared with control group, and &P<0.05 compared with model group.
mRNA and protein expression of apoptosis-related genes and the TrkB-PLC/IP3 pathway
mRNA expressions of TrkB, PLC, IP3, Bax, Caspase3, Bcl-2, FasL, and Fas in the colon tissue were measured by qRT-PCR (Fig. 6A). There was no significant difference between the control group and normal group (P>0.05). Compared with those in the normal group, mRNA expressions of Bax, Caspase3, FasL, and Fas were significantly increased, while mRNA expressions of TrkB, PLC, IP3, and Bcl-2 were significantly decreased in the model and K252a groups (P<0.05). mRNA expressions of Bax, Caspase3, FasL, and Fas significantly were increased, while mRNA expressions of TrkB, PLC, IP3, and Bcl-2 were significantly decreased in the K252a group when compared with those in the model group (P<0.05).
Figure 6.
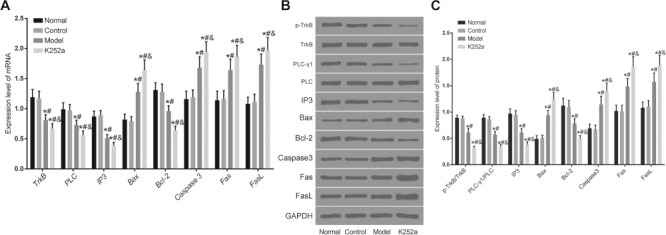
Expressions of apoptosis-related genes and the TrkB-PLC/IP3 pathway in the colon tissue detected by qRT-PCR and western blot analysis (A) mRNA expressions of apoptosis-related genes in the colon tissue. (B) Representative image of western blots. (C) Histogram of protein expressions. *P<0.05 compared with the normal group, #P<0.05 compared with the control group, and &P<0.05 compared with the model group.
Protein expressions of p-TrkB, PLC-γ1, IP3, Bax, Caspase3, Bcl-2, FasL, and Fas in the colon tissue were measured by western blot analysis (Fig. 6B,C). There was no significant difference between the control group and normal group (P>0.05). Compared with those in the normal group, protein expressions of Bax, Caspase3, FasL, and Fas were significantly increased, while protein expressions of p-TrkB/TrkB, PLC-γ1/PLC, IP3, and Bcl-2 were significantly decreased in the model and K252a groups (P<0.05). Protein expressions of Bax, Caspase3, FasL, and Fas were significantly increased, while protein expressions of p-TrkB/TrkB, PLC-γ1/PLC, IP3, and Bcl-2 were significantly decreased in the K252a group when compared with those in the model group (P<0.05).
Discussion
Colitis, as a kind of recurrent chronic colitis, is listed as a modern refractory disease due to obstinacy and easy recurrence [20,21]. There are many studies on the clinical drug development and treatment for colitis, while there are few studies on the related mechanisms. Therefore, it is of great significance to explore the mechanism of colitis.
TrkB, as an acceptor molecule, is rapidly activated by phosphorylation after receiving the upstream signal. By activating the downstream PLC/IP3 pathway, the activated TrkB promotes the increase of intracellular calcium ion concentration, thus facilitating the excitation of intestinal nerve cells and the conduction of excitation, and promoting the intestinal motility [22,23]. At present, studies on the TrkB-PLC/IP3 pathway mainly focus on its antidepressant effect and intestinal motility promotion effect, while the improvement effect of TrkB-PLC/IP3 pathway on colitis has not been reported. In this study, sensitization and clysis were performed simultaneously on mice using oxazolone to establish colitis mice models [24]. DAI, TDI, and CMDI scores in the K252a group were the highest and these scores in the model group were significantly higher than those in the normal and control groups. The TrkB-PLC/IP3 pathway inhibitor increased DAI, TDI, and CMDI scores of mice with colitis. The results of ELISA and western blot analysis showed no significant differences in the levels and protein expressions of TNF-γ and TNF-α, and mice in the model and K252a groups showed a significant increase of IL-4 and IL-8 levels and protein expressions but a significant decrease of IL-10 level and protein expression. It indicated that the TrkB-PLC/IP3 pathway might have no significant effect on Th1 cytokines in colitis mice and mainly affected the expressions of Th2 cytokines IL-4, IL-8, and IL-10 to break the Th1/Th2 cytokine balance, facilitating the development of inflammation. At present, no studies have confirmed the regulatory mechanism of TrkB-PLC/IP3 pathway on inflammatory development of colitis. However, the upstream BDNF of the TrkB-PLC/IP3 pathway can improve the levels of TNF-α and other inflammatory factors in depression. Therefore, we speculated that the TrkB-PLC/IP3 pathway, as the downstream effector of BDNF, could also inhibit the inflammatory development in colitis [25–28].
Enterocyte cell cycle distribution and apoptosis were detected by flow cytometry. The results showed that mice in the model group and K252a group suffered cell cycle arrest and had a significantly increased apoptotic rate. Moreover, cell cycle arrest and apoptotic rate were significantly greater in the K252a group than those in the model group. The results of qRT-PCR and western blot analysis showed that mRNA and protein expressions of Bax, FasL, Fas, and Caspase3 were significantly increased, while mRNA expressions of TrkB, PLC, IP3, and Bcl-2 and protein expressions of p-TrkB, PLC-γ1, IP3, and Bcl-2 were significantly decreased in the model and K252a groups. Moreover, these increased and decreased expressions in the K252a group were both significantly more than those in the model group. High enterocyte apoptotic rate that might be affected through the Fas/FasL pathway further exacerbated the condition of colitis mice. Previous studies have shown that the TrkB-PLC/IP3 pathway can inhibit anxiety- and depression-like behaviors, mainly by inhibiting the apoptosis of hippocampal neurons [29–31]. In this study, we did not explore the specific mechanism of TrkB-PLC/IP3 pathway on inflammation and apoptosis, and its application in clinical treatment remains to be further studied. Moreover, although the colon includes intestine villus, crypt, smooth muscle, etc., total colon tissue was harvested in this study for the analysis of relevant indicators. Cells that experienced apoptosis easily in the colon tissue were not analyzed, which will be solved in our future research.
In summary, the TrkB-PLC/IP3 pathway promotes the expression of IL-10 by inhibiting IL-4 and IL-8 expressions, improving Th1/Th2 cytokine balance and reducing inflammation. On the other hand, the TrkB-PLC/IP3 pathway suppresses enterocyte apoptosis by inhibiting the Fas/FasL pathway, improving symptoms of colitis.
Funding
This work was supported by the grants from the Key Scientific and Technological Projects of Jilin Province Science and Technology Department (No. 20170204059SF), and the 13th Five-Year Science and Technology Research Fund of Jilin Province Education Department (No. JJKH20180097KJ).
References
- 1. Colombel JF, Sands BE, Rutgeerts P, Sandborn W, Danese S, D’Haens G, Panaccione R, et al. The safety of vedolizumab for ulcerative colitis and Crohn’s disease. Gut 2017, 66: 839–851. [DOI] [PMC free article] [PubMed] [Google Scholar]
- 2. Freeman HJ, James D, Mahoney CJ. Spontaneous peritonitis from perforation of the colon in collagenous colitis. Can J Gastroenterol 2016, 15: 265–267. [DOI] [PubMed] [Google Scholar]
- 3. Li JH, Yu JP, Yu HG, Xu XM, Yu LL, Liu J, Luo HS. Melatonin reduces inflammatory injury through inhibiting NF-kappaB activation in rats with colitis. Mediat Inflamm 2005, 2017: 185. [DOI] [PMC free article] [PubMed] [Google Scholar]
- 4. Chao K, Zhang SH, Qiu Y, Chen XY, Zhang XR, Cai C, Peng YW, et al. Human umbilical cord-derived mesenchymal stem cells protect against experimental colitis via CD5+ B regulatory cells. Stem Cell Res Ther 2016, 7: 109. [DOI] [PMC free article] [PubMed] [Google Scholar]
- 5. Harbord M, Eliakim R, Bettenworth D, Karmiris K, Katsanos K, Kopylov U, Kucharzik T, et al. Third European evidence-based consensus on diagnosis and management of ulcerative colitis. Part 2: current management. J Crohns Colitis 2017, 11: 769–784. [DOI] [PubMed] [Google Scholar]
- 6. Bossa F, Latiano A, Rossi L, Magnani M, Palmieri O, Dallapiccola B, Serafini S, et al. Erythrocyte-mediated delivery of dexamethasone in patients with mild-to-moderate ulcerative colitis, refractory to mesalamine: a randomized, controlled study. Am J Gastroenterol 2008, 103: 2509–2516. [DOI] [PubMed] [Google Scholar]
- 7. Magro F, Gionchetti P, Eliakim R, Ardizzone S, Armuzzi A, Barreiro-de Acosta M, Burisch J, et al. Third European evidence-based consensus on diagnosis and management of ulcerative colitis. Part 1: definitions, diagnosis, extra-intestinal manifestations, pregnancy, cancer surveillance, surgery, and ileo-anal pouch disorders. J Crohns Colitis 2017, 11: 649–670. [DOI] [PubMed] [Google Scholar]
- 8. Yu Y, Zhao TY, Yang DQ. Cotransfer of regulatory T cells improve the therapeutic effectiveness of mesenchymal stem cells in treating a colitis mouse model. Exp Anim 2017, 66: 167–176. [DOI] [PMC free article] [PubMed] [Google Scholar]
- 9. Rodríguez-Nogales A, Algieri F, Garrido-Mesa J, Vezza T, Utrilla MP, Chueca N, Garcia F, et al. Differential intestinal anti-inflammatory effects of Lactobacillus fermentum and Lactobacillus salivarius in DSS mouse colitis: impact on microRNAs expression and microbiota composition. Mol Nutr Food Res 2017, 61: 1700144. [DOI] [PubMed] [Google Scholar]
- 10. Wang F, Johnson RL, Snyder PW, DeSmet ML, Fleet JC. An inducible, large-intestine-specific transgenic mouse model for colitis and colitis-induced colon cancer research. Dig Dis Sci 2016, 61: 1069–1079. [DOI] [PMC free article] [PubMed] [Google Scholar]
- 11. Igaki K, Komoike Y, Nakamura Y, Watanabe T, Yamasaki M, Fleming P, Yang L, et al. MLN3126, an antagonist of the chemokine receptor CCR9, ameliorates inflammation in a T cell mediated mouse colitis model. Int Immunopharmacol 2018, 60: 160–169. [DOI] [PubMed] [Google Scholar]
- 12. Wu J, McDuffie JE, Song J, Harris MC, Raymond H, Chen Y, Nguyen L, et al. LC/MS/MS profiling of tissue oxysterols and its application in dextran sodium sulphate induced mouse colitis models. Curr Top Med Chem 2017, 17: 2781–2790. [DOI] [PubMed] [Google Scholar]
- 13. Palamides P, Jodeleit H, Föhlinger M, Beigel F, Herbach N, Mueller T, Wolf E, et al. Characterization and validation of a mouse model for colitis ulcerosa based on NOD-scid IL2R γnull mice reconstituted with peripheral blood mononuclear cells from patients. Dis Model Mech 2016, 9: 985–997, dmm.025452. [DOI] [PMC free article] [PubMed] [Google Scholar]
- 14. Cazarin C, Nogales AR, Algieri F, Utrilla MP, Rodríguez-Cabezas ME, Garrido-Mesa J, Guerra-Hernández E, et al. Intestinal anti-inflammatory effects of Passiflora edulis peel in the dextran sodium sulphate model of mouse colitis. J Funct Foods 2016, 26: 565–576. [Google Scholar]
- 15. Bitzer ZT, Elias RJ, Vijay-Kumar M, Lambert JD. (-)-Epigallocatechin-3-gallate decreases colonic inflammation and permeability in a mouse model of colitis, but reduces macronutrient digestion and exacerbates weight loss. Mol Nutr Food Res 2016, 60: 2267–2274. [DOI] [PubMed] [Google Scholar]
- 16. Guo T, Lin Q, Li X, Nie Y, Wang L, Shi L, Xu W, et al. Octacosanol attenuates inflammation in both RAW264.7 macrophages and a mouse model of colitis. J Agric Food Chem 2017, 65: 3647–3658. [DOI] [PubMed] [Google Scholar]
- 17. Zhang H, Chen W. Interleukin 6 inhibition by triptolide prevents inflammation in a mouse model of ulcerative colitis. Exp Ther Med 2017, 14: 2271–2276. [DOI] [PMC free article] [PubMed] [Google Scholar]
- 18. Park JS, Choi JW, Jhun J, Kwon JY, Lee BI, Yang CW, Park SH, et al. Lactobacillus acidophilus improves intestinal inflammation in an acute colitis mouse model by regulation of Th17 and Treg cell balance and fibrosis development. J Med Food 2018, 21: 215–224. [DOI] [PubMed] [Google Scholar]
- 19. Shepherd C, Giacomin P, Navarro S, Miller C, Loukas A, Wangchuk P. A medicinal plant compound, capnoidine, prevents the onset of inflammation in a mouse model of colitis. J Ethnopharmacol 2018, 211: 17–28. [DOI] [PubMed] [Google Scholar]
- 20. Pott J, Kabat AM, Maloy KJ. Intestinal epithelial cell autophagy is required to protect against TNF-induced apoptosis during chronic colitis in mice. Cell Host Microbe 2018, 23: 191–202.e4. [DOI] [PubMed] [Google Scholar]
- 21. Vendramini-Costa DB, Alcaide A, Pelizzaro-Rocha KJ, Talero E, Ávila-Román J, Garcia-Mauriño S, Pilli RA, et al. Goniothalamin prevents the development of chemically induced and spontaneous colitis in rodents and induces apoptosis in the HT-29 human colon tumor cell line. Toxicol Appl Pharmacol 2016, 300: 1–12. [DOI] [PubMed] [Google Scholar]
- 22. Lai KO, Ip NY. Methods to study the signal transduction of the surface receptor tyrosine kinase TrkB in neurons. Methods Mol Biol 1722, 2018: 211–222. [DOI] [PubMed] [Google Scholar]
- 23. Gaydukov AE, Akutin IA, Bogacheva PO, Balezina OP. Changes in the parameters of quantal acetylcholine release after activation of PAR1-type thrombin receptors at the mouse neuromuscular junctions. Biochem (Moscow) Suppl Ser A 2018, 12: 33–42. [Google Scholar]
- 24. Fei L, Xu K. Zhikang capsule ameliorates dextran sodium sulfate-induced colitis by inhibition of inflammation, apoptosis, oxidative stress and MyD88-dependent TLR4 signaling pathway. J Ethnopharmacol 2016, 192: 236–247. [DOI] [PubMed] [Google Scholar]
- 25. Xia C, Shen S, Hashmi F, Qiao LY. Colitis-induced bladder afferent neuronal activation is regulated by BDNF through PLCγ pathway. Exp Neurol 2016, 285: 126–135. [DOI] [PMC free article] [PubMed] [Google Scholar]
- 26. Zalli A, Jovanova O, Hoogendijk WJ, Tiemeier H, Carvalho LA. Low-grade inflammation predicts persistence of depressive symptoms. Psychopharmacology (Berl) 2016, 233: 1669–1678. [DOI] [PMC free article] [PubMed] [Google Scholar]
- 27. Xiang L, Ren Y, Li X, Zhao W, Song Y. MicroRNA-204 suppresses epileptiform discharges through regulating TrkB-ERK1/2-CREB signaling in cultured hippocampal neurons. Brain Res 1639, 2016: 99–107. [DOI] [PubMed] [Google Scholar]
- 28. Chen X, Wang X, Tang L, Wang J, Shen C, Liu J, Lu S, et al. Nhe5 deficiency enhances learning and memory via upregulating Bdnf/TrkB signaling in mice. Am J Med Genet B Neuropsychiatr Genet 2017, 174: 828–838. [DOI] [PubMed] [Google Scholar]
- 29. Zhao DY, Zhang WX, Qi QQ, Long X, Li X, Yu YB, Zuo XL. Brain-derived neurotrophic factor modulates intestinal barrier by inhibiting intestinal epithelial cells apoptosis in mice. Physiol Res 2018, 67: 475–485. [DOI] [PubMed] [Google Scholar]
- 30. Pandey R, Rai V, Mishra J, Mandrah K, Kumar Roy S, Bandyopadhyay S. From the cover: arsenic induces hippocampal neuronal apoptosis and cognitive impairments via an up-regulated BMP2/Smad-dependent reduced BDNF/TrkB signaling in rats. Toxicol Sci 2017, 159: 137–158. [DOI] [PubMed] [Google Scholar]
- 31. Zong C, Nie X, Zhang D, Ji Q, Qin Y, Wang L, Jiang D, et al. Up regulation of glyoxylate reductase/hydroxypyruvate reductase (GRHPR) is associated with intestinal epithelial cells apoptosis in TNBS-induced experimental colitis. Pathol Res Pract 2016, 212: 365–371. [DOI] [PubMed] [Google Scholar]