

Abstract
Cerebral palsy (CP) is a movement disorder associated with small and weak muscles. Methods that accurately assess muscle mass in children with CP are scarce. The purpose of this study was to determine whether dual-energy X-ray absorptiometry (DXA) accurately estimates midleg muscle mass in ambulatory children with spastic CP. Ambulatory children with spastic CP and typically developing children 5–11 y were studied (n = 15/ group). Fat-free soft tissue mass (FFST) and fat mass at the middle third of the tibia (i.e., midleg) were estimated using DXA. Muscle mass (muscleMRI) and muscle mass corrected for intramuscular fat (muscleMRIfc) in the midleg were estimated using magnetic resonance imaging (MRI). Statistical models were created to predict muscleMRI and muscleMRIfc using DXA. Children with CP compared to typically developing children had lower FFST (38%), muscleMRI (40%) and muscleMRIfc (47%) (all p < 0.05) and a lower ratio of muscleMRIfc to FFST (17%, p < 0.05). DXA-based models developed using data from typically developing children overestimated muscleMRI (13%) and muscleMRIfc (22%) (both p < 0.05) in children with CP. DXA-based models developed using data from children with CP explained 91% of the variance in muscleMRI and 90% of the variance in muscleMRIfc in children with CP (both p < 0.05). Moreover, the estimates were not different from muscleMRI and muscleMRIfc (both p > 0.99). We conclude that DXA-based statistical models accurately estimate midleg muscle mass in children with CP when the models are composed using data from children with CP rather than typically developing children.
Keywords: muscle mass, cerebral palsy, dual-energy X-ray absorptiometry, magnetic resonance imaging, intramuscular fat
INTRODUCTION
As the largest tissue component of the lean body mass in humans, skeletal muscle plays an important role in daily life. Apart from force-generating capacity (1), which is crucial for movement and balance (2), it is also involved in numerous physiological processes that help the body achieve homeostasis (3). Altered skeletal muscle quantity and quality have been associated with multiple morbidities, such as insulin resistance (4), functional impairment and disability (5), obesity (6) and osteoporosis (7). Therefore, obtaining information about human skeletal muscle development and accretion is necessary for disease prevention and treatment.
Magnetic resonance imaging (MRI) is considered the “gold standard” for noninvasive skeletal muscle mass assessment (8). However, some limitations associated with MRI include high cost, low availability, and time-consuming acquisition and processing procedures. An alternative to MRI is dual-energy X-ray absorptiometry (DXA) because of its lower cost, and shorter scanning and processing time. Studies have shown that fat-free soft tissue (FFST) from DXA can be used to estimate skeletal muscle mass (9–12). However, few studies have focused on children (9, 10, 12) and fewer have focused on children with arrested muscle accretion, such as children with cerebral palsy (CP) (9). Muscle assessment in children with CP is particularly important because CP is the most common childhood disability and it is associated with muscles that are small (13–15), weak (15) and highly infiltrated with fat (16). The muscle size deficit in children with CP is profound in the lower extremities, especially the legs (13). Moreover, the concentration of intramuscular fat in the legs is ~ 50% higher in ambulatory children with CP than in typically developing children (16).
There is evidence that a DXA-based statistical model developed for typically developing children overestimates skeletal muscle mass in nonambulatory children with CP, which has been linked to their lower proportion of muscle in the FFST (9). Whether a similar problem is present and correctable in ambulatory children with spastic CP is unknown. In addition, most MRI structural images used to assess muscle volume (MV) cannot separate intramuscular fat from muscle tissue. Therefore, the proportion of muscle in the FFST may be even lower and the overestimation of muscle mass by DXA-based models higher in children with CP than previously demonstrated when the high degree of intramuscular fat is considered.
The objective of this study was to determine whether DXA can be used to estimate midleg muscle mass in ambulatory children with spastic CP. It was hypothesized that midleg muscle mass in children with CP would be overestimated by a DXA-based statistical model developed using data from typically developing children while a model developed using data from children with CP would yield accurate estimation.
METHODS
Participants
Sixteen ambulatory children with spastic CP (n = 5 girls; n = 12 Caucasian, n = 2 African American and n =2 Hispanic) and between 5 and 11 years old were recruited from local pediatric hospitals and clinics. Fifteen typically developing children (n = 4 girls; n = 11 Caucasian, n = 2 African American, n = 1 Hispanic and n =1 Asian) without known neurological disorders and had similar ages to children with CP also participated. This study received approval from the Institutional Review Board. Written consent and assent were obtained from the participant and the parent, respectively.
Anthropometrics
Height was assessed using a stadiometer (Seca 217; Seca GmbH & Co. KG., Hamburg, GER). Body mass was assessed using a digital weight scale (Detecto 6550, Cardinal Scale, Webb City, MO). Both measurements were taken while children wore minimal clothing. Body mass index (BMI) was subsequently calculated. Height, body mass and BMI percentiles were determined using growth charts (17).
Sexual Maturity
Sexual maturity was assessed using the Tanner staging technique (18). This is a five-point scale with I indicating no development and V indicating full development. There are two parts to this assessment. Pubic hair development in both boys and girls, and testicular/penile development in boys and breast development in girls were assessed by a physician assistant.
Gross Motor Function
Gross motor function in children with CP was classified according to the gross motor function classification system (GMFCS) (19). GMFCS is a five-point scale ranging from I to V with a higher number indicating lower gross motor function. Participants with CP in this study had GMFCS I or II.
DXA
FFST and fat mass at the level of the middle-third (i.e., midleg) of the nondominant side in typically developing children and the more affected side in children with CP were assessed using DXA (Delphi W, version 11.2; Whole Body Analysis; Hologic Inc., Marlborough, MA) and a whole body scan. The BodyFIX (Medical Intelligence, Inc., Schwabműnchen, GER) was used to limit motion in children with CP (9). After completion of the scan, a region of interest (ROI) box was placed at the middle-third of the tibia to represent the midleg and fat mass and FFST were determined. The coefficient of variation (CV) for repeat measures of FFST and fat mass in the midleg were 0.6% and 0.7%, respectively (9).
MRI
Midleg muscle mass and muscle mass corrected for intramuscular fat were determined using MRI (GE, 1.5 T, Waukesha, WI) in the same leg tested using DXA. To help children remain still during the MRI testing, they were secured from the waist down using the BodyFix to limit motion (16). They also watched a movie of their choice using an MRI-compatible goggle system (CinemaVision, Resonance Technology Inc, Northridge, CA). All scans with visible motion in the images were redone. Axial images (0.5 cm slice thickness and 0.5 cm spacing) were collected from the tibia plateau to the malleolar surface using a semiflex long bone array coil (ScanMed, Omaha, NE) and two scans. The first scan (TR = 650, TE = 14, NEX = 3, Bandwidth = 15.63, frequency 512 and phase 256, field of view 12 cm) yielded T1-weighted images. The second scan (IDEAL: fast-spin-echo, TR = 600, TE = min full, NEX = 2, Bandwidth = 31.25, frequency 320 and phase 224) yielded fat and water images.
Images were processed with a program developed using Interactive Data Language (Research Systems, Inc., Boulder, CO). T1-weighted images at the level of the midleg were automatically identified and processed. Skeletal muscle area was separated from other tissues (20) with minor manual adjustments applied as needed. The identified area for the first and last images were multiplied by a correction factor (< 1), and the rest of the images were multiplied by 1 to account for the slice thickness and spacing, and sum of all results was defined as mid-third tibia MV. The mid-third tibia MV was then multiplied by 1.04 g/cm3, the assumed density of muscle (21) to calculate muscle mass (muscleMRI). The reliability in our laboratory is excellent as indicated by intraclass correlation coefficients > 0.99 and CVs of 0.5% (9).
To correct muscle mass for intramuscular fat concentration (muscleMRIfc), areas that were assigned to muscle in the T1-weighted images were used to identify muscle areas in the corresponding fat and water images. The signal intensity (SI) was used to calculate fat concentration using the following equation: Fat concentration = SI from fat images / (SI from fat images + SI from water images) * 100 (22). Skeletal MV corrected for intramuscular fat concentration was calculated using the following equation: Corrected MV = MV – (MV x fat concentration). The corrected MV was then multiplied by the assumed muscle density (21) to yield muscleMRIfc.
Statistical Analysis
Data analyses were conducted using SPSS (version 24.0; SPSS, Chicago, IL). Physical characteristics and data from DXA and MRI were checked for normality first, and group comparisons were made using independent t-tests or Mann-Whitney test accordingly. The magnitude of the effects was determined using Cohen’s d (d), with 0.2, 0.5 and 0.8 indicating small, medium, and large effects, respectively (23).
A simple linear regression analysis was performed using FFST as the independent variable to estimate muscleMRI and muscleMRIfc in typically developing children and in children with CP. Age, height, body mass, BMI and fat mass were added to the model as predictors one at a time to determine whether those variables could significantly improve model predictability. The final models were cross-validated using the leave-one-out technique (24). Paired t-tests were performed to determine whether model estimated muscle mass was different from muscleMRI and muscleMRIfc.
RESULTS
One Caucasian boy with CP did not complete the second MRI scan (IDEAL) and was excluded from the analyses. Physical characteristics for the remaining participants are summarized in Table 1. Eight children with CP had GMFCS I and 7 had GMFCS II. No group differences in age, body mass, BMI, BMI percentile, sexual maturity, or fat mass were detected (all p > 0.05). Children with CP had a lower body mass percentile, height, and height percentile (all p < 0.05). Children with CP also had 38% lower FFST, 40% lower muscleMRI and 47% lower muscleMRIfc (all p < 0.05). Intramuscular fat concentration was higher in children with CP (24% vs. 15%; p = 0.001). Children with CP had a 17% lower ratio of muscleMRIFC to FFST (0.62 ± 0.13 vs. 0.75 ± 0.06; d = 1.205, p = 0.004; Fig. 1B). Although children with CP also had a lower muscleMRI to FFST ratio, the difference was not statistically significant (0.82 ± 0.13 vs. 0.88 ± 0.06; d = 0.564, p = 0.138; Fig. 1A). A visual depiction of the muscle and fat discrepancies between a boy with CP and an age-matched typically developing boy is shown in Fig 2.
Table 1.
Physical characteristics, DXA measurements and MRI skeletal muscle mass in children with cerebral palsy (CP) and typically developing children (Con).
| CP (n = 15) | Con (n = 15) | d | p | |
|---|---|---|---|---|
| Ages (years) | 8.0 ± 2.4 | 8.3 ± 2.1 | 0.133 | 0.700 |
| Tanner stage (I/II/III) | ||||
| Pubic hair | 11/3/1 | 14/1/0 | 0.550 | 0.345 |
| Testicular-penile/breast | 11/4/0 | 13/1/1 | 0.137 | 0.595 |
| Height (m) | 1.20 ± 0.12 | 1.30 ± 0.11 | 0.869 | 0.022 |
| Height (%) | 17 ± 28 | 58 ± 30 | 1.413 | < 0.001 |
| Body mass (kg) | 24.7 ± 9.3 | 28.9 ± 7.0 | 0.510 | 0.067 |
| Body mass (%) | 32 ± 31 | 60 ± 26 | 0.979 | 0.012 |
| BMI (kg/m2) | 16.9 ± 3.4 | 16.8 ± 2.4 | 0.034 | 0.461 |
| BMI (%) | 50 ± 36 | 55 ± 28 | 0.155 | 0.694 |
| GMFCS (I/II) | 8/7 | - | ||
| FFST (g) | 163 ± 59 | 263 ± 77 | 1.447 | < 0.001 |
| Fat mass (g) | 125 ± 78 | 148 ± 61 | 0.321 | 0.161 |
| MuscleMRI (g) | 136 ± 61 | 228 ± 65 | 1.485 | < 0.001 |
| Intramuscular fat concentration (%) | 24 ± 8 | 15 ± 3 | 1.490 | 0.001 |
| MuscleMRIfc (g) | 103 ± 48 | 194 ± 54 | 1.786 | < 0.001 |
Values are mean ± SD. BMI = body mass index. % for height, body mass and BMI reflects the percentile relative to age- and sex- based norms; % for intramuscular fat concentration reflects the percent fat within the muscle; DXA= dual-energy X-ray absorptiometry; MRI = magnetic resonance imaging; GMFCS = gross motor function classification system; FFST = fat free soft tissue; MuscleMRI= muscle mass assessed by MRI; MuscleMRIfc= muscle mass assessed by MRI and corrected for fat concentration. d = Cohen’s d.
Fig. 1.
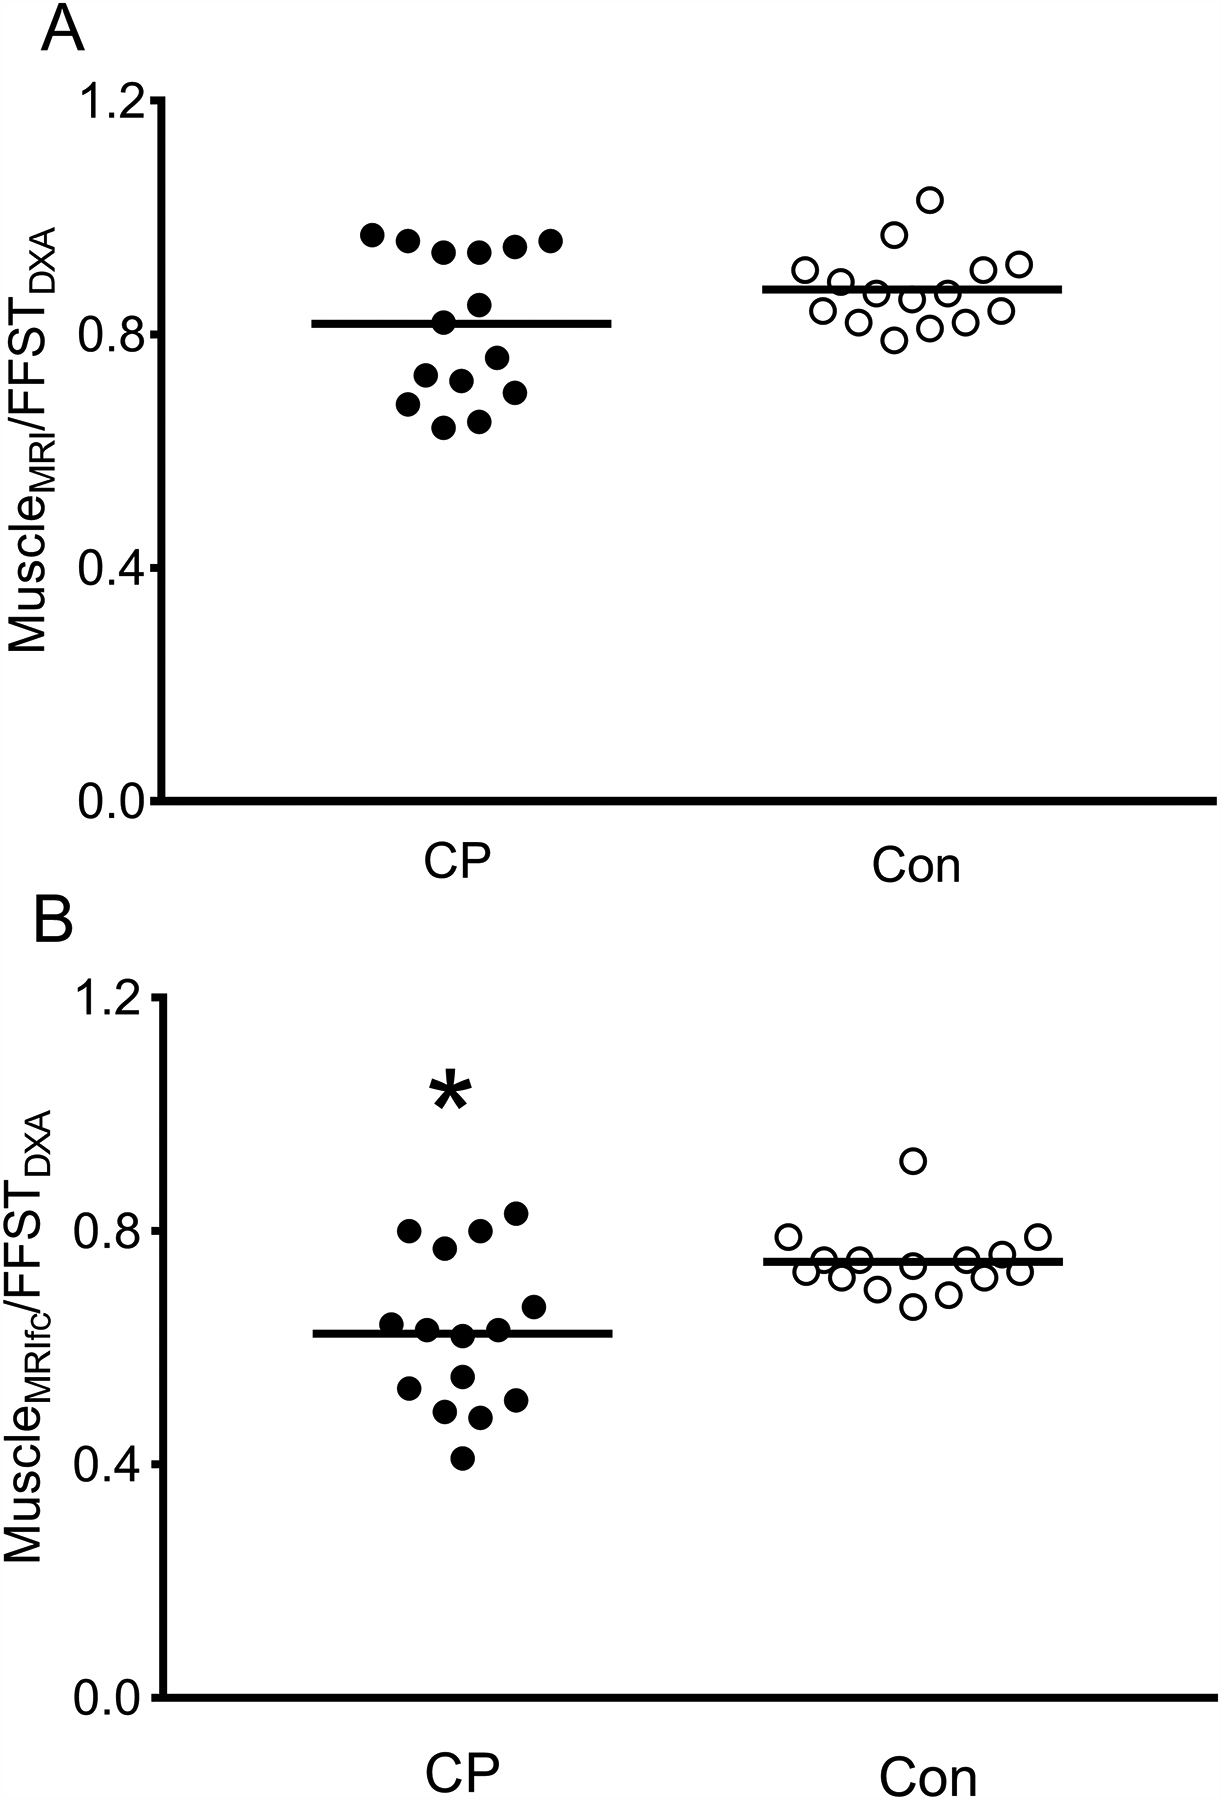
Ratio of muscle mass from MRI (MuscleMRI) to fat-free soft tissue from DXA (FFSTDXA; A) and muscle mass from MRI corrected for fat concentration (MuscleMRIfc) to FFSTDXA (B) in the midleg of children with cerebral palsy (CP; n = 15) and typically developing children (Con; n = 15). *Group difference, p < 0.05.
Fig. 2.

Magnetic resonance images from a boy with cerebral palsy (CP; A) and a typically developing boy (B) both 8.5 years of age at the level of the midtibia. The boy with CP had much lower muscle mass (large black arrow in A) and much higher intramuscular fat (smaller black arrow in A) compared to his typically developing peer.
Statistical model developed using typically developing children
Simple linear regression using FFST as the predictor explained 95% of the variance in muscleMRI in typically developing children (Table 2, model 1). Adding age or height didn’t significantly improve the model (both p > 0.05). However, adding body mass, BMI or fat mass individually significantly improved the model (all p < 0.05). Adding fat mass yielded the highest value explaining 98% of the variance in muscleMRI (Table 2, model 2). When the model with FFST and fat mass was cross-validated using the leave-one-out method, the estimated muscle mass (muscleDXA) was strongly related (r2 = 0.97, SEE = 11.8 g, p < 0.001) and not different from muscleMRI (p = 0.770). When the model was cross-validated in children with CP, muscleDXA was strongly related to muscleMRI, as shown in the scatter plot in Fig. 3A (r2 = 0.90, SEE = 20.0 g, p < 0.001). However, the model overestimated muscleMRI by 13% (17.3 g, p = 0.004), as shown by most data points and the regression line residing mainly below the line of identity in Fig. 3A and by most data points and mean difference line above the no difference line in the Bland-Altman plot in Fig. 3B.
Table 2.
Statistical models developed to estimate midleg muscle mass MRI using data from typically developing children (Con) and children with cerebral palsy (CP).
| Group | Model | R2 | SEE (g) |
|---|---|---|---|
| Con | 1. FFST (g) * 0.816 + 13.953 | 0.96 | 14.1 |
| 2. FFST (g) * 0.704 + fat mass (g) * 0.221 + 10.924 | 0.98 | 9.5 | |
| CP | 3. FFST (g) * 0.986 − 24.577 | 0.91 | 19.3 |
All models are statistically significant, p < 0.001; MRI = magnetic resonance imaging; FFST = fat-free soft tissue; n = 15/group.
Fig. 3.
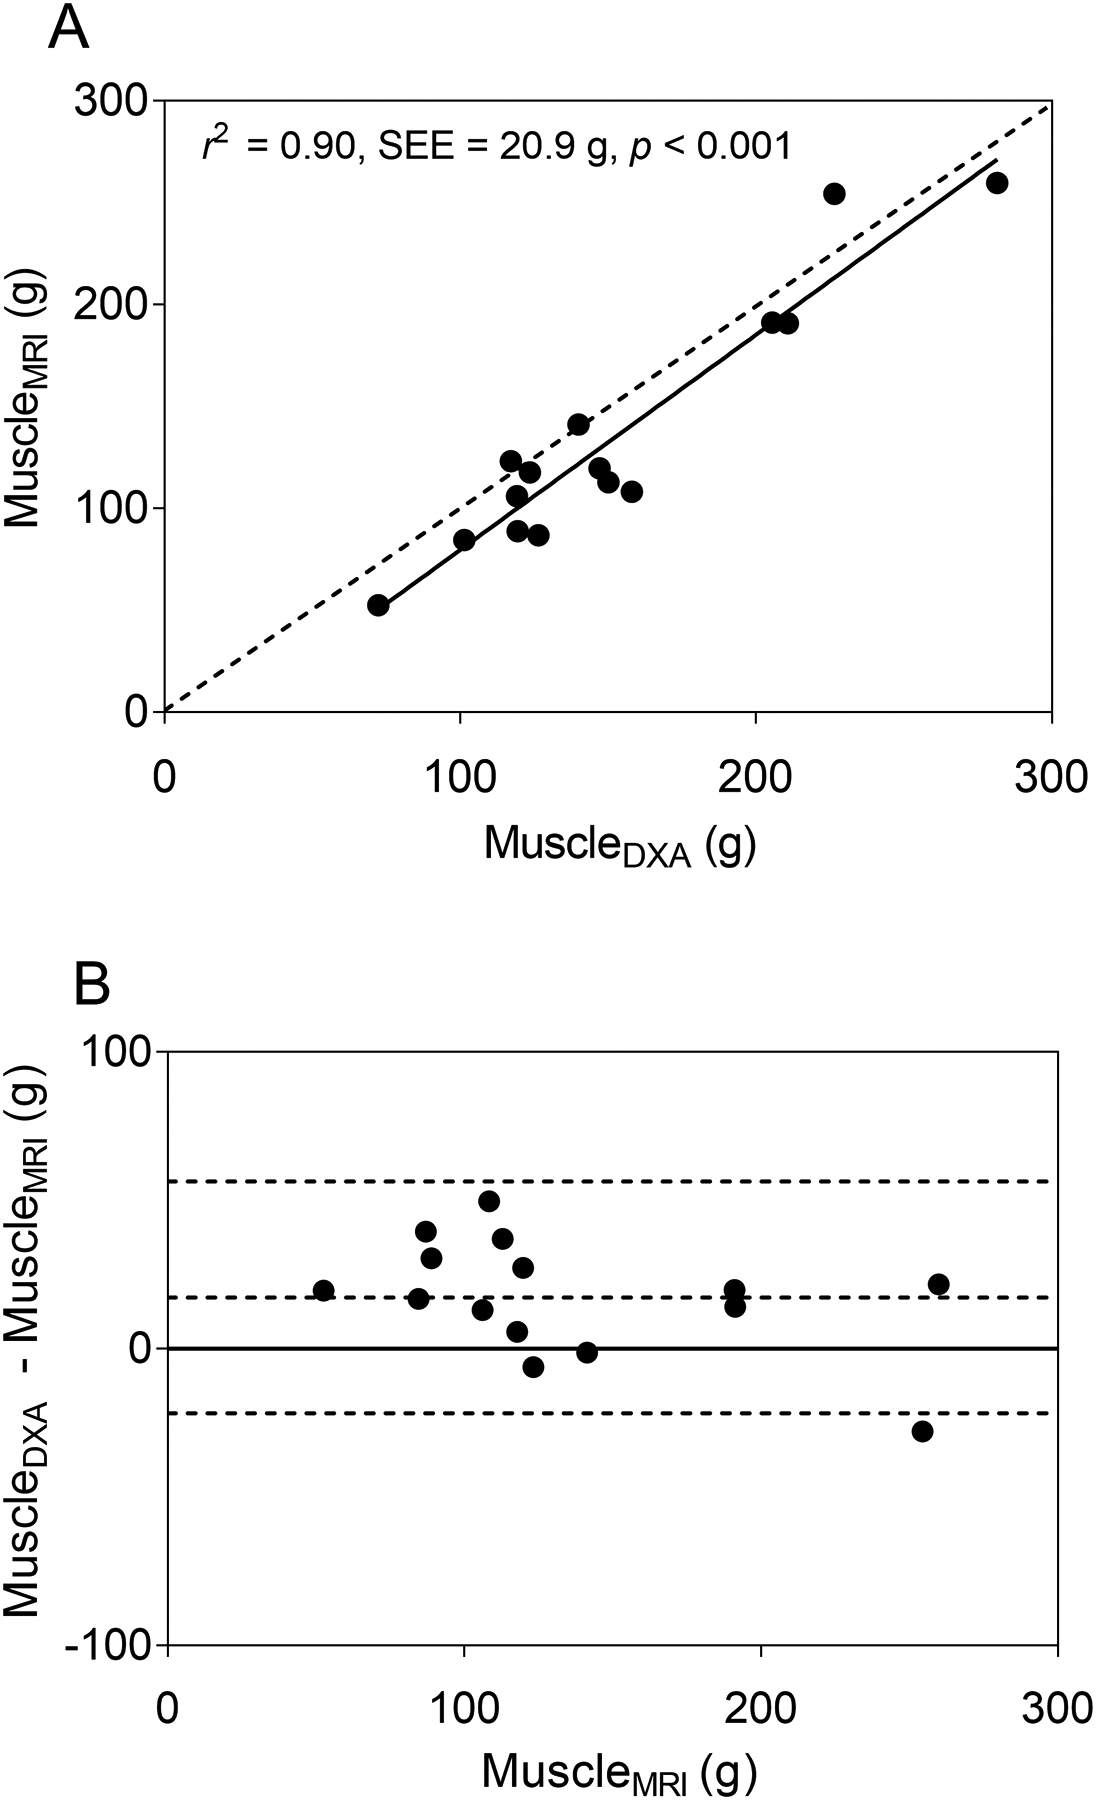
(A) The scatter plot shows midleg muscle mass (MuscleMRI) in children with cerebral palsy (CP; n = 15) estimated using a dual-energy X-ray absorptiometry (DXA) -based model (MuscleDXA) developed using data from typically developing children. MuscleDXA was estimated using fat-free soft tissue mass (FFST) from DXA. The dotted line represents the line of identity. The solid line represents the regression line. (B) The Bland-Altman plot shows the level of agreement between MuscleDXA and MuscleMRI. The dotted lines indicate the mean difference ± 2 SD between actual muscle mass from MRI and the estimated muscle mass by the DXA-based model in children with CP. The solid line indicates no difference between actual and estimated muscle mass.
Simple linear regression using FFST as the predictor explained 96% of the variance in muscleMRIfc in typically developing children (Table 3, model 1). None of the additional predictors significantly improved the model (all p > 0.05). When the final model with only FFST as the predictor was cross-validated using the leave-one-out method, the estimated muscle mass was also strongly related (r2 = 0.95, SEE = 12.7 g, p < 0.001) and not different from muscleMRIfc (p = 0.858). When the same model was cross-validated in children with CP, the estimated muscle mass (muscleDXAfc) was strongly related to muscleMRIfc, as shown in Fig. 4A (r2 = 0.83, SEE = 17.6 g, p < 0.001). However, the model overestimated muscleMRIfc by 22% (22.3 g, p = 0.001), as shown by most data points and the regression line residing below the line of identity in Fig. 4A and by most data points and the mean difference line above the no difference line in the Bland-Altman plot in Fig. 4B.
Table 3.
Statistical models developed to estimate midleg muscle mass from MRI corrected for fat concentration using data from typically developing children (Con) and children with cerebral palsy (CP).
| Group | Model | R2 | SEE (g) |
|---|---|---|---|
| Con | 1. FFST (g) * 0.684 + 14.350 | 0.96 | 10.7 |
| CP | 2. FFST (g) * 0.740 − 17.086 | 0.83 | 20.9 |
| 3. FFST (g) * 0.993 − body mass (kg) * 2.123 − 5.766 | 0.90 | 16.8 |
All models are statistically significant, p < 0.001; MRI = magnetic resonance imaging; FFST = fat-free soft tissue; n = 15/group.
Fig. 4.
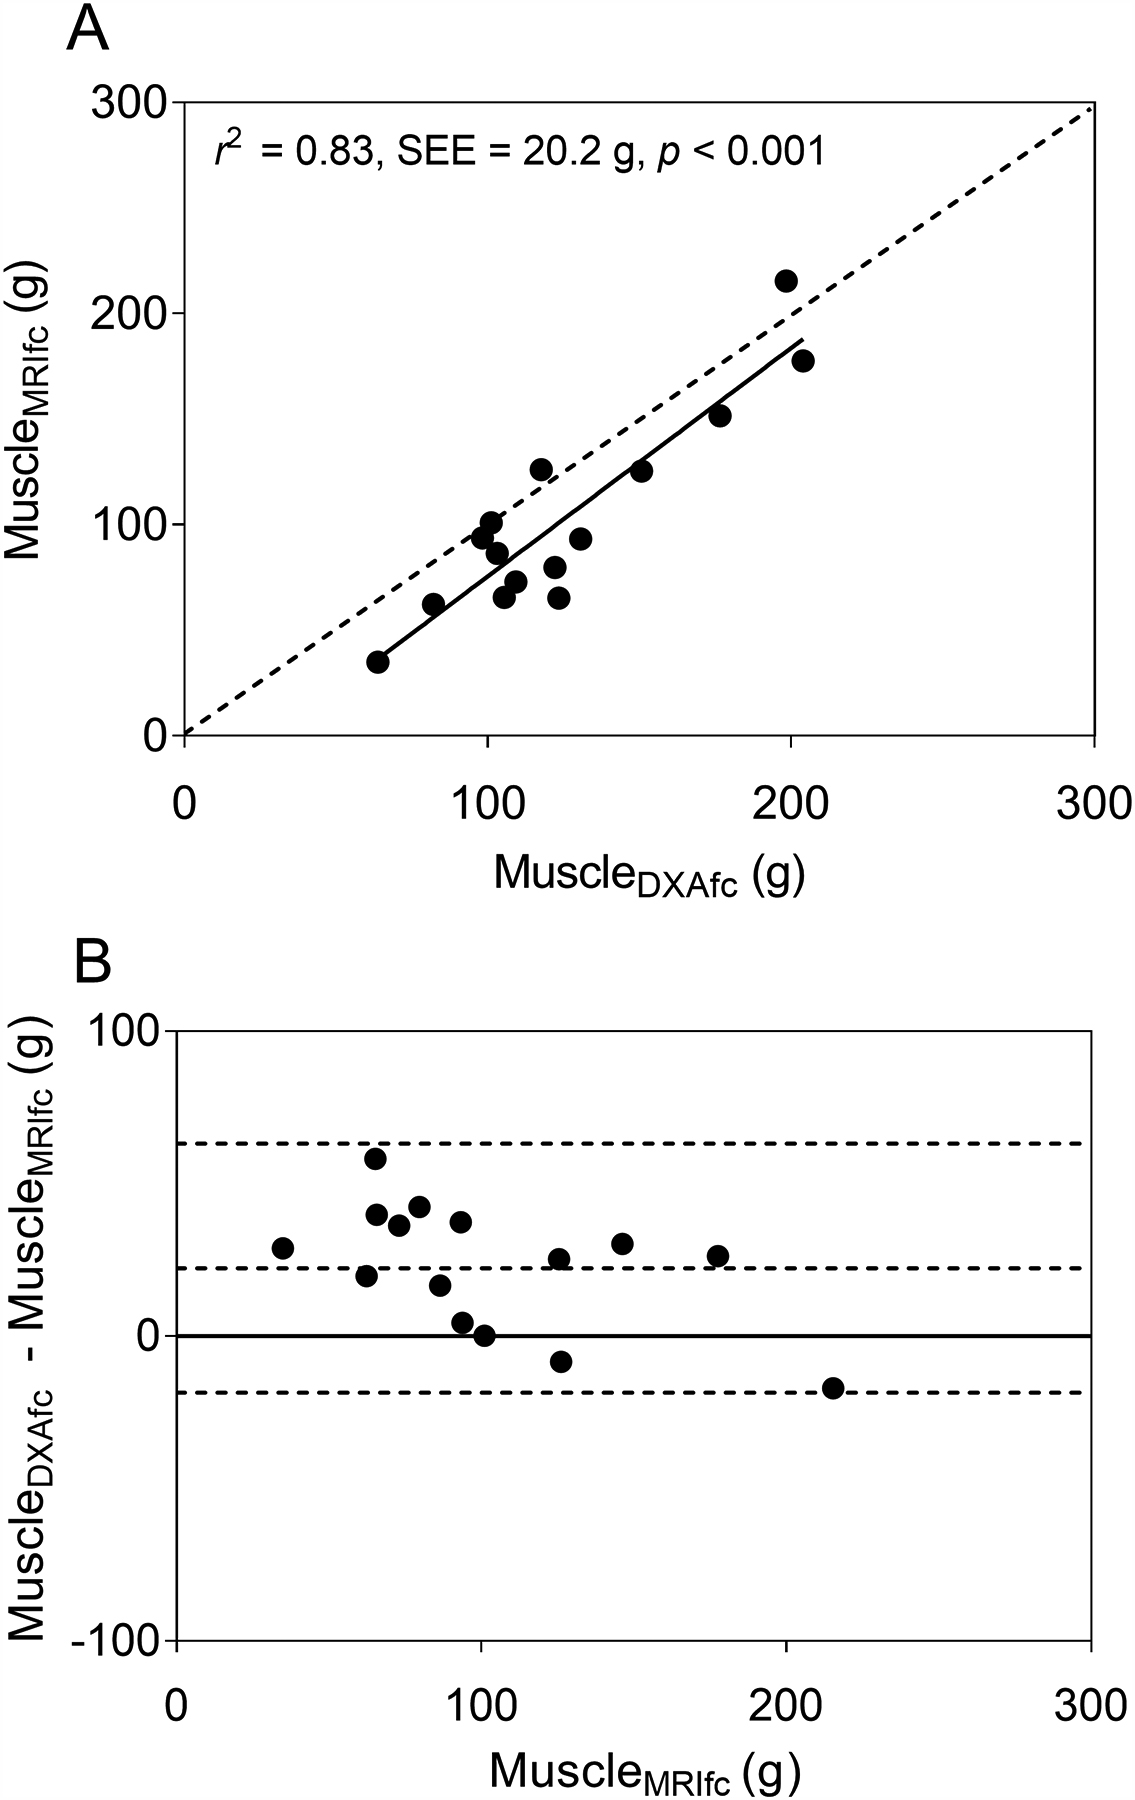
(A) The scatter plot shows midleg muscle mass adjusted for intramuscular fat concentration (MuscleMRIfc) in children with cerebral palsy (CP; n = 15) estimated using a dual-energy X-ray absorptiometry (DXA) -based model (MuscleDXAfc) developed using data from typically developing children. MuscleDXAfc was estimated using fat-free soft tissue mass (FFST) from DXA. The dotted line represents the line of identity. The solid line represents the regression line. (B) The Bland-Altman plot shows the level of agreement between MuscleDXAfc and MuscleMRIfc. The dotted lines indicate the mean difference ± 2 SD between actual muscle mass from MRI and the estimated muscle mass by the DXA-based model in children with CP. The solid line indicates no difference between actual and estimated muscle mass.
The difference between muscleDXA and muscleMRI in children with CP was inversely related to the ratio of muscle mass to FFST (r = −0.79, p < 0.001), as shown in Fig. 5A. The positive values for the difference between muscleDXA and muscleMRI indicate an overestimation of muscle mass by the DXA-based model, which was greatest in children with lowest ratio of muscleMRI to FFST. The overestimation declined as the average ratio of muscle to FFST in typically developing children (0.88) was approached. A similar inverse relationship was demonstrated between the difference in predicted muscle mass and muscleMRIfc and the ratio of muscleMRIfc to FFST (r = −0.95, p < 0.001; Fig. 5B). The overestimation was greatest in children with lowest ratio of muscle to FFST and became smaller as the average ratio of muscle to FFST in typically developing children (0.75) was approached.
Fig. 5.
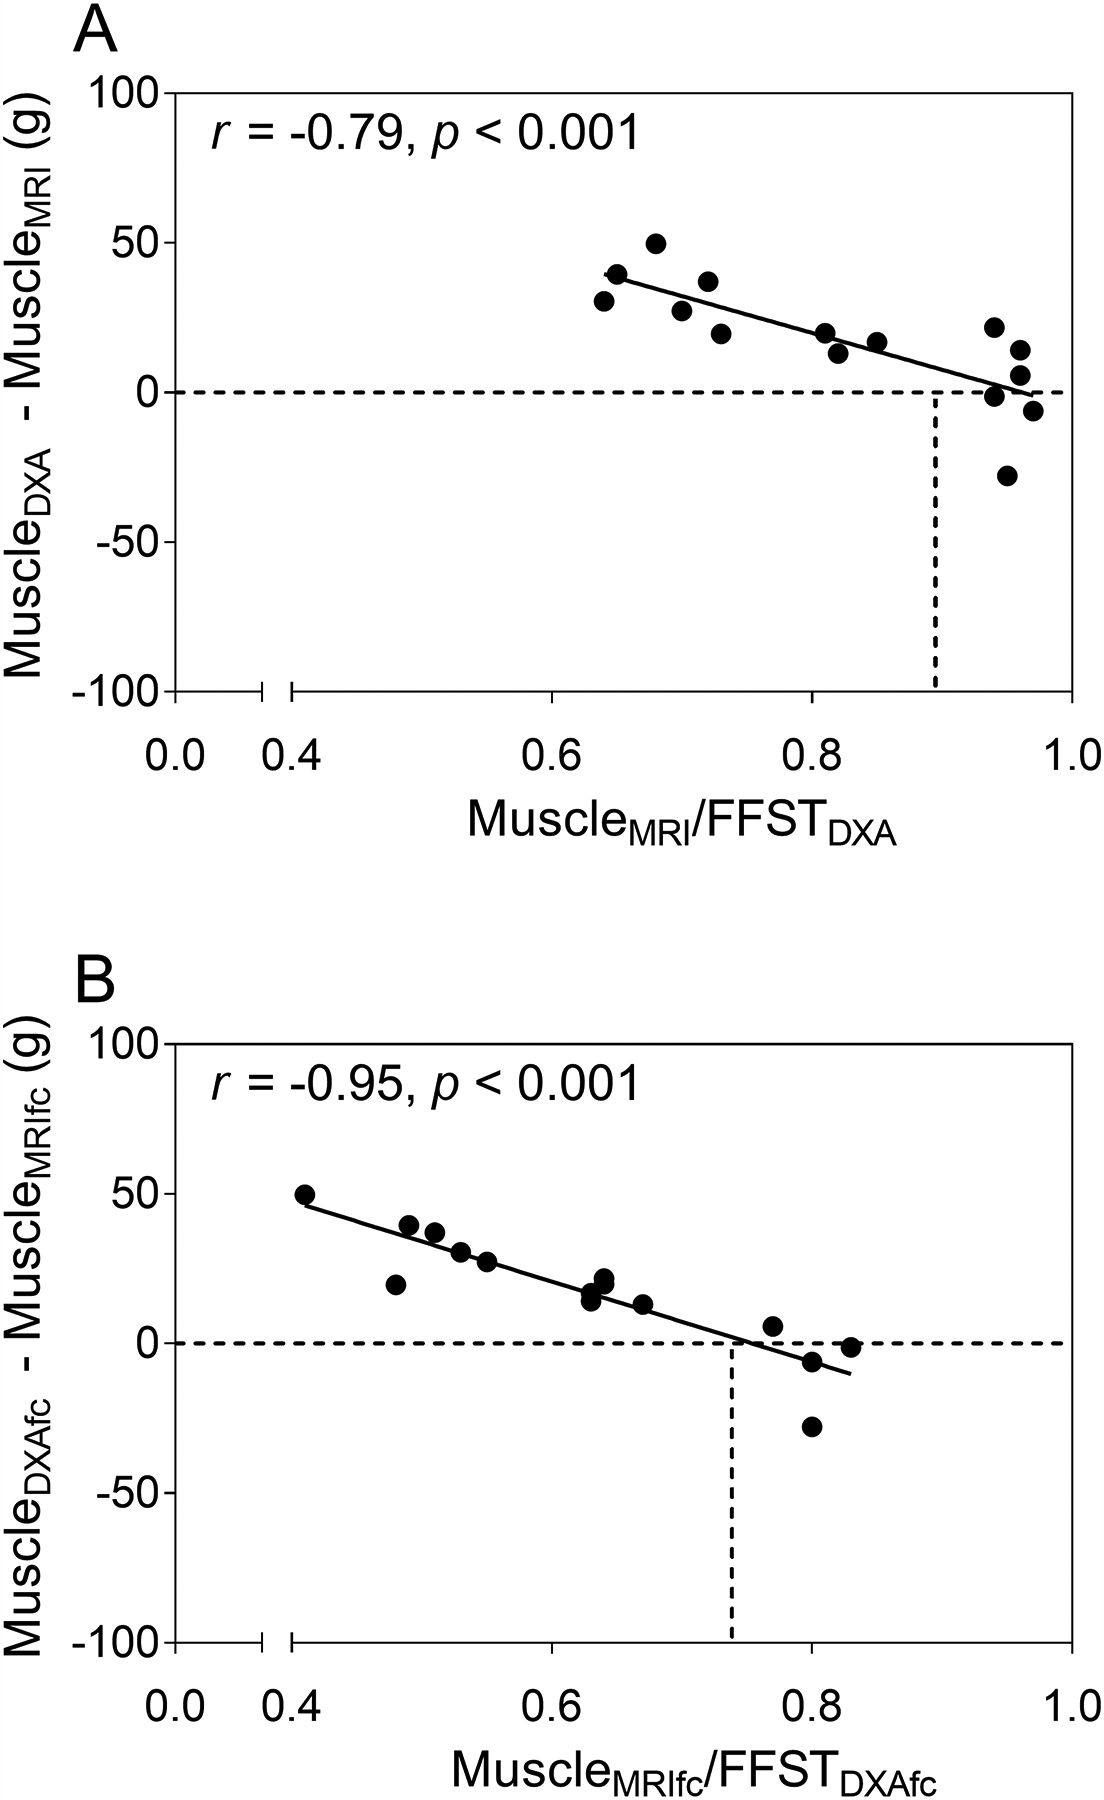
(A) Scatter plot of the ratio of muscle mass from MRI (MuscleMRI) to fat-free soft tissue mass from DXA (FFSTDXA) in the midleg compared to the difference between muscle mass estimated by the DXA-based model using data from controls (MuscleDXA) and MuscleMRI in children with cerebral palsy (CP; n = 15). (B) Scatter plot of the ratio of muscleMRI corrected for intramuscular fat concentration (MuscleMRIfc) to FFSTDXA in the midleg compared to the difference between MuscleDXA corrected for intramuscular fat concentration (MuscleDXAfc) and muscle mass MuscleMRIfc. The dashed horizontal lines represent the points where the difference between muscle mass estimated from DXA and MRI are zero. The dashed vertical lines represent the mean ratios of muscle mass from MRI to FFSTDXA (0.88 for MuscleMRI/FFSTDXA and 0.75 for MuscleMRIfc/FFSTDXA) for typically developing children.
Statistical model developed using children with CP
A simple regression model using FFST as the predictor explained 91% of the variance in muscleMRI in children with CP (Table 2, model 3). Adding age, height, body mass, BMI or fat mass as independent variables didn’t significantly improve the model (all p > 0.05). Estimated muscle mass using the model with FFST as the predictor was not different from muscleMRI (p > 0.990). The validity of estimation was excellent as shown by most data points and the regression line residing near the line of identity in Fig. 6A and by most data points and the mean difference line near the no difference line in the Bland-Altman plot in Fig. 6B. When the model was cross-validated using the leave-one out method, the estimated muscle mass was strongly related (r2 = 0.87 SEE = 21.8 g, p < 0.001) and not different from muscleMRI (p = 0.893).
Fig. 6.

(A) The scatter plot shows midleg muscle mass (MuscleMRI) in children with cerebral palsy (CP; n = 15) estimated using a dual-energy X-ray absorptiometry (DXA) -based model (MuscleDXA) developed using data from children with CP. MuscleDXA was estimated using fat-free soft tissue mass (FFST) from DXA. The dotted line represents the line of identity. The solid line represents the regression line. (B) The Bland-Altman plot shows the level of agreement between MuscleDXA and MuscleMRI. The dotted lines indicate the mean difference ± 2 SD between actual muscle mass from MRI and the estimated muscle mass by the DXA-based model. The solid line indicates no difference between actual and estimated muscle mass.
A second regression model using FFST as the predictor explained 83% of the variance in muscleMRIfc in children with CP (Table 3, model 2). Adding age, height, BMI or fat mass didn’t significantly improve the model (all p > 0.05). However, when body mass was added to the model, significant improvement was observed with 90% of the variance in muscleMRIfc explained (Table 3, model 3). Estimated corrected muscle mass using this model was not different from muscleMRIfc (p = 0.990). The validity of estimation was excellent as shown by most data points and the regression line residing near the line of identity in Fig. 7A and by most data points and the mean difference line near the no-difference line in the Bland-Altman plot in Fig. 7B. When the model was cross-validated using the leave-one out method, the estimated corrected muscle mass was strongly related (r2 = 0.83, SEE = 20.5 g, p < 0.001) and not different from muscleMRIfc (p = 0.785).
Fig. 7.

(A) The scatter plot shows midleg muscle mass adjusted for intramuscular fat concentration (MuscleMRIfc) in children with cerebral palsy (CP; n = 15) estimated using a dual-energy X-ray absorptiometry (DXA) -based model (MuscleDXAfc) developed using data from children with CP. MuscleDXAfc was estimated using fat-free soft tissue mass (FFST) from DXA. The dotted line represents the line of identity. The solid line represents the regression line. (B) The Bland-Altman plot shows the level of agreement between MuscleDXAfc and MuscleMRIfc. The dotted lines indicate the mean difference ± 2 SD between actual muscle mass from MRI and the estimated muscle mass by the DXA-based model in children with CP. The solid line indicates no difference between actual and estimated muscle mass.
DISCUSSION
To our knowledge, this is the first study to show that a DXA-based statistical model can provide accurate estimates of leg muscle mass in ambulatory children with spastic CP. Although models produced using typically developing children provided accurate estimates of muscle mass in typically developing children, they overestimated muscle mass by 13% and 22%, respectively, before and after correction for intramuscular fat in children with CP. The findings are important because children with CP have very low muscle mass in the leg and methods that provide accurate estimates of muscle mass are needed.
The finding that statistical models developed for typically developing children do not provide accurate estimates of muscle mass in children with CP is consistent with a previous study. In a small group of nonambulatory children with CP, midthigh muscle mass was overestimated by 12–15 % (p < 0.05) when a DXA-based model developed using typically developing children was used. The overestimation was attributed to the lower ratio of muscle to FFST in children with CP. An inverse relationship between this ratio and the degree of muscle mass overestimation supports the strong tie between the relative amount of muscle in the FFST and the accuracy of muscle mass estimated by DXA (9). Similarly, in the present study, muscle mass was overestimated by 13% when a model developed using typically developing children was employed, and the ratio of muscle to FFST was lower in the children with CP. Moreover, there was a strong inverse relationship between this ratio and the degree of muscle mass overestimation by a DXA-based models produced for typically developing children. Other than skeletal muscle, FFST also contains skin, vessels and other connective tissues. Assuming the nonskeletal muscle portion of FFST is not altered in children with CP, the compromised muscle mass will lead to a lower ratio of muscleMRI to FFST and muscleMRIfc to FFST in this population. It can be inferred that if children with CP had similar ratios of muscle mass to FFST as typically developing children, there would be no, or minimal overestimation, as indicated in Fig. 5.
Interestingly, in typically developing children, when fat mass was included as a predictor with FFST, the model improved significantly. However, the same improvement was not found in children with CP. Although both groups had a similar amount of fat mass as measured by DXA, the fat mass in children with CP actually represented a larger proportion of the leg soft tissue, as children with CP had 38% smaller FFST. Similarly, a study that assessed thigh skeletal muscle mass in men with spinal cord injury found a stronger relation between the difference in skeletal muscle and FFST when adipose tissue was accounted for in controls than that in people with spinal cord injury (25). The reason fat mass contributes to DXA-derived estimates of skeletal muscle mass in a healthy population but not in clinical populations who manifest reduced muscle mass is currently unknown but warrants further investigation.
To our knowledge, this is the first study to assess the accuracy of DXA estimates of muscle mass adjusted for intramuscular fat. This is important because intramuscular fat does not contribute to the force production of muscle and has been shown to be associated with decreased physical function (26). Compared to typically developing children, children with CP have a higher intramuscular fat concentration. Therefore, the disparity in muscle mass was even greater when intramuscular fat was subtracted from muscle mass (47% vs. 40% lower muscle mass in children with CP). As a result, DXA overestimated muscle mass corrected for fat concentration to a greater degree (22% vs. 13%, respectively). A DXA-based model developed for children with CP yielded much better accuracy, as indicated by the high amount of variance (90%) explained by the model and no difference in DXA and MRI estimates of muscle mass.
Small muscles have been linked to poor physical function and low participation in physical activity (14, 27), and thus may increase risk of chronic disease (28, 29). The risk is likely to rise as individuals with CP age (30, 31). This idea is supported by the much higher cardiovascular (32) and osteoporosis (31) risks in adults with CP compared to general population. Therefore, the muscle deficit in children with CP is an important therapeutic target for interventions aimed at improving physical function and physical activity and reducing long-term risk of developing chronic diseases. The present study ascertains the validity of using DXA to predict leg muscle mass, a region that has been found to have the largest muscle deficit in individuals with CP (13). The findings suggest that the DXA-based models developed in the present study provide an accessible, relatively cheap and accurate method to assess the skeletal muscle status in ambulatory children with spastic CP. However, studies are needed to determine whether the models can accurately capture the muscle changes in children with CP due to natural growth or treatment, such as resistance training (33), vibration treatment (34), and botulinum toxin (35).
There are limitations associated with this study. First, because of the relatively small number of subjects in each group, the results should be interpreted with caution. However, no differences in age or sexual maturity were observed and the composition of boys and girls was similar. Second, to estimate skeletal muscle mass, muscle volume was multiplied by 1.04 g/cm3, which is the assumed muscle density of muscle determined from adult cadavers (21). It’s possible that for children that are still growing, their true muscle density may not be the same as adults. It is also reasonable to infer that for children with CP whose muscle volume and quality are compromised, their muscle density may be lower than their typically developing peers. Therefore, the true muscle deficit in children with CP may be at a greater magnitude than what was presented in the current study. However, this potential discrepancy has been partly mediated by correcting for intramuscular fat concentration. The assumed density of fat (36) is lower than muscle, so the density of muscle for children with CP after correcting for fat concentration would be closer to that of typically developing children. Third, the findings from the present study can’t be extrapolated to other regions of the body.
In conclusion, DXA-based statistical models can accurately estimate midleg muscle mass in ambulatory children with spastic CP when the models are developed using data from children with CP. Models developed using data from typically developing children overestimate leg muscle mass in children with CP due to the lower proportion of muscle in the FFST of children with CP. Future studies are needed to determine whether the models developed in the present study are valid in children with more severe forms of CP and whether the models accurately estimate change that occurs with growth or intervention. Future studies are also needed to develop models to estimate muscle mass at other body regions in children with CP.
Supplementary Material
ACKNOWLEDGEMENTS
This work was supported by the National Institutes of Health, grant numbers HD071397 and HD090126.
Footnotes
Publisher's Disclaimer: This is a PDF file of an unedited manuscript that has been accepted for publication. As a service to our customers we are providing this early version of the manuscript. The manuscript will undergo copyediting, typesetting, and review of the resulting proof before it is published in its final citable form. Please note that during the production process errors may be discovered which could affect the content, and all legal disclaimers that apply to the journal pertain.
REFERENCES:
- 1.Sandow A Fundamental mechanics of skeletal muscle contraction. Am J Phys Med. 1952;31(2):103–25. [PubMed] [Google Scholar]
- 2.Szulc P, Beck TJ, Marchand F, and Delmas PD. Low skeletal muscle mass is associated with poor structural parameters of bone and impaired balance in elderly men--the MINOS study. J Bone Miner Res. 2005;20(5):721–9. [DOI] [PubMed] [Google Scholar]
- 3.Pedersen BK, and Febbraio MA. Muscles, exercise and obesity: skeletal muscle as a secretory organ. Nat Rev Endocrinol. 2012;8(8):457–65. [DOI] [PubMed] [Google Scholar]
- 4.Albu JB, Kovera AJ, Allen L, Wainwright M, Berk E, Raja-Khan N, et al. Independent association of insulin resistance with larger amounts of intermuscular adipose tissue and a greater acute insulin response to glucose in African American than in white nondiabetic women. Am J Clin Nutr. 2005;82(6):1210–7. [DOI] [PMC free article] [PubMed] [Google Scholar]
- 5.Janssen I, Heymsfield SB, and Ross R. Low relative skeletal muscle mass (sarcopenia) in older persons is associated with functional impairment and physical disability. J Am Geriatr Soc. 2002;50(5):889–96. [DOI] [PubMed] [Google Scholar]
- 6.Sinha R, Dufour S, Petersen KF, LeBon V, Enoksson S, Ma YZ, et al. Assessment of skeletal muscle triglyceride content by (1)H nuclear magnetic resonance spectroscopy in lean and obese adolescents: relationships to insulin sensitivity, total body fat, and central adiposity. Diabetes. 2002;51(4):1022–7. [DOI] [PubMed] [Google Scholar]
- 7.Kaji H Linkage between muscle and bone: common catabolic signals resulting in osteoporosis and sarcopenia. Curr Opin Clin Nutr Metab Care. 2013;16(3):272–7. [DOI] [PubMed] [Google Scholar]
- 8.Mitsiopoulos N, Baumgartner RN, Heymsfield SB, Lyons W, Gallagher D, and Ross R. Cadaver validation of skeletal muscle measurement by magnetic resonance imaging and computerized tomography. J Appl Physiol (1985). 1998;85(1):115–22. [DOI] [PubMed] [Google Scholar]
- 9.Modlesky CM, Cavaiola ML, Smith JJ, Rowe DA, Johnson DL, and Miller F. A DXA-based mathematical model predicts midthigh muscle mass from magnetic resonance imaging in typically developing children but not in those with quadriplegic cerebral palsy. J Nutr. 2010;140(12):2260–5. [DOI] [PMC free article] [PubMed] [Google Scholar]
- 10.Kim J, Shen W, Gallagher D, Jones A Jr., Wang Z, Wang J, et al. Total-body skeletal muscle mass: estimation by dual-energy X-ray absorptiometry in children and adolescents. Am J Clin Nutr. 2006;84(5):1014–20. [DOI] [PMC free article] [PubMed] [Google Scholar]
- 11.Kim J, Wang Z, Heymsfield SB, Baumgartner RN, and Gallagher D. Total-body skeletal muscle mass: estimation by a new dual-energy X-ray absorptiometry method. Am J Clin Nutr. 2002;76(2):378–83. [DOI] [PubMed] [Google Scholar]
- 12.Midorikawa T, Ohta M, Hikihara Y, Torii S, and Sakamoto S. Predicting skeletal muscle mass from dual-energy X-ray absorptiometry in Japanese prepubertal children. Eur J Clin Nutr. 2017;71(10):1218–22. [DOI] [PubMed] [Google Scholar]
- 13.Lampe R, Grassl S, Mitternacht J, Gerdesmeyer L, and Gradinger R. MRT-measurements of muscle volumes of the lower extremities of youths with spastic hemiplegia caused by cerebral palsy. Brain Dev. 2006;28(8):500–6. [DOI] [PubMed] [Google Scholar]
- 14.Johnson DL, Miller F, Subramanian P, and Modlesky CM. Adipose tissue infiltration of skeletal muscle in children with cerebral palsy. J Pediatr. 2009;154(5):715–20. [DOI] [PMC free article] [PubMed] [Google Scholar]
- 15.Elder GCB, Kirk J, Stewart G, Cook K, Weir D, Marshall A, et al. Contributing factors to muscle weakness in children with cerebral palsy. Dev Med Child Neurol. 2003;45(8):542–50. [DOI] [PubMed] [Google Scholar]
- 16.Whitney DG, Singh H, Miller F, Barbe MF, Slade JM, Pohlig RT, et al. Cortical bone deficit and fat infiltration of bone marrow and skeletal muscle in ambulatory children with mild spastic cerebral palsy. Bone. 2017;94:90–7. [DOI] [PMC free article] [PubMed] [Google Scholar]
- 17.Kuczmarski RJ, Ogden CL, Grummer-Strawn LM, Flegal KM, Guo SS, Wei R, et al. CDC growth charts: United States. Adv Data. 2000;314(314):1–27. [PubMed] [Google Scholar]
- 18.Tanner J Growth and Adolescence. Oxford: Blackwell Scientific Publications; 1962. [Google Scholar]
- 19.Wood E, and Rosenbaum P. The gross motor function classification system for cerebral palsy: a study of reliability and stability over time. Dev Med Child Neurol. 2000;42(5):292–6. [DOI] [PubMed] [Google Scholar]
- 20.Suckling J, Sigmundsson T, Greenwood K, and Bullmore ET. A modified fuzzy clustering algorithm for operator independent brain tissue classification of dual echo MR images. Magn Reson Imaging. 1999;17(7):1065–76. [DOI] [PubMed] [Google Scholar]
- 21.Snyder WS, Cook MJ, Nasset ES, Karhauserr LR, Howells GP, and Tipton IH. International Comission on Radiological Protection. Oxford; 1975. [Google Scholar]
- 22.Slade JM, Coe LM, Meyer RA, and McCabe LR. Human bone marrow adiposity is linked with serum lipid levels not T1-diabetes. J Diabetes Complications. 2012;26(1):1–9. [DOI] [PubMed] [Google Scholar]
- 23.Cohen J Statistical Power for the Behavioral Sciences. Hillsdale, NJ: Lawrence Erlbaum Associates; 1988. [Google Scholar]
- 24.Hawkins DM, Basak SC, and Mills D. Assessing model fit by cross-validation. J Chem Inf Comput Sci. 2003;43(2):579–86. [DOI] [PubMed] [Google Scholar]
- 25.Modlesky CM, Bickel CS, Slade JM, Meyer RA, Cureton KJ, and Dudley GA. Assessment of skeletal muscle mass in men with spinal cord injury using dual-energy X-ray absorptiometry and magnetic resonance imaging. J Appl Physiol (1985). 2004;96(2):561–5. [DOI] [PubMed] [Google Scholar]
- 26.Therkelsen KE, Pedley A, Hoffmann U, Fox CS, and Murabito JM. Intramuscular fat and physical performance at the Framingham Heart Study. Age. 2016;38(2). [DOI] [PMC free article] [PubMed] [Google Scholar]
- 27.Visser M, Goodpaster BH, Kritchevsky SB, Newman AB, Nevitt M, Rubin SM, et al. Muscle mass, muscle strength, and muscle fat infiltration as predictors of incident mobility limitations in well-functioning older persons. J Gerontol A Biol Sci Med Sci. 2005;60(3):324–33. [DOI] [PubMed] [Google Scholar]
- 28.Visser M, Pahor M, Taaffe DR, Goodpaster BH, Simonsick EM, Newman AB, et al. Relationship of interleukin-6 and tumor necrosis factor-alpha with muscle mass and muscle strength in elderly men and women: The health ABC study. J Gerontol A Biol Sci Med Sci. 2002;57(5):M326–M32. [DOI] [PubMed] [Google Scholar]
- 29.Kim S, Won CW, Kim BS, Choi HR, and Moon MY. The Association between the Low Muscle Mass and Osteoporosis in Elderly Korean People. J Korean Med Sci. 2014;29(7):995–1000. [DOI] [PMC free article] [PubMed] [Google Scholar]
- 30.Peterson MD, Gordon PM, Hurvitz EA, and Burant CF. Secondary muscle pathology and metabolic dysregulation in adults with cerebral palsy. Am J Physiol Endocrinol Metab. 2012;303(9):E1085–93. [DOI] [PMC free article] [PubMed] [Google Scholar]
- 31.Whitney DG, Hurvitz EA, Devlin MJ, Caird MS, French ZP, Ellenberg EC, et al. Age trajectories of musculoskeletal morbidities in adults with cerebral palsy. Bone. 2018;114:285–91. [DOI] [PubMed] [Google Scholar]
- 32.Whitney DG, Hurvitz EA, Ryan JM, Devlin MJ, Caird MS, French ZP, et al. Noncommunicable disease and multimorbidity in young adults with cerebral palsy. Clin Epidemiol. 2018;10:511–9. [DOI] [PMC free article] [PubMed] [Google Scholar]
- 33.McNee AE, Gough M, Morrissey MC, and Shortland AP. Increases in muscle volume after plantarflexor strength training in children with spastic cerebral palsy. Dev Med Child Neurol. 2009;51(6):429–35. [DOI] [PubMed] [Google Scholar]
- 34.Gusso S, Munns CF, Colle P, Derraik JGB, Biggs JB, Cutfield WS, et al. Effects of whole-body vibration training on physical function, bone and muscle mass in adolescents and young adults with cerebral palsy. Sci Rep-Uk. 2016;22518. [DOI] [PMC free article] [PubMed] [Google Scholar]
- 35.Williams SA, Reid S, Elliott C, Shipman P, and Valentine J. Muscle volume alterations in spastic muscles immediately following botulinum toxin type-A treatment in children with cerebral palsy. Dev Med Child Neurol. 2013;55(9):813–20. [DOI] [PubMed] [Google Scholar]
- 36.Fidanza F, Keys A, and Anderson JT. Density of body fat in man and other mammals. J Appl Physiol. 1953;6(4):252–6. [DOI] [PubMed] [Google Scholar]
Associated Data
This section collects any data citations, data availability statements, or supplementary materials included in this article.