

Abstract
MOOCs have great potential to innovate education, but lack of personalization. In this paper, we show how FUMA, a data-driven framework for student modeling and adaptation, can help understand how to provide personalized support to MOOCs students, specifically targeting video watching behaviors. We apply FUMA across several MOOCs to show how to: (i) discover video watching behaviors that can be detrimental for or conductive to learning; (ii) use these behaviors to detect ineffective learners at different weeks of MOOCs usage. We discuss how these behaviors can be used to define personalized support to effective MOOC video usage regardless of the target course.
Keywords: Personalization, Student modeling, MOOCs, Data mining
Introduction
While the popularity of Massive Open Online Courses (MOOCs) has risen to engage thousands of students in higher-education, there is still limited understanding on how to deliver personalized instruction in MOOCs to accommodate the needs and abilities of their very diverse audience. Research on MOOCs has mostly focused on analyzing the students’ logged data to model relevant states or behaviors, such as dropping-out [1–3], learning outcome [4, 5], or browsing strategies [6–8]. There is initial work on how to leverage such models to deliver personalized support in real time, e.g., to recommend better pathways in the course [9, 10] or tailor the course content [11, 12]. Although these studies provided encouraging results, further research is needed to broaden the understanding of which forms of personalization are effective in MOOCs.
In this paper, we contribute to this research by looking at the potential of providing adaptive interventions to support effective usage of MOOCs’ videos, a form of personalization largely unexplored thus far, except for recommending what videos to watch next [10, 13, 14]. We do so by leverage an existing framework for User Modeling and Adaptation (FUMA from now on) that we proposed to learn from data how to provide adaptation in exploratory learning environments [15, 16]. FUMA uses clustering of existing interaction data to learn which student behaviors are more or less conducive to effective learning. Next, association rule mining extracts behavioral patterns that characterize each clustered group of students. These association rules are then used to classify new students in terms of how well they are learning during interaction, and trigger real-time adaptive interventions designed to encourage effective behaviors and discourage ineffective ones. We have successfully applied FUMA to identify useful adaptations with two different interactive simulations [17, 18]. In this paper, we investigate if FUMA can also identify meaningful forms of adaptive support across several MOOCs.
We focus on video watching behaviors because videos typically account for a significant amount of the learning material in [19]. However, not all students use and benefit from videos at best [20–23], indicating the need for adaptive support that can promote effective video watching for all students. To the best of our knowledge, adaptive support for videos has been limited in MOOCs to recommending a video to watch [10, 13, 14], but not to counteract suboptimal behaviors while watching videos.
In this paper we make a first step toward this direction by providing insights on what forms of adaptation could promote effective video watching behaviors, along with a student model that can be deployed across MOOCs to drive these adaptations. Our results show in particular that FUMA can derive student models that distinguish with high accuracy effective and ineffective learners solely based on their video watching behaviors, indicating that these behaviors can be leveraged for defining the content of adaptive support to video watching during interaction. These results broaden the set of video watching behaviors that have been considered for adaptation in MOOCs, in particular by showing that behaviors related to how selectively the students interact with the videos can identify low learners, thus warranting the design of adaptive support. We also show that a single student model built with FUMA from these behaviors can generalize across several MOOCs, so as to drive adaptation regardless of the target MOOC.
Related Work
There has been extensive work on analyzing student clickstream data in MOOCs, typically by using data-mining techniques to identify relevant behaviors and learning strategies. In particular, several of these studies have leveraged the same data-mining techniques used in FUMA offline to mine students’ behaviors. For instance, clusters and association rules were mined in [6–8, 24, 25] to identify relationships among student’s behaviors and their engagement in the course. Unlike these works, FUMA can not only identify students’ behaviors that can be the target of adaptive support, but also detect these behaviors online, to build a student model and drive adaptive support accordingly.
There has been work focused on analyzing video watching behaviors in MOOCs. Li et al. [23] compared video behaviors related to pausing, seeking or replaying videos among effective and ineffective learners to understand what behaviors can hinder the student experience. Interaction data collected during video watching were used to predict performance on quiz in [26, 27] and dropping out in [28]. We contribute to these works by leveraging additional video watching behaviors than the ones they used, in particular related to how consistently students used the different video actions (pausing, seeking…) captured by the standard deviation of these usages across videos. We also contribute to these works by building a student model from these behaviors over multiple MOOC datasets, so as to examine the generality of the resulting student model.
A few other works have evaluated classifiers to predict dropout over several MOOC datasets, using standard classifiers and neural networks [29–32]. We contribute to these works by using solely video watching behaviors and a data-driven approach based on association rules, which are fully interpretable and can guide the design of adaptive support to video watching regardless of the target courses. We also extend [29–32] by modeling students’ learning performance across MOOCs rather than dropout.
In non-MOOC settings, previous works have shown that adaptive support can improve the student’s engagement and learning with educational videos, e.g., [33, 34]. In MOOCs, a few studies have evaluated the value of adaptive support. Adaptation recommending the next page or video to visit was delivered in [10, 13, 14] based on the previous pages/videos visited by the students, but not based on how students interact with the video. Other work tailored the course content to the students, depending on their learning performance [11] or their learning style [12]. Adaptive feedback has been explored in [35] to encourage students to be more active, when their clickstream data reveal a low level of engagement. Another work [31] provided encouragements to students predicted to be at risk of dropping-out by a classifiers trained on interaction data. Adaptive scaffolding to foster self-regulation can improve the amount of viewed videos in MOOCs [36]. While these works have shown that adaptation is MOOCs can be valuable, they have largely ignored adaptation to promote efficient video watching behaviors (e.g., dedicated adaptation to recommend effective pausing or seeking behaviors), which is the end goal of the data-driven student models we build in this paper.
FUMA Framework
FUMA consists of two main phases to guide the delivery of adaptive support, shown in Fig. 1 and described next (for a complete description, see [15, 16]).
Fig. 1.

FUMA’s framework
In the Behavior Discovery phase (Fig. 1, top), interaction data of previous students is first pre-processed into feature vectors. Next, clustering is applied to these vectors to identify students with similar interaction behaviors. The resulting clusters are analyzed by comparing the learning performance of the students in each cluster relatively to the other clusters. Next, association rule mining is used to identify the distinctive behaviors in each cluster. To do so, the values of features are discretized into bins to avoid producing a large number of fine-grained rules that are difficult to interpret, a well-known problem with association rules learnt on continuous features [16]. Hyper-parameters such as the number of clusters, the minimum support of the association rules, and the number of bins to be used for discretization, are learnt as part of the training process.
In the User Classification phase (Fig. 1, bottom), the labeled clusters and the corresponding association rules extracted in Behavior Discovery are used to train a classifier student model. As new students interact with the target MOOC, they would be classified in real-time into one of the identified clusters, based on a membership score that summarizes how well the student’s behaviors match the association rules for each cluster. In addition to classifying students, this phase returns the subset of association rules satisfied by the students that caused the classification. These rules can be used to trigger adaptation meant to encourage productive behaviors and discourage detrimental ones.
FUMA has been previously applied to two interactive simulations (CSP [15, 16] and CCK [18]), respectively to support learning about constraint satisfaction algorithms and electric circuits. For both simulations, results showed that FUMA identified two clusters of students, one with significantly higher learning gains than the other, solely by mining interaction behaviors. FUMA then classified unseen students as “low” or “high” learners significantly better than chance and other standard classifiers (e.g., random forests, SVM…), with accuracies above 85% [15, 18]. A user study [17] has shown that a version of the CSP simulation augmented with adaptive support provided by FUMA improved students learning, compared to no support or support provided at random.
Applying FUMA to MOOC Data
For this work we leverage four edX MOOC datasets collected at the Stanford University. These MOOCs include two science courses, namely computer science (CS101) and statistics (STAT), as well as two courses on social sciences and humanities, namely economics (ECO101) and the study of ancient texts (ATEXT). Table 1 summarizes the content of each of these MOOCs in terms of number of videos (#video) and quizzes (#quiz). Table 1 also includes number of students who accessed the course at least once (#students) and who passed the course (#passed). Students could pass by obtaining a final grade greater than a threshold set by the instructors, with the final grade defined as the number of successfully completed quizzes divided by the total number of quizzes.
Table 1.
Summary of MOOC content and enrollments.
| MOOC | Weeks | #video | #quiz | #students | #passed |
|---|---|---|---|---|---|
| CS101 | 6 | 33 | 29 | 114,205 | 10,311 (9%) |
| STAT | 9 | 65 | 69 | 78,631 | 5,504 (7%) |
| ECO101 | 8 | 72 | 34 | 18,873 | 1,854 (10%) |
| ATEXT | 6 | 33 | 36 | 98,028 | 7,842 (8%) |
Features Generated from MOOC’s Video Usage
We derived 23 features to capture important aspects of the student interaction with the videos, related to video views (Table 2a) and video actions performed (Table 2b).
Table 2.
List of features used for running FUMA.
|
a) Features on video views • Total number of videos views (both watches and rewatches) • Average and SD of the proportion of videos watched per week • Average and SD of the proportion of rewatched videos per week • Average and SD of the proportion of interrupted videos per week |
|
b) Features on actions performed within the videos • Frequency and Total number of all video actions performed • Frequency of video action performed, for each type of video action • Average and SD duration of: video pauses, seek length, and time speeding-up the video |
Video view features are meant to capture how engaged were the students in the video content. Specifically, the total number of video views indicates the overall level of activity of the students in terms of access to the video content, which is one of the most common measures for capturing video usage in MOOCs, e.g., [1, 6, 8, 24, 25]. Additionally, we leveraged features that characterize these video views in a more fine-grained manner, in terms of the mean and standard deviation (SD) of the proportion of videos watched, rewatched and interrupted per week. The average of these measures indicates how extensively students exhibit these behaviors overall, while the standard deviation shows the consistency of these behaviors across weeks.
Action features capture specific usage of each of the available action clicks from within the video in edX, namely play/resume, pause, seek backward, seek forward, change speed, and stop. Specifically, the frequency (number of actions divided by the time spent watching videos) and the total number of all actions performed reveals how active the students are when watching videos, which might indicate how engaged the student is. Furthermore, we distinguish between each type of action by measuring the frequency of each action performed, to understand what actions students tend to use more, which might reveal suboptimal usage of the video (e.g., seeking forward too frequently might indicate that the student skipped too much of the material). We also measure features that characterize how the students used some of these actions, which includes the average and standard deviation of the length of videos pauses, of the length of seeks, and of the time spent with a higher-than-normal speed (last three rows of Table 2b). The average of these measures indicate how students tended to use these actions overall (e.g., make short versus long pauses), while the standard deviation indicates the consistency of these usages across videos, as discussed above for video views features.
Building Student Models with FUMA
To account for the fact that the number of students changes overtime due to students dropping-out, we apply FUMA to three different sets of data for each MOOC, namely cumulative student activity data up to Week 2, up to Week 3, and up to Week 4. We ignored week 1 because about 50% of the students dropped the course during this week, which is typical in MOOCs and may provide irrelevant behaviors for FUMA. We also did not include weeks beyond week 4 because adaptive assistance is most useful early in the course [37]. We include only students who attempted to complete at least half of the quizzes available, because a portion of the students were active in the course but completed very few quizzes, for example because they did not care to obtain the certification, which would make it hard for FUMA to assess how well they learned.
The set of features in Table 1 are computed at each of the three weeks in each of the target MOOC. Next, we split the datasets into a training and holdout set, and train FUMA with two different setups: within-MOOC and across-MOOC. In the within-MOOC setup, FUMA is trained on the data from each MOOC separately, to ascertain how well FUMA can learn useful rules that are specific to the target MOOC. This produces four FUMA’s student models (one per MOOC). In the across-MOOC setup, FUMA is trained over a merged dataset that combines data from all of our MOOCs, to ascertain if FUMA can build a student model that generalizes across multiple MOOCs. Note that FUMA does not know which MOOC each student was taking.
Each of the five FUMA student models learned with these two setups at each week is tested on four holdout sets (one per MOOC). Each holdout set is generated beforehand by randomly sampling 100 students from the corresponding MOOC, so as the distribution of students who passed within the holdout set is the same as in the original dataset. The holdout sets are never seen by FUMA (cf. Fig. 1). 10-fold cross-validation is used on the training data to learn FUMA’s hyper-parameters (see Sect. 3).
Results
We evaluate the suitability of the student models generated by FUMA in terms of:
(i) The quality of the learned clusters, measured by the difference in learning performance between students in the different clusters. We measure learning performance as the combination of four indicators that are commonly used in MOOCs, without clear evidence as for which one is most representative of student learning on its own [1, 2, 27, 38]: the final grade (defined above); the proportion of correct first answers to quiz; whether the student passed; whether the student dropped. We combine these indicators using a Principal Component Analysis (PCA) with one component (PCA-Metric from now on), which explained >80% of the variance as recommended for PCA [39].
- (ii) The classification accuracy of FUMA’s rule-based classifiers trained on the obtained clusters. We compare FUMA against a majority-class baseline, which always assigns students to the largest cluster, as well as a Support Vector Machine (SVM) and a Random Forest (RF) classifier. All features in the training set are leveraged to train these classifiers, and their accuracy is measured on the same holdout sets as used for FUMA. This is to ensure that the association rules learned by FUMA are accurate enough at assigning students to their relevant cluster, as compared to SVM and RF, which have been extensively used for student modeling in MOOCs [2, 32, 40–42].
Table 3.
Statistical comparisons among the clusters (abbreviated “cl”).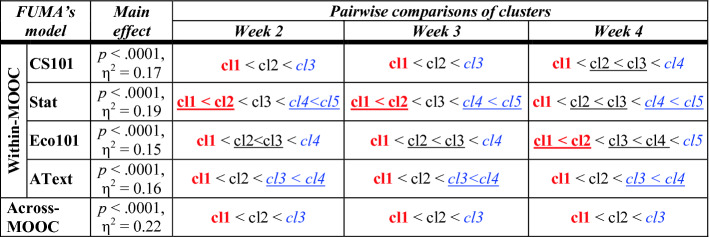
(iii) The potential usefulness of the association rules generated by FUMA in identifying behavior patterns that can be used to design and trigger support to students. In doing so we provide insights about the forms of adaptive support our results suggest.

Quality of the Clusters
The optimal number of clusters found by FUMA ranges from 3 to 5 depending on the target MOOC and setup (within-MOOCS vs across-MOOCS). To ascertain whether the students’ video watching behaviors are representative of their learning performance we run a statistical analysis that compares our measure of students’ performance (PCA-Metric) across clusters. Specifically, for each of the 5 FUMA’s student model and each of the 3 weeks of data, we run a Kruskal–Wallis test with PCA-Metric as the dependent variable, and the corresponding clusters as the factor, for a total of 15 tests, adjusted for family-wise error using the Holm adjustment (α = 15). The results, shown in Table 2 (“Main effect”), reveal a significant (i.e., p < .05) main effect of clusters in all tests. Effect sizes are reported as large for η2 > .14, medium for η2 > .06, small otherwise.
Post-hoc pairwise comparisons with Holm-adjusted Mann–Whitney U tests are shown in the right portion of Table 2: the clusters are ranked based on their mean PCA-Metric, with underlines indicating clusters that are not statistically different by this measure. Results show that in all datasets the clusters can be further categorized into three main groups based on the levels of PCA-Metric, namely a group representing students with lower learning compared to all the others (bold red), a group representing students with higher learning (italic blue), and a group representing moderate learning in between (regular black), with medium to high effect sizes. Noteworthy, these three main groups are found in all datasets, including across-MOOC, which indicates that these three general levels of performance generalize well across our MOOCs.
Classification Accuracy of the Online Rule-Based Classifiers
Classification accuracy is measured as percentage of unseen students in the relevant holdout sets that are assigned to their relevant cluster. As a first step, we compare the accuracy of each FUMA student model against the corresponding SVM, RF, and baseline classifiers. To do so we run a set of ANOVAs (one per FUMA model) with classification accuracy as the dependent variable, and classifiers (4 levels) as the factor. After adjustment, all ANOVAs yield a significant main effect of classifiers (p < 0.001, η2 from 0.14 to 0.21). Holm-adjusted pairwise comparisons show that FUMA outperforms all other classifiers (p < 0.05, η2> .10) in all cases, including the baseline.
Next, we explore FUMA’s accuracy across the two different prediction setups (within- and across-MOOC) and the three weeks. Table 4 reports FUMA’s accuracy in each of the four MOOCs (i.e., the corresponding holdout set), with the last row showing the accuracy averaged over all holdout sets. We run an ANOVA with classification accuracy as the dependent variable, week (3 levels) and prediction setup (2 levels: within-MOOC and across-MOOC) as the factors. Results show a significant main effect of prediction setup (p < .001, η2 = 0.09). A follow-up pairwise comparison among the setups reveals that accuracy for within-MOOC is significantly higher than across-MOOC. This is not surprising given that the within-MOOC setup allows FUMA to learn rules that are fully tailored to a given MOOC, albeit not all of these rules may generalize well. This said, it is noteworthy that even across-MOOC prediction accuracy is much higher than the baseline, and only about 5% below the within-MOOC setup on average. This indicates that FUMA is able to learn a set of rules that can generalize well across our MOOCs, a useful finding since the across-MOOC student model can then be leveraged to drive the delivery of adaptive support regardless of the current MOOC.
Table 4.
Prediction accuracy of FUMA.
| Within-MOOC | Across-MOOC | |||||
|---|---|---|---|---|---|---|
| Week 2 | Week 3 | Week 4 | Week 2 | Week 3 | Week 4 | |
| CS101 | 88% | 88% | 78% | 82% | 83% | 75% |
| Stat | 79% | 77% | 76% | 70% | 72% | 72% |
| Eco101 | 83% | 84% | 80% | 78% | 79% | 73% |
| AText | 87% | 82% | 82% | 82% | 77% | 76% |
| Average | 84% | 82% | 80% | 78% | 77% | 74% |
The lack of main effect of week is also interesting because it means that peak accuracy can be already achieved at week 2, leaving substantial time to provide adaptation.
We report in Table 5 the class accuracy for FUMA at predicting each of the main groups identified in Sect. 5.1, i.e., low, moderate and high learning group. For simplicity, we only report class accuracy averaged over all holdout sets. Results show that FUMA reaches high accuracy at identifying high and low learning students both within-MOOC (87–88% at week 2) and across-MOOC (84%–85% at week 2), while still being able to predict the in-between clusters with over 60% accuracy. The fact that high accuracy is obtained for the low group is especially important, as these students are the ones who need help and may benefit from adaptive support. These results provide encouraging evidence for the usefulness of association rule mining for building a student model across MOOCs, which is interesting because association rules are interpretable and thus can be used to guide the design of adaptation support, as discussed next.
Table 6.
Association rules learnt by FUMA.

Implications of the Rules for Adaptation
We discuss how the association rules identified by FUMA can inform the design of adaptive support for video watching. We focus on the rules learned in the across-MOOC setup as they can be used drive adaptation regardless of the target MOOC. Among these, we focus on the rules representative of the “Lower learning” and “Higher learning” clusters, because they most clearly identify behaviors detrimental vs conductive to learning respectively, and thus can be used to derive adaptive support to discourage the ineffective behaviors and promote instead the effective ones exhibited in the high learning group. Such behavioral recommendations have been successfully applied in previous applications of FUMA to improve students’ learning [17, 43].
Table 6 shows these rules grouped as those that generalize across all weeks (first row), rules for week 2 and 3 because they largely overlap (second row), and rules that appear at week 4 only (third raw). As discussed in Sect. 3, FUMA discretizes the features into bins, with the number of bins (6 in our case) being learnt during model training. For ease of interpretation we label the bins for the rules in Table 6 as Low for bins 1–2, Medium (Med) for bins 3–4, and High for bins 5–6. When rules share behaviors they are merged in Table 6 as indicated by the indents, e.g., Rule L1a and L1b differ only in terms of the indented behaviors: ‘sd_seek’ for Rule L1a and ‘sd_speed’ for L1b.
Table 5.
Class accuracy of FUMA averaged over all holdout sets.
| Learner group | Within-MOOC | Across-MOOC | ||||
|---|---|---|---|---|---|---|
| Week 2 | Week 3 | Week 3 | Week 2 | Week 3 | Week 4 | |
| Low | 88% | 86% | 87% | 84% | 84% | 80% |
| Moderate | 67% | 65% | 65% | 61% | 60% | 59% |
| High | 87% | 86% | 85% | 85% | 83% | 82% |
One trend common to all rules for the lower learning group is that they watch few videos (num_view = Low), which intuitively explains their lower learning performance. This low video watching activity however, is always accompanied by other interesting patterns in these rules, especially making short pauses (avg_pause = Low, rules L1a and L1b) and/or exhibiting a low standard deviation for video action features (seek, speed and pause, rules L1a, L1b and L3). The short pauses suggest that these students may not take the time to think about the few videos they watch. The low standard deviations suggest that they were watching videos in a rather uniform manner, rather than selectively focusing on aspects that might be more challenging or interesting for them.
The fact that most of these behaviors are pervasive in students with lower learning performance at all weeks (see rules L1a and L1b), indicates that these students do not modify these behaviors over the course of the different MOOCs, which makes them a suitable target of adaptive support. This support may leverage the rules discovered in the higher learning groups to identify and promote behaviors that can address some of difficulties in the lower learning group, a strategy that has been successfully applied in previous work on FUMA [17]. As shown in Table 6, these “higher learning” behaviors are not always the exact opposite of those representative of lower learning, indicating that it is important to mine the representative behaviors of each cluster separately.
For instance, as discussed above the lower learning students tend to take short pauses during video watching throughout the weeks. In week 2–3 the high learning group shows the opposite behavior of pausing longer (avg_pause = Medium/High, rule H2a and H3). These longer pauses are accompanied by covering more of the weekly videos available (avg_coverage = Medium/High, rule H2a) a behavior that does not have a direct opposite in lower learning students. The fact that a high coverage of the weekly videos is linked to higher performance makes sense, because each video often introduces new knowledge that can be the target of a quiz. Thus, it is worth experimenting with adaptive support that, in weeks 2–3, recommends longer pauses to students in the lower learning group who tend to go through videos with little pausing, a help strategy that has been shown to be effective with FUMA [17]. This adaptive support should also promotes good video coverage, e.g., by recommending an unwatched video.
This higher coverage of the higher learning group also appears at week 2 and 3 in conjunction with a higher standard deviation of pausing (sd_pause = Medium, rule H2b). Because during these weeks the lower learning group shows the opposite behaviors of pausing uniformly (sd_pause = Low, rule L3), these students could benefit from recommendation to be more selective in how they pause (e.g., by reminding them that it is okay to take their time for pausing to reflect on parts a video that are unclear or interesting), combined with the aforementioned suggestion to cover more of the videos.
In week 4, the high learning group still shows the behavior of pausing longer, but now accompanied by a more selective pause length (sd_pause = Medium, rule H4a) and video speed (sd_speed = Medium, rule H4b), suggesting the need to recommend different behaviors to the low learning students later in the course. In particular, the low learning group may still benefit from suggestion to take longer pauses, but also to be more selective in how they use the aforementioned video actions.
Conclusion
We have presented an application of FUMA to students’ video usage in several MOOCs. FUMA is a framework that uses logged interaction data to learn which student behaviors should trigger adaptive help. Our results show that the behaviors learnt by FUMA can predict student learning performance during interaction with a MOOC with accuracy up to 84% across several MOOC datasets lumped together. In particular, our findings reveal that low learners can be identified by their tendency to watch few videos while making short pauses, as well as by their rather uniform usage of the video actions as shown by the low standard deviation of their pause length, seek length, and video speed. This finding is interesting because, to the best of our knowledge, we are the first to mine behaviors related to the consistency (standard deviation) of some of these video watching behaviors for informing the design of adaptive support in MOOCs. Based on these findings, we provided insights on how these behaviors can guide the design of adaptive support in MOOCs to promote better video watching strategies, based on the opposite behaviors shown by high learning students. Moving forward, we plan to collaborate with MOOC instructors to design and implement adaptive support based on FUMA’s rules. We are also deploying FUMA on the cloud so has to drive this adaptive support remotely in several MOOCs, and evaluate the value of such support, an important step toward making MOOCs more personalized using data-driven approaches.
Contributor Information
Ig Ibert Bittencourt, Email: ig.ibert@ic.ufal.br.
Mutlu Cukurova, Email: m.cukurova@ucl.ac.uk.
Kasia Muldner, Email: kasia.muldner@carleton.ca.
Rose Luckin, Email: r.luckin@ucl.ac.uk.
Eva Millán, Email: eva@lcc.uma.es.
Sébastien Lallé, Email: lalles@cs.ubc.ca.
Cristina Conati, Email: conati@cs.ubc.ca.
References
- 1.Li, W., Gao, M., Li, H., Xiong, Q., Wen, J., Wu, Z.: Dropout prediction in MOOCs using behavior features and multi-view semi-supervised learning. In: 2016 International Joint Conference on Neural Networks (IJCNN), pp. 3130–3137. IEEE (2016)
- 2.Nagrecha, S., Dillon, J.Z., Chawla, N.V.: MOOC dropout prediction: lessons learned from making pipelines interpretable. In: Proceedings of the 26th International Conference on World Wide Web Companion, pp. 351–359. International World Wide Web Conferences Steering Committee (2017)
- 3.Zhao, C., Yang, J., Liang, J., Li, C.: Discover learning behavior patterns to predict certification. In: 2016 11th International Conference on Computer Science & Education (ICCSE), pp. 69–73. IEEE (2016)
- 4.Wang, Z., Zhu, J., Li, X., Hu, Z., Zhang, M.: Structured knowledge tracing models for student assessment on Coursera. In: 2016 Proceedings of the Third ACM Conference on Learning@ Scale, pp. 209–212. ACM (2016)
- 5.Pardos, Z.A., Bergner, Y., Seaton, D.T., Pritchard, D.E.: Adapting Bayesian knowledge tracing to a massive open online course in edX. In: EDM, vol. 13, pp. 137–144 (2013)
- 6.Liu S, Hu Z, Peng X, Liu Z, Cheng HN, Sun J. Mining learning behavioral patterns of students by sequence analysis in cloud classroom. Int. J. Distance Educ. Technol. (IJDET) 2017;15:15–27. doi: 10.4018/IJDET.2017010102. [DOI] [Google Scholar]
- 7.Boroujeni, M.S., Dillenbourg, P.: Discovery and temporal analysis of latent study patterns in MOOC interaction sequences. In: Proceedings of the 8th International Conference on Learning Analytics and Knowledge, pp. 206–215. ACM (2018)
- 8.Liu, T., Xiu, L.L.: Finding out reasons for low completion in MOOC environment: an explicable approach using hybrid data mining methods. In: 2017 Proceedings of the International Conference on Modern Education and Information Technology, pp. 376–384. DEStech (2017)
- 9.Rosen, Y., Rushkin, I., Ang, A., Federicks, C., Tingley, D., Blink, M.J.: Designing adaptive assessments in MOOCs. In: 2017 Proceedings of the Fourth ACM Conference on Learning@ Scale, pp. 233–236. ACM (2017)
- 10.Ketamo, H.: Learning fingerprint: adaptive tutoring for MOOCs. In: EdMedia: World Conference on Educational Media and Technology. Association for the Advancement of Computing in Education (AACE) (2014)
- 11.Brinton CG, Rill R, Ha S, Chiang M, Smith R, Ju W. Individualization for education at scale: MIIC design and preliminary evaluation. IEEE Trans. Learn. Technol. 2015;8:136–148. doi: 10.1109/TLT.2014.2370635. [DOI] [Google Scholar]
- 12.Sonwalkar, N.: The first adaptive MOOC: a case study on pedagogy framework and scalable cloud architecture—part I. In: MOOCs Forum, pp. 22–29. Mary Ann Liebert, Inc., New Rochelle (2013)
- 13.Bhatt C, Cooper M, Zhao J, et al. SeqSense: video recommendation using topic sequence mining. In: Schoeffmann K, et al., editors. MultiMedia Modeling; Cham: Springer; 2018. pp. 252–263. [Google Scholar]
- 14.Cooper, M., Zhao, J., Bhatt, C., Shamma, D.A.: MOOCex: exploring educational video via recommendation. In: Proceedings of the 2018 ACM on International Conference on Multimedia Retrieval, pp. 521–524. ACM, New York (2018). 10.1145/3206025.3206087
- 15.Conati C, Kardan S. Student modeling: Supporting personalized instruction, from problem solving to exploratory open ended activities. AI Mag. 2013;34:13–26. doi: 10.1609/aimag.v34i3.2483. [DOI] [Google Scholar]
- 16.Kardan, S., Conati, C.: A framework for capturing distinguishing user interaction behaviors in novel interfaces. In: EDM, pp. 159–168 (2011)
- 17.Kardan, S., Conati, C.: Providing adaptive support in an interactive simulation for learning: an experimental evaluation. In: Proceedings of the 33rd Annual ACM Conference on Human Factors in Computing Systems, pp. 3671–3680. ACM, Seoul (2015)
- 18.Fratamico L, Conati C, Kardan S, Roll I. Applying a framework for student modeling in exploratory learning environments: comparing data representation granularity to handle environment complexity. Int. J. Artif. Intell. Educ. 2017;27:320–352. doi: 10.1007/s40593-016-0131-y. [DOI] [Google Scholar]
- 19.Yousef, A.M.F., Chatti, M.A., Schroeder, U., Wosnitza, M.: What drives a successful MOOC? An empirical examination of criteria to assure design quality of MOOCs. In: 2014 IEEE 14th International Conference on Advanced Learning Technologies (ICALT), pp. 44–48. IEEE (2014)
- 20.Kim, J., Guo, P.J., Seaton, D.T., Mitros, P., Gajos, K.Z., Miller, R.C.: Understanding in-video dropouts and interaction peaks in online lecture videos. In: Proceedings of the First ACM Conference on Learning @ Scale Conference, pp. 31–40. ACM, New York (2014). 10.1145/2556325.2566237
- 21.Guo, P.J., Kim, J., Rubin, R.: How video production affects student engagement: an empirical study of MOOC videos. In: Proceedings of the First ACM Conference on Learning @ Scale Conference, pp. 41–50. ACM, New York (2014). 10.1145/2556325.2566239
- 22.Mitrovic A, Dimitrova V, Lau L, Weerasinghe A, Mathews M. Supporting constructive video-based learning: requirements elicitation from exploratory studies. In: André E, Baker R, Hu X, Rodrigo M, du Boulay B, editors. Artificial Intelligence in Education; Cham: Springer; 2017. pp. 224–237. [Google Scholar]
- 23.Li N, Kidziński Ł, Jermann P, Dillenbourg P. MOOC video interaction patterns: what do they tell us?. In: Conole G, Klobučar T, Rensing C, Konert J, Lavoué É, editors. Design for Teaching and Learning in a Networked World; Cham: Springer; 2015. pp. 197–210. [Google Scholar]
- 24.Athira L, Kumar A, Bijlani K. Discovering learning models in MOOCs using empirical data. In: Shetty NR, Prasad NH, Nalini N, editors. Emerging Research in Computing, Information, Communication and Applications; New Delhi: Springer; 2015. pp. 551–567. [Google Scholar]
- 25.Wen, M., Rosé, C.P.: Identifying latent study habits by mining learner behavior patterns in massive open online courses. In: Proceedings of the 23rd ACM International Conference on Conference on Information and Knowledge Management, pp. 1983–1986. ACM (2014)
- 26.Brinton CG, Buccapatnam S, Chiang M, Poor HV. Mining MOOC clickstreams: video-watching behavior vs. in-video quiz performance. IEEE Trans. Sig. Process. 2016;64:3677–3692. doi: 10.1109/TSP.2016.2546228. [DOI] [Google Scholar]
- 27.Brinton, C.G., Chiang, M.: MOOC performance prediction via clickstream data and social learning networks. In: 2015 IEEE Conference on Computer Communications (INFOCOM), pp. 2299–2307 (2015). 10.1109/INFOCOM.2015.7218617
- 28.Sinha, T., Jermann, P., Li, N., Dillenbourg, P.: Your click decides your fate: inferring information processing and attrition behavior from MOOC video clickstream interactions. ArXiv preprint arXiv:1407.7131 (2014)
- 29.Whitehill, J., Mohan, K., Seaton, D., Rosen, Y., Tingley, D.: MOOC dropout prediction: how to measure accuracy? In: 2017 Proceedings of the Fourth ACM Conference on Learning @ Scale, pp. 161–164. Association for Computing Machinery, Cambridge (2017). 10.1145/3051457.3053974
- 30.Gardner, J., Yang, Y., Baker, R.S., Brooks, C.: Modeling and experimental design for MOOC dropout prediction: a replication perspective. In: International Educational Data Mining Society (2019)
- 31.Gardner, J., Brooks, C., Andres, J.M., Baker, R.: Replicating MOOC predictive models at scale. In: Proceedings of the Fifth Annual ACM Conference on Learning at Scale, pp. 1–10. Association for Computing Machinery, London (2018). 10.1145/3231644.3231656
- 32.Gardner, J., Brooks, C., Baker, R.: Evaluating the fairness of predictive student models through slicing analysis. In: Proceedings of the 9th International Conference on Learning Analytics & Knowledge, pp. 225–234. Association for Computing Machinery, Tempe (2019). 10.1145/3303772.3303791
- 33.Kim, J., Guo, P.J., Cai, C.J., Li, S.-W., Gajos, K.Z., Miller, R.C.: Data-driven interaction techniques for improving navigation of educational videos. In: Proceedings of the 27th Annual ACM Symposium on User Interface Software and Technology, pp. 563–572 (2014)
- 34.Mitrovic A, Gordon M, Piotrkowicz A, Dimitrova V. Investigating the effect of adding nudges to increase engagement in active video watching. In: Isotani S, Millán E, Ogan A, Hastings P, McLaren B, Luckin R, editors. Artificial Intelligence in Education; Cham: Springer; 2019. pp. 320–332. [Google Scholar]
- 35.Davis, D., Jivet, I., Kizilcec, R.F., Chen, G., Hauff, C., Houben, G.-J.: Follow the successful crowd: raising MOOC completion rates through social comparison at scale. In: Proceedings of the Seventh International Learning Analytics & Knowledge Conference, pp. 454–463. ACM (2017)
- 36.Davis D, Triglianos V, Hauff C, Houben G-J. SRLx: a personalized learner interface for MOOCs. In: Pammer-Schindler V, Pérez-Sanagustín M, Drachsler H, Elferink R, Scheffel M, editors. Lifelong Technology-Enhanced Learning; Cham: Springer; 2018. pp. 122–135. [Google Scholar]
- 37.Lallé, S., Conati, C.: A framework to counteract suboptimal user-behaviors in exploratory learning environments: an application to MOOCs. In: Proceedings of the 12th Workshop on Plan, Activity, and Intent Recognition, pp. 1–8. AAAI Press, Honolulu (2019)
- 38.Andres, J.M.L., Baker, R.S., Gašević, D., Siemens, G., Crossley, S.A., Joksimović, S.: Studying MOOC completion at scale using the MOOC replication framework. In: Proceedings of the 8th International Conference on Learning Analytics and Knowledge, pp. 71–78. ACM, Sydney (2018). 10.1145/3170358.3170369
- 39.Field A. Discovering Statistics Using IBM SPSS Statistics. London: Sage Publications Ltd.; 2012. [Google Scholar]
- 40.Rastrollo-Guerrero JL, Gómez-Pulido JA, Durán-Domínguez A. Analyzing and predicting students’ performance by means of machine learning: a review. Appl. Sci. 2020;10:1042. doi: 10.3390/app10031042. [DOI] [Google Scholar]
- 41.Kloft, M., Stiehler, F., Zheng, Z., Pinkwart, N.: Predicting MOOC dropout over weeks using machine learning methods. In: Proceedings of the EMNLP 2014 Workshop on Analysis of Large Scale Social Interaction in MOOCs, pp. 60–65 (2014)
- 42.Hong, B., Wei, Z., Yang, Y.: Discovering learning behavior patterns to predict dropout in MOOC. In: 2017 12th International Conference on Computer Science and Education (ICCSE), pp. 700–704 (2017). 10.1109/ICCSE.2017.8085583
- 43.Putnam, V., Conati, C.: Exploring the need for explainable artificial intelligence (XAI) in intelligent tutoring systems (ITS). In: IUI Workshops (2019)