Abstract
There are evidences that the region of hippocampus is affected in the early stage of Alzheimer’s disease (AD). Moreover, the hippocampal pyramidal neurons receive cholinergic input from the medial septum. Thus, this study, based on the results of electrophysiological experiments, first constructs a modified hippocampal CA1 pyramidal neuronal model by introducing two new currents of M-current and calcium ion-activated potassium ion current to depict the cholinergic input receiving from the medial septum, and then explores how acetylcholine deficiency and beta-amyloid accumulation under the pathological condition of AD influence the neuronal dynamics in terms of theta band power and spiking frequency using computational approach. By simulating acetylcholine potentiated M-current and calcium ion-activated potassium ion current, numerical results reveal that the relative theta band power increases significantly and the firing rate decreases obviously when acetylcholine is deficient. Similarly, by simulating beta-amyloid enhanced delay rectification potassium ion current, we also detect that the relative theta band power increases as well as the firing rate decreases remarkably as beta-amyloid is accumulated. In addition, the mechanism underlying these dynamical changes in theta rhythm and firing behavior is investigated by nonlinear behavioral analysis, which demonstrates that both deficiency in acetylcholine and accumulation in beta-amyloid can promote the emergence of stable equilibrium state in this modified hippocampal neuronal model. Note that acetylcholine deficiency together with beta-amyloid deposition plays key role in the pathogenesis of AD. We expect these findings could have important implications on better understanding pathogenesis and expounding potential biomarkers for AD.
Keywords: Alzheimer’s disease, Acetylcholine, Beta-amyloid, Theta band power, Spiking frequency, Bifurcation analysis
Introduction
Alzheimer’s disease (AD), inducing cognitive decline and memory disorder in aging populations, is manifested by irreversible degeneration of abstract thinking ability, memory ability and cognitive ability. Its pathogenesis has been always the focus of research in various fields, among which the beta-amyloid () lesion hypothesis and the cholinergic hypothesis are particularly notable. The beta-amyloid () lesion hypothesis supposes that there is excessive deposition of mainly in the cerebral cortex and hippocampus, which can result in a series of neurotoxicity and neuronal dysfunction (Hardy and Higgins 1992; Hardy and Selkoe 2002). In addition, much experimental results have demonstrated that may alter the electrophysiological activity of different ionic channels in pyramidal neurons. For example, the L-type channels are found to be activated by (Davidson et al. 1994; Webster et al. 2006), A-type fast-inactivating channels are suppressed by low concentration of , and the large-conductance calcium ion-activated potassium ion channels (BK) may be potentiated or blocked by (Furukawa et al. 1996; Qi and Qiao 2001). Pan has reported that injecting into the rat’s lateral ventricle in one shot has great effect on the delay rectification current (Pan 2004). In detail, the amplitude of under the condition is notably higher than that under the normal condition, which indicates that the delay rectification current is potentiated by .
Acetylcholine (Ach) as a neurotransmitter in the central cholinergic system plays a vital role in learning and memory (Drachman and Leavitt 1974). Ach is usually synthesized from choline and acetyl-coenzyme A catalyzed by choline acetyltransferase (ChAT). It’s stored in vesicles at nerve terminal and released into the synaptic cleft upon depolarization, then it diffuses across the cleft to activate muscarinic receptors or nicotine receptor. The action of Ach is rapidly terminated by hydrolysis by the enzyme acetylcholinesterase (AChE). Some previous scientific evidence has suggested acetylcholine deficiency for patients with AD. For example, Perry et al. (1978) have reported that activity of ChAT is evidently decreased in those cases with Alzheimer-type pathology. Moreover, the activity of ChAT is obviously correlated with plaque formation, and lower plaque counts induces a significant reduction of ChAT activity. Sims et al. (1980) have found that synthesis of Ach is considerably decreased in biopsy material from patients with AD. And there is a significant correlation between ChAT activity and their ability to synthesize acetylcholine. Nilsson et al. (1986) have reported that Ach release from AD/SDAT (senile dementia disorders of Alzheimer’s type) brain slices is markedly reduced compared to controls. Whitehouse et al. (1982) have found that the number of the cholinergic projection neurons in the nucleus basalis of Meynert is substantially decreased, which implies that one of the pathogenesis of Alzheimer’s disease is represented by the degeneration of the cholinergic connection from the nucleus of Meynert to the cortex and hippocampus. Gron et al. (2006) have shown that an increase of cholinergic neurotransmission in subjects with MCI specifically improves hippocampal function, indicating that cholinergic deficit is functionally relevant in subjects with MCI. Grothe et al. (2013) have reported that mild AD patients show a reduction of cholinergic basal forebrain volumes at baseline compared with healthy control subjects. And Cavedo et al. (2017) have revealed that atrophy of the basal forebrain system is reduced after 1 year of cholinesterase inhibitors treatment in the same study population. These evidences have formulated the cholinergic hypothesis of AD and developed the cholinesterase inhibitor therapy. Recently, Hampel et al. (2019) have reviewed the cholinergic hypothesis in AD, in which the role of the cholinergic system on AD pathogenesis has been reassessed in view of neuroimaging data charting the progression of neurodegeneration in the cholinergic system.
On the other hand, the direct effects of Ach on hippocampal pyramidal neurons are mediated by the blockade of two quite distinct currents of M-current and calcium ion-activated potassium ion current . In detail, Halliwell et al. have reported that the current is blocked by muscarinic receptor activation through the action of acetylcholine (Halliwell and Adams 1982). Benardo et al. have found that the current is also blocked by acetylcholine (Benardo and Prince 1982; Cole and Nicoll 1984). What’s more, Madison et al. have revealed that the two currents and are evidently reduced by carbachol (a cholinergic agonists), moreover, the higher the concentration of carbachol, the more the two currents and are blocked (Madison et al. 1987). Combined with the above scientific findings, it is reasonable to infer acetylcholine deficiency under pathological condition of AD would not block the two currents of and in hippocampal pyramidal neurons, instead, it may potentiate currents and . Besides, Shah et al. (2008) have pointed out that inhibiting M channel can cause depolarization and improve excitability of neuron by reducing the threshold level of action potential generated by the initial axon segment. By developing a new silico simulator, Greget et al. (2016) have reported that paraoxon (POX) can block AChE and then increase the concentration of Ach and induce hippocampal CA1 neuronal hyperexcitability. In addition, they have found that atropine, an antagonist of the muscarinic acetylcholine M1 receptor, can reduce neuron hyperexcitability induced by POX in silico, moreover, the higher the concentration of atropine, the lower the hyperexcitability of neurons.
Abnormalities in oscillations of local field potential (LFP) have been detected in brain with AD (Robbe and Buzsaki 2009). The abnormalities recorded by electroencephalogram (EEG) are very complex (Adeli et al. 2005; Ponomareva et al. 2008). For example, according to the analysis of relative power spectral density (PSD) estimated by autoregressive Burg method, Wang et al. and Liu et al. have found that the relative PSD of AD group is significantly increased in the theta frequency band while decreased in the alpha2 or alpha frequency band (Liu et al. 2016; Wang et al. 2015). Moreover, researchers have reported that the main characteristics of EEG in the early stage of AD are of an increase in theta band power and a decrease in alpha band power together with beta band power (Chiaramonti et al. 1997; Ihl et al. 1996; Nobukawa et al. 2019; Ponomareva et al. 2008). These abnormalities may be induced by the pathological alternations of some brain regions such as medial temporal lobe and cortex (Braak et al. 1998). The hippocampus, whose cognitive and memory functions are closely related to many neural diseases including AD (Basso et al. 2006), is mainly responsible for long-term memory storage, conversion and orientation functions. Adeli et al. (2005) and Li et al. (2010) have demonstrated that the hippocampus especially the hippocampal pyramidal neuron is heavily affected in the early stage of AD. Ashenafi et al. (2005) and Ramsden et al. (2001) have reported that AD can induce many changes in the electrophysiological features of hippocampal neurons including the potassium ion channel characteristics.
To better understand the pathogenesis of AD and explore the underlying dynamical mechanism of AD, much attention has been devoted to construct the hippocampal neuronal models (Donnelly 2013; Golomb et al. 2006; He et al. 2012; Menschik and Finkel 2000; Peng 2011, 2015; Peng et al. 2016; Zou et al. 2011, 2012). For example, according to the membrane ionic channel theory and the electrophysiological experimental data of pyramidal neuron, a nine-dimensional one-compartment hippocampal CA1 pyramidal neuronal model has been constructed by Golomb et al. (2006). He and Peng et al. have established four minimal models and a two-dimension reduced model by using the dimension reduction method (He et al. 2012; Peng 2015). Furthermore, based on the electrophysiological experimental data of rats under the pathological conditions of AD (Pan 2004), Peng et al. have developed a minimal hippocampal neuronal model and discussed the dynamical characteristics’ change in this hippocampal neuronal reduced model (Peng et al. 2016). By reconstructing a hippocampal CA3 pyramidal cell model, Menschik et al. have explored the influences of cellular-level cholinergic neuromodulation and discovered that Ach can result in a transition from bursting to regular spiking (Menschik and Finkel 2000). Zou et al. have established a hippocampo-septal computational model, in which they have found that -induced decrease in the ionic conductance of A-type current can make theta band power first increase and then decrease (Zou et al. 2011, 2012).
It should be emphasized that cholinergic action is of physiological significance in attention and memory (Hasselmo 2006; Sarter et al. 2005). Researchers have reported that neurons in the medial septum, an area in the basal forebrain, send cholinergic input to the hippocampus (Hara et al. 2017), especially the hippocampal pyramidal neurons (Lewis and Shute 1967; Lewis et al. 1967). The previous electrophysiological experimental results of reduced ChAT activity, reduced Ach synthesis and reduced Ach release have evidenced acetylcholine deficiency for patients with AD (Perry et al. 1978; Sims et al. 1980; Nilsson et al. 1986). Moreover, the medial septum and the hippocampus are associated with theta rhythm oscillation. However, in the literature majority of the hippocampal pyramidal neuronal models associated with AD have not adequately considered the cholinergic action. Motivated by these above findings, the main aim of this work is first to establish a modified hippocampal CA1 pyramidal neuronal computational model by introducing two new currents of M-current and calcium ion-activated potassium ion current to depict the cholinergic input receiving from the medial septum, and then explore how Ach deficiency together with accumulation influences the neuronal dynamics in terms of theta band power and firing rate.
The structure of this work is as follows: “A modified AD hippocampal CA1 pyramidal neuronal model” section introduces a computational model of the modified hippocampal pyramidal neuron associated with AD. In “Main results” section, the effects of Ach deficiency and accumulation on the dynamics of this modified model are discussed. Meanwhile, the dynamical mechanism underlying these influences is analyzed. A simple and clear conclusion about this work is given in “Conclusion” section.
A modified AD hippocampal CA1 pyramidal neuronal model
It is evidenced that neurons locating in the medial septum send cholinergic input to the hippocampus especially the hippocampal pyramidal neurons (Lewis and Shute 1967; Lewis et al. 1967). Moreover, the direct effects of Ach on hippocampal pyramidal neurons are mediated by the blockade of two quite distinct currents, i.e., calcium ion-activated potassium ion current and the M-current. Thus, based on the AD’s hippocampal neuronal model described by Peng et al. (2016), a modified hippocampal CA1 pyramidal neuronal model subjected to cholinergic action is constructed according to the Hodgkin–Huxley type formalism (Hajós et al. 2004), whose mathematical model is governed by the following differential equation:
| 1 |
where is the membrane capacitance, represents the membrane potential and is the stimulation current. This modified model incorporates six currents, i.e., the leakage current , the transient current , the delay rectification current , the M-current , the calcium ion-activated potassium ion current and A-type instantaneous current . Note that , first described in the sympathetic ganglion (Adams et al. 1982), is a voltage and muscarine sensitive current. , activated by entry during action potential discharges, is responsible for slowing action potential discharges. Compared with the original model described by Peng et al. (2016), and are newly introduced to depict the cholinergic input receiving from the medial septum in the hippocampal pyramidal neuron. Detailed definitions for all the other parameters can be found in the “Appendix”.
We point out that the modified model (1) is numerically solved in Matlab2016b using Euler method. To get the relative theta band power, the corresponding power spectra analysis is carried out by the following three steps. First, the fast components of LFP are obtained by band pass filtering (1–40 Hz) using a Butterworth filter of order 6, in which the sampling rate is set as 250 Hz. Second, the power spectral density of the filtered membrane potential is computed by using a Welch periodogram with a Hamming window. Last, the relative theta band power is computed by averaging the relative power density within theta band, which is calculated by dividing the absolute power at each frequency by the mean of the total power spectra (Sen-Bhattacharya et al. 2014).
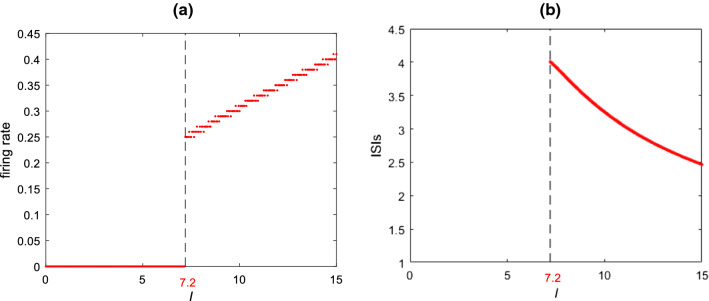
To reveal how the stimulation current influences the spiking behavior of this modified hippocampal pyramidal neuron, the firing rate as well as the bifurcation graph of interspike intervals (ISIs) is shown in Fig. 1. It can be clearly seen that the ISIs and the firing rate change obviously with the stimulation current . Moreover, this result indicates that the modified hippocampal pyramidal neuron begins to discharge when is increased to about , after which the firing rate increases and the ISIs decreases steadily. In the following, the stimulation current is set as to ensure that this modified hippocampal neuron can fire (Table 1).
Fig. 1.
Dependence of the firing rate of the modified hippocampal pyramidal neuron (a) and the interspike intervals (ISIs) (b) on the stimulation current when , and . It can be seen that the neuron begins to fire when is increased to about , after which the firing rate increases and the ISIs decreases steadily
Table 1.
Definition and parameters’ value for different channels
| Channel | Definition | Parameter |
|---|---|---|
| , , , , , | ||
Main results
In this section, taking (the ionic conductance of M-current ), (the ionic conductance of calcium ion-activated potassium ion current ) and (the ionic conductance of the delay rectification current ) as control parameters, the neuronal dynamical changes induced by Ach deficiency and accumulation are first investigated by the theta band power and the firing rate in this modified hippocampal neuronal model (1). Then the dynamical mechanism underlying such changes is further explored by nonlinear behavioral analysis.
Acetylcholine deficiency induced change of neuronal dynamics
As stated in the Introduction, some previous experimental results of reduced ChAT activity, reduced Ach synthesis and reduced Ach release have suggested acetylcholine deficiency for patients with AD. The influence of Ach on pyramidal neurons is mediated by the obstruction of M-current and calcium ion-activated potassium ion current . Thus, it is reasonable to infer acetylcholine deficiency under pathological condition of AD would potentiate currents and rather than block the two currents of and in hippocampal pyramidal neurons. In the following, we simulate the effect of acetylcholine deficiency on the relative theta band power in this modified hippocampal CA1 pyramidal computational model by enhancing currents and , i.e., how the increased ionic conductance of current and increased ionic conductance of current influence the theta rhythm of EEG.
Case 1: Taking the ionic conductance as control parameter
Firstly, the modified hippocampal pyramidal neuronal model (1) is simulated by taking the ionic conductance of as control parameter. Its relative theta band power is illustrated in Fig. 2 when the ionic conductance and are set to be and , respectively. From this figure, it can be clearly seen that upon potentiating M-current , the relative theta band power increases significantly until it gets a maximum when is about , after that it stabilizes at this maximum as is further increased. This interesting result indicates that Ach deficiency, a biomarker for AD, can induce an increase in the relative theta band power, which is consistent with the result detected by Chiaramonti et al. that an increase in theta band power of EEG appears in the early stage of AD (Chiaramonti et al. 1997; Ihl et al. 1996; Nobukawa et al. 2019; Ponomareva et al. 2008).
Fig. 2.
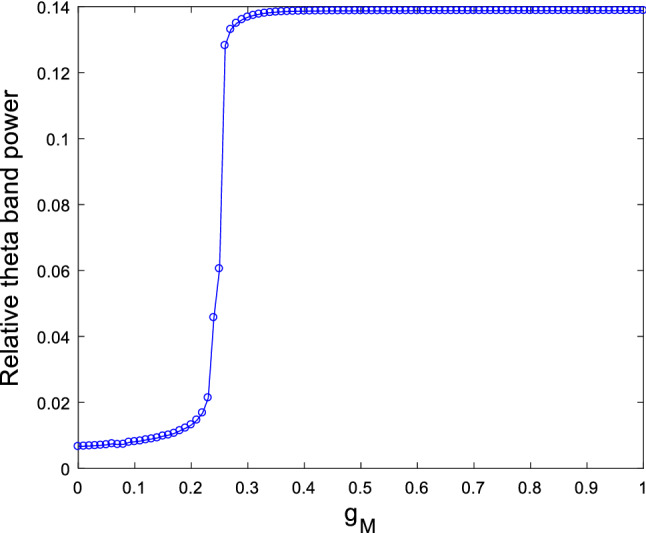
Dependence of the relative theta band power on the ionic conductance when and . It can be seen an obvious increase in relative theta band power upon increasing ionic conductance
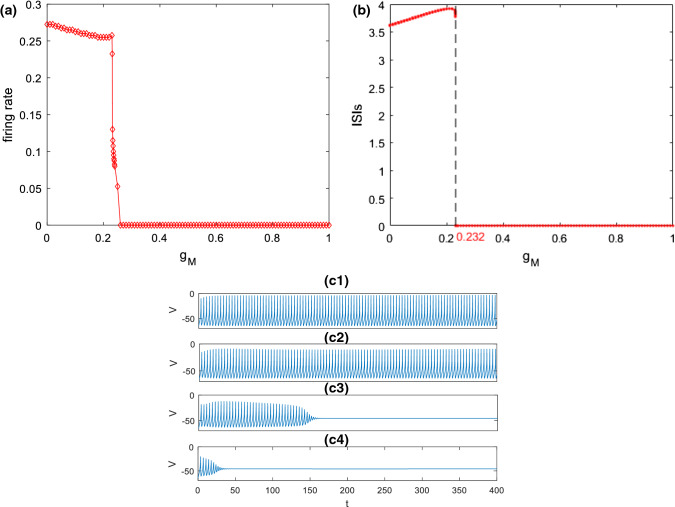
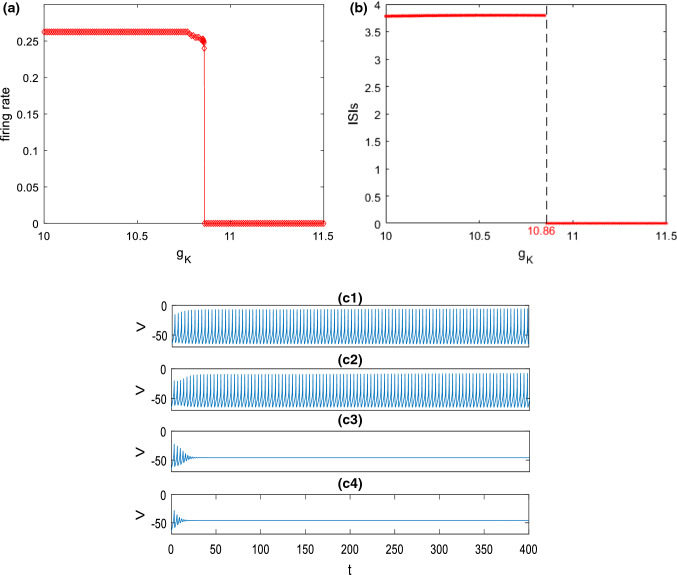
Secondly, how M-current influences the excitability of this pyramidal neuron is explored. Figure 3a, b depict the variation of firing rate and the corresponding ISIs with the ionic conductance of , respectively. The simulation result demonstrates a slight decrease of firing rate (please see Fig. 3a) together with a slight increase of ISIs (please see Fig. 3b) as is initially increased, then they abruptly decrease and reach zero when exceeds a critical value (). These phenomena are further illustrated by some time series in Fig. 3c. From the top to the bottom in Fig. 3c, the ionic conductance is successively chosen as , , and . In the cases of and , the pyramidal neuron can fire and the firing rate slightly decreases as is increased (please see Fig. 3c1, c2). With the further increase of , the pyramidal neuron first discharges and then returns to its resting state (please see Fig. 3c3, c4). These are consistent with the results displayed in Fig. 3a, b. The above phenomena indicate that excitability of this pyramidal neuron is suppressed by enhancement of M-current . In other words, inhibiting can enhance the excitability of this pyramidal neuron, which accords with the finding reported by Shah et al. (2008) that inhibiting M channel can lead to depolarization and improve excitability of neuron by reducing the threshold level of action potential.
Fig. 3.
Dependence of firing rate (a) and the corresponding ISIs (b) on the ionic conductance when and . c Some typical time series of this pyramidal neuron model for different : c1, c2, c3, c4. It can be seen that upon increasing the firing rate of this pyramidal neuron decreases, and the corresponding ISIs first increase and then decreases
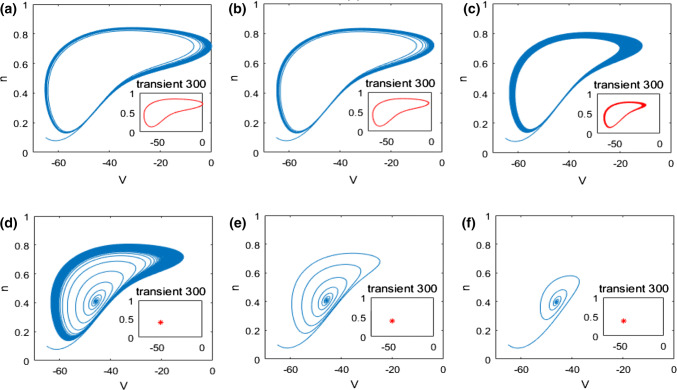
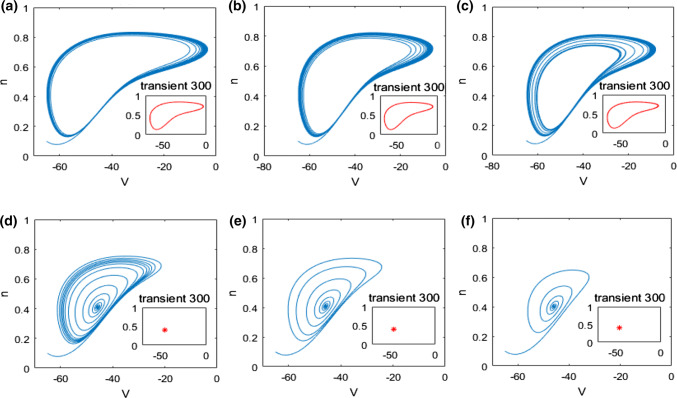
In what follows, the mechanism underlying the above neuronal dynamical changes in theta rhythm and firing behavior is investigated by nonlinear behavioral analysis. The dynamical analysis of bifurcation in the pyramidal neuronal model (1) is firstly carried out. The evolution of the extrema of membrane potential during the increase of the ionic conductance is described in Fig. 4. From this bifurcation diagram, one can observe that upon increasing , the maximum of membrane potential gradually decreases and the minimum one slowly increases, i.e., the membrane potential oscillates between its maximum and minimum. Interestingly, the maximum and minimum of membrane potential suddenly coincide when reaches a critical value (), after which this neuron doesn’t oscillate anymore but stabilizes at a certain constant with the further increase of . This result indicates that the ionic conductance affects the dynamics of this modified pyramidal neuron greatly, especially its firing pattern is changed significantly when is near the critical value (). This phenomenon is further vividly checked by some typical phase orbits in V–n phase plane in Fig. 5. From panel (a) to panel (f), the ionic conductance is , , , , and successively, and the subplot represents the stable phase orbit after discarding transient state. Figure 5a–c demonstrate limit cycle attractor which corresponds to the modified pyramidal neuron’s firing state when the ionic conductance is less than the critical value (). In addition, Fig. 5d–f illustrate equilibrium point which manifests that the pattern of this modified pyramidal neuron is in the resting state once is beyond the critical value (). Through further analysis of eigenvalue’s characteristic, we can obtain that the modified hippocampal pyramidal neuronal model undergoes a Hopf bifurcation as the ionic conductance is increased. Combined with the nonlinear dynamical analysis of Figs. 4 and 5, one can infer that the increase in (i.e., the enhanced M-current originating from deficiency in acetylcholine) can promote the emergence of stable equilibrium state in this modified hippocampal neuronal model, which could inhibit the excitability of neuron and cause an increase in the relative power of theta band.
Fig. 4.
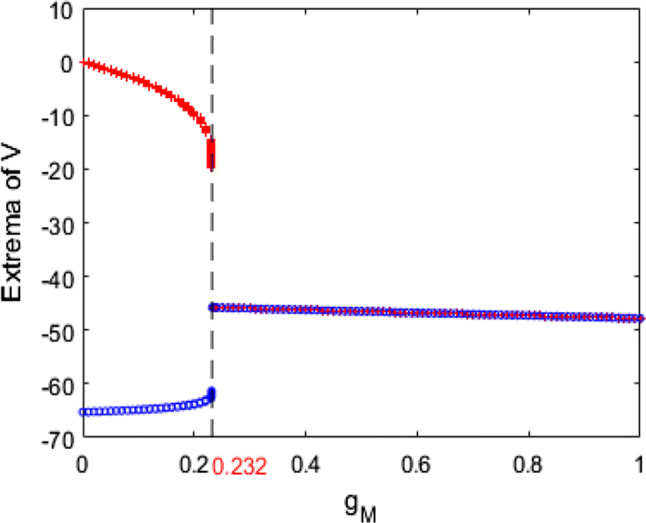
The evolution of the extrema of membrane potential during the increase of the ionic conductance when and . The pattern of this pyramidal neuron varies from the firing state to the resting state with the increase of
Fig. 5.
Some typical phase orbits in V–n phase plane for different : a, b, c, d, e, f. Note that the subplot representing the stable phase orbit after discarding transient state. The state of this pyramidal neuron varies from the limit cycle to the equilibrium point with the increase of
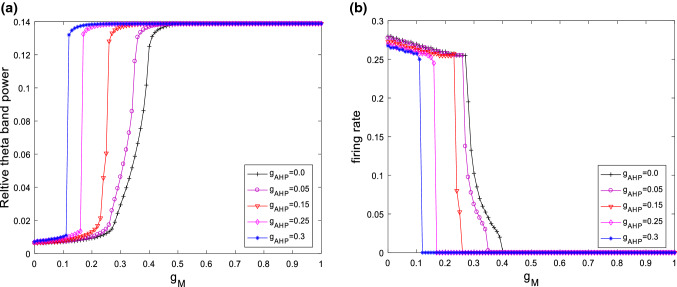
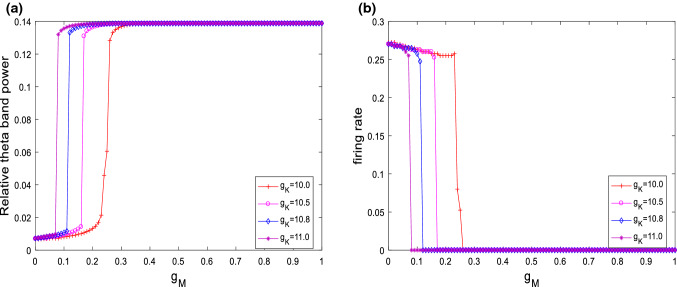
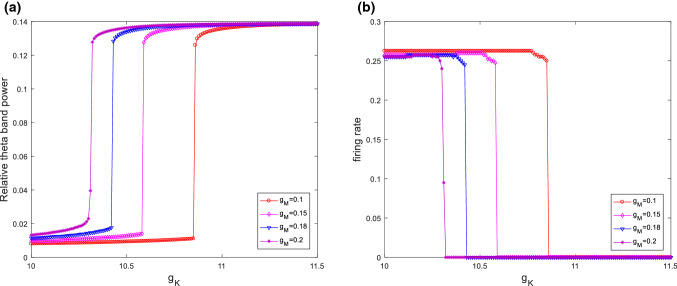
The above simulation is for the case of fixed ionic conductance and . Further simulations of the neuronal dynamical changes will be investigated when the main parameters of and are varied. Figure 6 depicts the variation of relative theta band power (please see Fig. 6a) and firing rate (please see Fig. 6b) with the ionic conductance for different . It can be clearly seen that for different , the relative theta band power always first increases and then approaches its maximum at a critical value as is increased. On the same time, the firing rate of neuron first slightly decreases and then abruptly decreases to zero. In addition, the critical point moves to the left as increases, i.e., the larger , the smaller of critical value of . These results reveal that the increased relative theta band power and the inhibited excitability of neuron by increasing are robust to the ionic conductance . On the other hand, the dependences of relative theta band power (please see Fig. 7a) and firing rate (please see Fig. 7b) on are shown in Fig. 7 for various , i.e., , , and . Similar with the case of , the relative theta band power always first increases and then approaches its maximum at a critical value as is increased. The firing rate of neuron first slightly decreases and then abruptly decreases to zero. On the same time, the critical point of this modified model shifts from the right to the left upon increasing . That is to say, the distinguishing features that the increase in the relative theta band power and the suppression in the excitability of neuron are independence of the ionic conductance .
Fig. 6.
Dependence of relative theta band power (a) and firing rate (b) on the ionic conductance for different when . It is seen that for different the relative theta band power always first increases and then approaches its maximum at a critical value as is increased. On the same time, the firing rate first slightly decreases and then abruptly decreases to zero
Fig. 7.
Dependence of relative theta band power (a) and firing rate (b) on the ionic conductance for different when . Similar with the case of , these curves’ characteristics also appear no matter how varies. The relative theta band power always first increases and then approaches its maximum at a critical value as is increased. The firing rate of neuron first slightly decreases and then abruptly decreases to zero
Case 2: Taking the ionic conductance as control parameter
The results of Case 1 suggest that enhancing M-current by deficiency in Ach can increase the relative theta band power and suppress the excitability of this pyramidal neuron. One may wonder whether these neuronal dynamical changes still appear when enhancing calcium ion-activated potassium ion current by deficiency in Ach. With loss of generality, we set the ionic conductance of and as and respectively, and take the ionic conductance of the current as control variable. The simulation result of the dependence of relative theta band power on the ionic conductance of is illustrated in Fig. 8. It is shown that the relative theta band power remarkably increases when is potentiated until it reaches a maximum as is near . Afterwards, the relative theta band power stabilizes at this maximum upon further increasing . The above result reveals that deficiency in Ach can cause an increase in the relative theta band power, which coincides with the result of EEG recorded by Chiaramonti et al. that an increase in theta band power of EEG appears in the early stage of AD (Chiaramonti et al. 1997; Ihl et al. 1996; Nobukawa et al. 2019; Ponomareva et al. 2008).
Fig. 8.
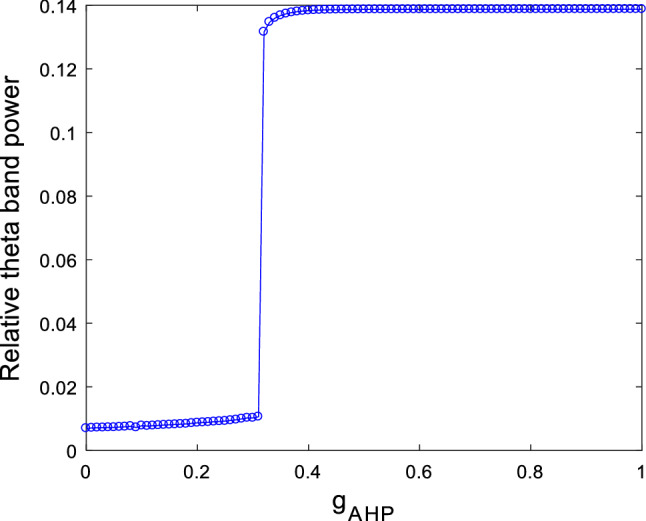
Dependence of relative theta band power on the ionic conductance when and . It can be seen an evident increase in relative theta band power upon increasing ionic conductance
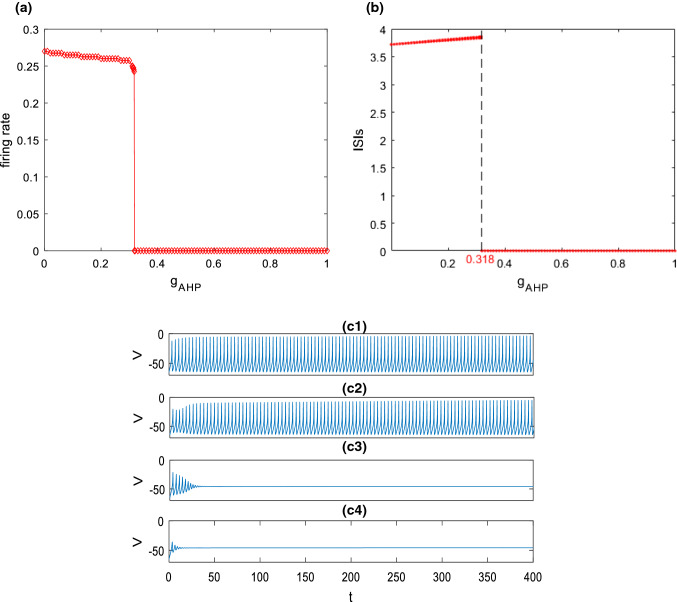
In addition, the impact of calcium ion-activated potassium ion current on the excitability of this pyramidal neuron is investigated. The dependences of firing rate and corresponding ISIs on the ionic conductance are presented in Fig. 9a, b. It is clearly seen that upon increasing , the firing rate first slowly decreases as well as ISIs first slightly increases, and then they suddenly decrease and approach zero when is increased to a critical value (). Figure 9c1–c4 exhibit the membrane potential of the pyramidal neuron when the ionic conductance is , , and , respectively. From these figures, one can observe that the pyramidal neuron can discharge and the firing rate gradually decreases as is increased (please see Fig. 9c1, c2). With the further increase of , the pyramidal neuron first discharges and then returns to its resting state (please see Fig. 9c3, c4). The results of Fig. 9 demonstrate that the excitability of this hippocampal pyramidal neuron is inhibited by enhancing calcium ion-activated potassium ion current , namely, inhibiting can improve the excitability of the present neuron.
Fig. 9.
Dependence of firing rate (a) and corresponding ISIs (b) on the ionic conductance when and . c Some typical membrane potential of this neuron model for different : c1, c2, c3, c4. It can be seen that with the increase of , the firing rate of the present neuron decreases and the corresponding ISIs first increase and then decreases
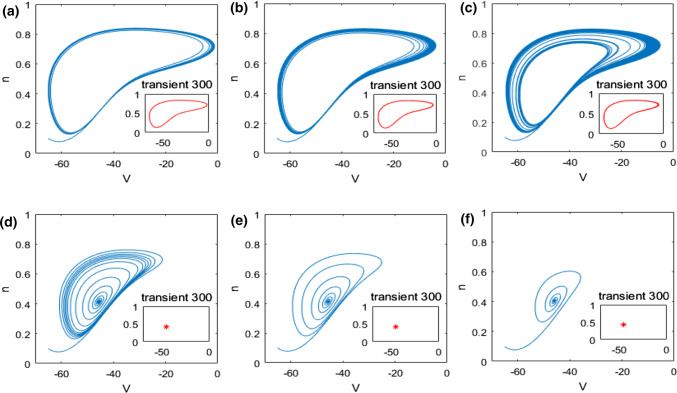
In what follows, we explore the mechanism underlying the above neuronal dynamical changes in theta band power and firing rate by nonlinear behavioral analysis. According to the dynamical analysis of bifurcation in the modified model (1), the variation of extrema of membrane potential with the ionic conductance is illustrated in Fig. 10. Obviously, upon increasing from zero gradually, the maximum of membrane potential slightly decreases, while the minimum one slightly increases, i.e., the membrane potential oscillates between maximum and minimum of membrane potential. Interestingly, as is further increased to about , the maximum and minimum of membrane potential are abruptly equal, after that this pyramidal neuron doesn’t oscillate anymore but stabilizes at a certain constant with the further increase of . The interesting result shows that the dynamics of this neuron are significantly affected by the change of , particularly its theta band power and firing rate are remarkably changed as is increased to the critical value (). This phenomenon is further explained in detail by some typical phase orbits in V–n phase plane in Fig. 11 for different ionic conductance such as , , , , and . For each , the stable phase orbit after removing transient state is also displayed in the subplot. Figure 11a–c indicate that for some values of that are less than the critical value (), the stable phase orbit of the model (1) is a limit cycle attractor, i.e., this pyramidal neuron is in the firing state. Additionally, Fig. 11d–f suggest that for some values of that exceed the critical value (), the stable phase orbit of the model (1) is an equilibrium point, i.e., this pyramidal neuron is in the resting state. Combined with the results obtained in Figs. 10 and 11, one can detect that upon increasing , the modified neuronal model (1) undergoes the Hopf bifurcation near . Hence, increasing can promote the emergence of stable equilibrium state of this modified neuronal model, which can suppress the excitability of neuron and lead to an increase in the relative power of theta band.
Fig. 10.
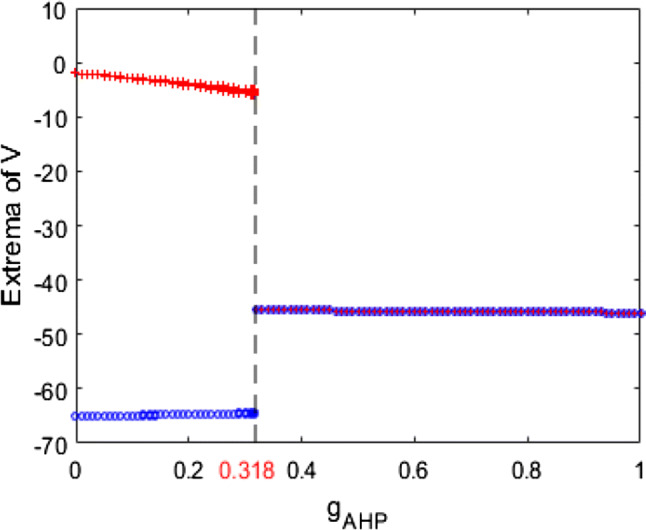
The variation of extrema of membrane potential with the ionic conductance when and . The pattern of this pyramidal neuron changes from the firing state to the resting state with the increase of
Fig. 11.
Some typical phase orbits in V–n phase plane for different : a, b, c, d, e, f. Note that the subplot representing the stable phase orbit after discarding transient state. The state of this pyramidal neuron changes from the limit cycle to the equilibrium point with the increase of
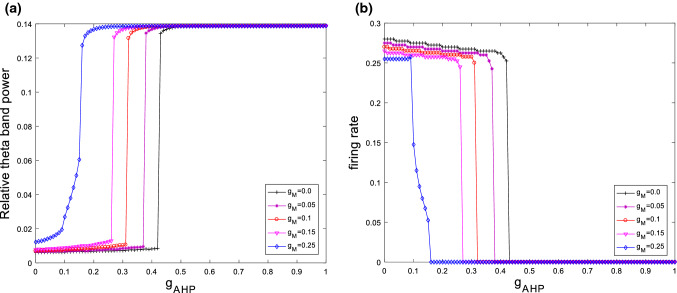
The above results are obtained when the parameters and are fixed at and . Furthermore, Fig. 12 illustrates the evolution of relative theta band power (please see Fig. 12a) and firing rate (please see Fig. 12b) during the increase of the ionic conductance for different . From these figures, one can see that when takes different values, the relative theta band power always first increases and then approaches its maximum at a critical value as is increased, moreover, the firing rate first slightly decreases and then abruptly decreases to zero. Hence, the increased relative theta band power and the suppressed excitability induced by increasing have certain robustness to . Meanwhile, this modified model’s critical point moves to the left upon increasing , namely, the larger , the smaller of the critical value of . In addition, the variation of relative theta band power (please see Fig. 13a) and firing rate (please see Fig. 13b) with for various are also simulated in Fig. 13. Similar with the case of , the characteristic features of the relative theta band power and the firing rate also occurs no matter how changes. Thus, one can conclude that the phenomena of an increase in the relative theta band power and the suppression in the firing rate of neuron are robust to the parameter .
Fig. 12.
The evolution of relative theta band power (a) and firing rate (b) during the increase of the ionic conductance for different when . It can be seen that for different the relative theta band power always first increases and then approaches its maximum at a critical value as is increased. Moreover, the firing rate first slightly decreases and then abruptly decreases to zero
Fig. 13.
The variation of relative theta band power (a) and firing rate (b) with for various when . One can observe that for different the relative theta band power always first increases and then approaches its maximum at a critical value as is increased. Moreover, the firing rate first slightly decreases and then abruptly decreases to zero
Beta-amyloid accumulation induced change of neuronal dynamics
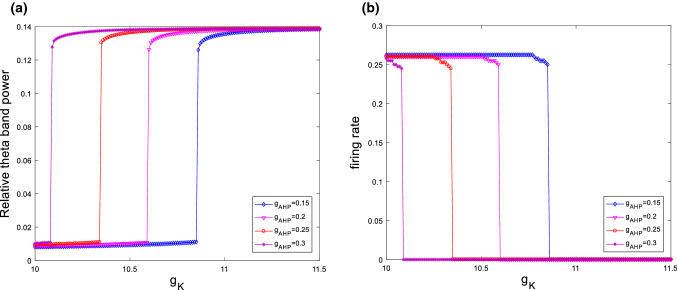
As stated in the Introduction, the experimental result of Pan has reported that injecting into the rat’s lateral ventricle in one shot can increase the amplitude of delay rectification current . When the hippocampal pyramidal neuron is depolarized to , the amplitude of will increase , which indicates that the delay rectification current is notably potentiated by accumulation of (Pan 2004). Thus, in the following we mimic the pathological state of deposition in AD patients by enhancing current , and explore how the increased ionic conductance of current influences the theta rhythm of EEG. For this purpose, setting the ionic conductance and , the modified hippocampal pyramidal neuronal model (1) is simulated by taking the ionic conductance of the delay rectification current as control parameter. Its relative theta band power is depicted in Fig. 14, where one can see that the relative theta band power increases rapidly as is increased, and it approaches the maximum when exceeds a critical value (). The above result suggests that accumulation in , a biomarker for AD, can lead to an increase in the relative theta band power, which is consistent with the result reported by Chiaramonti et al. that an increase in theta band power of EEG appears in the early stage of AD (Chiaramonti et al. 1997; Ihl et al. 1996; Nobukawa et al. 2019; Ponomareva et al. 2008).
Fig. 14.
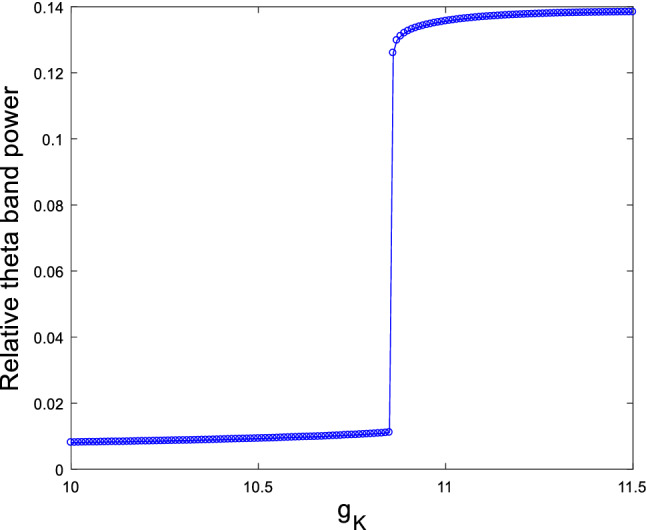
Dependence of relative power of theta band on the ionic conductance when and . It can be seen an obvious increase in the relative theta band power upon increasing ionic conductance
In the other hand, the influence of the delay rectification current on the excitability of this modified neuron is discussed detailedly. Figure 15 illustrates the dependence of firing rate (please see Fig. 15a) and the corresponding ISIs (please see Fig. 15b) on the control parameter . From these figures, one can observe that along with the increase in , the firing rate of neuron slightly decreases together with ISIs slightly increases, and then they abruptly decrease to zero as is increased to a critical value (). Some typical membrane potential diagrams are depicted in Fig. 15c when is , , and . It is shown that small ionic conductance can excite neuron to spike continuously (please see Fig. 15c1, c2). As increases, the pyramidal neuron becomes resting state (please see Fig. 15c3, c4) The above results imply that the excitability of the present neuron is inhibited by accumulation in enhanced delay rectification current .
Fig. 15.
Dependence of firing rate (a) and the corresponding ISIs (b) on the ionic conductance when and . c Some typical membrane potential of this neuron model for different : c1, c2, c3, c4. It can be seen that with the increase of , the firing rate of this pyramidal neuron decreases and the corresponding ISIs first increase and then decreases
In what follows, we explore the mechanism underlying the above neuronal dynamical changes in theta band power and firing rate using nonlinear behavioral analysis. The dependence of the extrema of membrane potential on the ionic conductance is presented in Fig. 16. It is clearly seen that the maximum of membrane potential slowly decreases and the minimum one gradually increases when is increased, i.e., the pyramidal neuron is in the firing state. Particular interesting, the maximum and minimum of membrane potential are equal when is increased to a critical value (), and then the membrane potential becomes stable with the further increase of , i.e., the pyramidal neuron is in the resting state. The above result reveals that the dynamics of the model (1) are changed by accumulation enhanced ionic conductance , i.e., the relative theta band power and firing rate are changed evidently when is about a critical value (). Furthermore, we analyze the above phenomenon using some typical phase orbits in V–n phase plane in Fig. 17 when , , , , and . And for each , the stable phase orbit after discarding transient state is illustrated in the subplot. Obviously, Fig. 17a–c show that the present modified model’s stable phase orbit is limit cycle attractor when is less than the critical value (). What’s more, Fig. 17d–f suggest that the stable phase orbit of the modified model (1) is equilibrium point when exceeds the critical value (). From the results of Figs. 16 and 17, one can conclude that the pyramidal neuronal model (1) undergoes the Hopf bifurcation when is increased. Therefore, increasing the ionic conductance of the delay rectification by accumulation can promote the emergence of stable equilibrium state, which can increase the relative power of theta band and suppress the excitability of neuron.
Fig. 16.
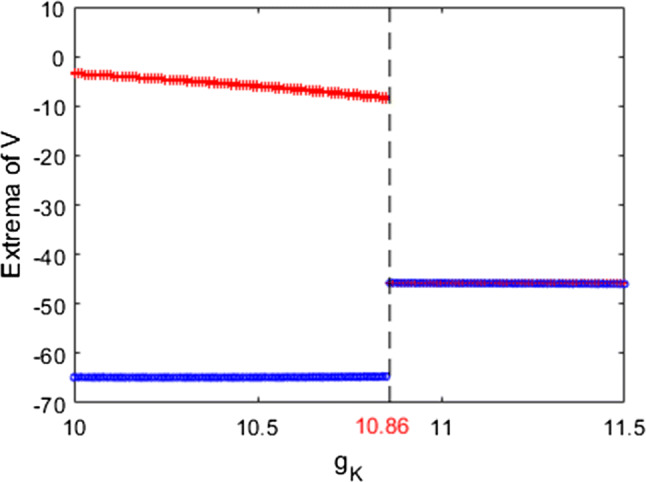
The variation of extrema of membrane potential with the ionic conductance when and . The pattern of this pyramidal neuron changes from the firing state to the resting state with the increase of
Fig. 17.
Some typical phase orbits in V–n phase plane for different . a, b, c, d, e, f. Note that the subplot representing the stable phase orbit after discarding transient state. The state of this pyramidal neuron varies from the limit cycle to the equilibrium point with the increase of
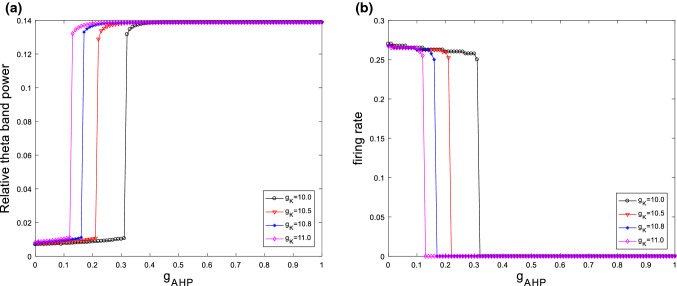
In the above simulations, the ionic conductance and are fixed at and , respectively. In what follows, the effects of on relative theta band power (please see Fig. 18a) and firing rate of neuron (please see Fig. 18b) are investigated for various in Fig. 18. From these figures, it is clearly seen that for each , the phenomena of the increased relative theta band power and the decreased firing rate can still appear. These results imply that the impacts of on the relative theta band power and the excitability of neuron are robust to the change of . What’s more, the larger the parameter , the more left the critical point of . On the other hand, the variation of relative theta band power (please see Fig. 19a) and firing rate (please see Fig. 19b) with the ionic conductance are shown in Fig. 19 for various . It can be seen that the trend of these curves is very similar when the parameter is varied, i.e., the relative theta band power always first increases and then approaches its maximum at a critical value as is increased, on the same time, the firing rate of neuron first slightly decreases and then abruptly decreases to zero. Therefore, the increased relative theta band power and the decreased firing rate caused by enhancing are robust with respect to the parameter . And for different , the critical point is different from the case of . Moreover, the larger the parameter , the smaller the critical point of .
Fig. 18.
Dependence of relative theta band power (a) and firing rate (b) on the ionic conductance for different when . It is seen that for different the relative theta band power always first increases and then approaches its maximum at a critical value as is increased. On the same time, the firing rate first slightly decreases and then abruptly decreases to zero
Fig. 19.
The variation of relative theta band power (a) and firing rate (b) with the ionic conductance for various when . It can be seen that no matter how varies, the relative theta band power always first increases and then approaches its maximum at a critical value as is increased. Meanwhile, the firing rate of neuron first slightly decreases and then abruptly decreases to zero
Conclusion
It is noteworthy that deficiency in Ach and accumulation in are significant biomarkers for AD, however, how the two biomarkers affect the neuronal dynamics still remains confused. Thus, this study takes the cholinergic action into account the original hippocampal neuronal model, and establishes a modified hippocampal CA1 pyramidal neuronal model by introducing two new currents of M-current and calcium ion-activated potassium ion current to depict the cholinergic input receiving from the medial septum. Then how Ach deficiency and accumulation influence the neuronal dynamics in this modified model is evaluated by theta band power and firing frequency. Through increasing the ionic conductance of three relevant currents, i.e., Ach deficiency potentiated current and current , and accumulation enhanced delay rectification current , we find that whether the enhanced currents and or the promoted current can induce an increase in relative theta band power and a decrease in firing rate of neuron. These neuronal dynamics changes accord with the electrophysiological experimental results reported by Chiaramonti et al. (Chiaramonti et al. 1997; Ihl et al. 1996; Nobukawa et al. 2019; Ponomareva et al. 2008), which indicates that the present computational model-based study can well simulate the abnormal EEG characteristic for AD patients. Furthermore, the dynamical mechanism underlying these changes is analyzed from the point of nonlinear behavioral analysis. The result implies that deficiency in Ach and accumulation in can promote the emergence of stable equilibrium state in this modified hippocampal neuronal model, which may lead to an increase in relative power of theta band and a decrease in firing rate. We expect these findings could have potential implications on understanding the effects of acetylcholine and beta-amyloid on AD’s pathogenesis and diagnosing Alzheimer’s disease.
Acknowledgements
This work is partially supported by the National Natural Science Foundation of China (Grant Nos. 11972217, 11572180), the Fundamental Funds Research for the Central Universities (Grant Nos. GK201901008, GK201701001).
Appendix
The present modified hippocampal pyramidal neuronal mathematical model is described by the following differential equation:
| 2 |
where is the membrane capacitance, is the membrane potential, is the leakage current, is the transient current, is the delay rectification current, is the A-type instantaneous current, is the muscarine-sensitive current, is the calcium ion-activated potassium ion current and is the stimulation current.
All of the above ionic currents are modelled by the Hodgkin–Huxley type, thus the gating variable satisfies the following first-order kinetics ( can be , , , and ):
| 3 |
The model (2) has eight variables, which are the membrane potential variable , transient current inactivation variable , delayed rectified current activation variable , A-type instantaneous current inactivation variable , muscarine-sensitive current activated variable , high-threshold current-activated variable , calcium ion-activated potassium ion current-activated variable and intramembrane calcium ion concentration variable . The activation gate variables and are replaced by activation curves and , respectively. , and stand for activation curves of activation gate variables , and , respectively. , and stand for inactivation curves of inactivation gate variables , and , respectively. For numerical simulation the parameters are selected as follows: , , , , , , , , ; , . Without loss of generality, in the modified model (2) the state variable , , , , , , and are initially set as , , , , , , , .
Footnotes
Publisher's Note
Springer Nature remains neutral with regard to jurisdictional claims in published maps and institutional affiliations.
References
- Adams PR, Brown DA, Constanti A. Pharmacological inhibition of the M-current. J Physiol. 1982;332:223–262. doi: 10.1113/jphysiol.1982.sp014411. [DOI] [PMC free article] [PubMed] [Google Scholar]
- Adeli H, Ghosh-Dastidar S, Dadmehr N. Alzheimer’s disease and models of computation: imaging, classification and neural models. J Alzheimer’s Dis. 2005;7:187–199. doi: 10.3233/jad-2005-7301. [DOI] [PubMed] [Google Scholar]
- Ashenafi S, Fuente A, Criado JM, Riolobos AS, Heredia M, Yajeya J. β-Amyloid peptide 25–35 depresses excitatory synaptic transmission in the rat basolateral amygdala “in vitro”. Neurobiol Aging. 2005;26:419–428. doi: 10.1016/j.neurobiolaging.2004.05.008. [DOI] [PubMed] [Google Scholar]
- Basso M, Yang J, Warren L, MacAvoy MG, Varma P, Bronen RA, van Dyck CH. Volumetry of amygdala and hippocampus and memory performance in Alzheimer’s disease. Psychiatry Res. 2006;146:251–261. doi: 10.1016/j.pscychresns.2006.01.007. [DOI] [PubMed] [Google Scholar]
- Benardo LS, Prince DA. Ionic mechanisms of cholinergic excitation in mammalian hippocampal pyramidal cells. Brain Res. 1982;249:333–344. doi: 10.1016/0006-8993(82)90067-1. [DOI] [PubMed] [Google Scholar]
- Braak H, Braak E, Bohl J, Bratzke H. Evolution of Alzheimer’s disease related cortical lesions. J Neural Transm Suppl. 1998;54:97–106. doi: 10.1007/978-3-7091-7508-8_9. [DOI] [PubMed] [Google Scholar]
- Cavedo E, Grothe MJ, Colliot O, Lista S, Chupin M, Dormont D, Houot M, Lehericy S, Teipel S, Dubois B, Hampel H. Reduced basal forebrain atrophy progression in a randomized Donepezil trail in prodromal Alzheimer’s disease. Sci Rep. 2017;7:11706. doi: 10.1038/s41598-017-09780-3. [DOI] [PMC free article] [PubMed] [Google Scholar]
- Chiaramonti R, Muscas GC, Paganini M, Muller TJ, Fallgatter AJ, Versari A, Strik WK. Correlations of topographical EEG features with clinical severity in mild and moderate dementia of Alzheimer type. Neuropsychobiology. 1997;36:153–158. doi: 10.1159/000119375. [DOI] [PubMed] [Google Scholar]
- Cole AE, Nicoll RA. Characterization of a slow cholinergic post-synaptic potential recorded in vitro from rat hippocampal pyramidal cells. J Physiol. 1984;352:173–188. doi: 10.1113/jphysiol.1984.sp015285. [DOI] [PMC free article] [PubMed] [Google Scholar]
- Davidson RM, Shajenko L, Donta TS. Amyloid beta-peptide potentiates a nimodipine-sensitive L-type barium conductance in N1E−115 neuroblastoma cells. Brain Res. 1994;643:324–327. doi: 10.1016/0006-8993(94)90041-8. [DOI] [PubMed] [Google Scholar]
- Donnelly DF. Voltage-gated Na+ channels in chemoreceptor afferent neurons-potential roles and changes with development. Respir Physiol Neurobiol. 2013;185:67–74. doi: 10.1016/j.resp.2012.08.009. [DOI] [PMC free article] [PubMed] [Google Scholar]
- Drachman DA, Leavitt J. Human memory and the cholinergic system. Arch Neurol. 1974;30:113–121. doi: 10.1001/archneur.1974.00490320001001. [DOI] [PubMed] [Google Scholar]
- Furukawa K, Barger SW, Blalock EM, Mattsor MP. Activation of K+ channels a suppression of neuronal activity by secreted by beta amyloid-precursor protein. Nature. 1996;379:74–78. doi: 10.1038/379074a0. [DOI] [PubMed] [Google Scholar]
- Golomb D, Yue C, Yaari Y. Contribution of persistent Na+ current and M-type K+ current to somatic bursting in CA1 pyramidal cells combined experimental and modeling study. J Neurophysiol. 2006;96:1912–1926. doi: 10.1152/jn.00205.2006. [DOI] [PubMed] [Google Scholar]
- Greget R, Dadak S, Barbier L, Lauga F, Linossier-Pierre S, Pernot F, Legendre A, Ambert N, Bouteiller JM, Dorandeu F, Bischoff S, Baudry M, Fagni L, Moussaoui S. Modeling and simulation of organophosphate-induced neurotoxicity: prediction and validation by experimental studies. Neurotoxicology. 2016;54:140–152. doi: 10.1016/j.neuro.2016.04.013. [DOI] [PubMed] [Google Scholar]
- Gron G, Brandenburg I, Wunderlich AP, Riepe MW. Inhibition of hippocampal function in mild cognitive impairment: targeting the cholinergic hypothesis. Neurobiol Aging. 2006;27(1):78–87. doi: 10.1016/j.neurobiolaging.2004.12.005. [DOI] [PubMed] [Google Scholar]
- Grothe M, Heinsen H, Teipel S. Longitudinal measures of cholinergic forebrain atrophy in the transition from healthy aging to Alzheimer’s disease. Neurobiol Aging. 2013;34:1210–1220. doi: 10.1016/j.neurobiolaging.2012.10.018. [DOI] [PMC free article] [PubMed] [Google Scholar]
- Hajós M, Hoffmann WE, Orbán G, Kiss T, Érdi P. Modulation of septo-hippocampal theta activity by GABAA receptors: an experimental and computational approach. Neuroscience. 2004;126:599–610. doi: 10.1016/j.neuroscience.2004.03.043. [DOI] [PubMed] [Google Scholar]
- Halliwell JV, Adams PR. Votage-clamp analysis of muscarinic excitation in hippocampal neurons. Brain Res. 1982;250:71–92. doi: 10.1016/0006-8993(82)90954-4. [DOI] [PubMed] [Google Scholar]
- Hampel H, Mesulam MM, Cuello AC, Khachaturian AS, Vergallo A, Farlow MR, Snyder PJ, Giacobini E, Khachaturian ZS. Revisiting the cholinergic hypothesis in Alzheimer’s disease: emerging evidence from translational and clinical research. J Prev Alzheimer’s Dis. 2019;1(6):2–15. doi: 10.14283/jpad.2018.43. [DOI] [PubMed] [Google Scholar]
- Hara Y, Motoi Y, Hikishima K, Mizuma H, Onoe H, Matsumoto SE, Elahi M, Okano H, Aoki S, Hattori N. Involvement of the septo-hippocampal cholinergic pathway in association with septal acetylcholinesterase upregulation in a mouse model of tauopathy. Curr Alzheimer Res. 2017;14(1):94–103. doi: 10.2174/1567205013666160602235800. [DOI] [PubMed] [Google Scholar]
- Hardy JA, Higgins GA. Alzheimer’s disease: the amyloid cascade hypothesis. Science. 1992;256:184–185. doi: 10.1126/science.1566067. [DOI] [PubMed] [Google Scholar]
- Hardy J, Selkoe DJ. The amyloid hypothesis of Alzheimer’s disease: progress and problems on the road to therapeutics. Science. 2002;297:353–356. doi: 10.1126/science.1072994. [DOI] [PubMed] [Google Scholar]
- Hasselmo ME. The role of acetylcholine in learning and memory. Curr Opin Neurobiol. 2006;16:710–715. doi: 10.1016/j.conb.2006.09.002. [DOI] [PMC free article] [PubMed] [Google Scholar]
- He X, Peng Y, Gao H (2012) Study on reduction algorithm in hippocampal neuron complex model. In: The 2012 8th international conference on natural computation, pp 178–182
- Ihl R, Dierks T, Martin EM, Froolich L, Maurer K. Topography of the maximum of the amplitude of EEG frequency bands in dementia of the Alzheimer type. Biol Psychiatry. 1996;39:319–325. doi: 10.1016/0006-3223(95)00174-3. [DOI] [PubMed] [Google Scholar]
- Lewis PR, Shute CC. The cholinergic limbic system: projections to hippocampal formation, medisl cortex, nuclei of the ascending cholinergic reticular system, and the subfornical organ and supra-optic crest. Brain. 1967;90:521–540. doi: 10.1093/brain/90.3.521. [DOI] [PubMed] [Google Scholar]
- Lewis PR, Shute CC, Silver A. Comfirmation from choline acetylase analyses of a massive cholinergic innervation to the rat hippocampus. J Physiol. 1967;191:215–224. doi: 10.1113/jphysiol.1967.sp008246. [DOI] [PMC free article] [PubMed] [Google Scholar]
- Li X, Coyle D, Maguire L, Watson DR, McGinnity TM. Gray matter concentration and effective connectivity changes in Alzheimer’s disease: a longitudinal structural MRI study. Neuroradiology. 2010;53:733–748. doi: 10.1007/s00234-010-0795-1. [DOI] [PubMed] [Google Scholar]
- Liu X, Zhang C, Ji Z, Ma Y, Shang X, Zhang Q, Zheng W, Li X, Gao J, Wang R, Wang J, Yu H. Multiple characteristics analysis of Alzheimer’s electroencephalogram by power spectral density and Lempel–Ziv complexity. Cogn Neurodyn. 2016;10:121–133. doi: 10.1007/s11571-015-9367-8. [DOI] [PMC free article] [PubMed] [Google Scholar]
- Madison DV, Lancaster B, Nicoll RA. Voltage clamp analysis of cholinergic action in the hippocampus. J Neurosci. 1987;7:733–741. doi: 10.1523/JNEUROSCI.07-03-00733.1987. [DOI] [PMC free article] [PubMed] [Google Scholar]
- Menschik ED, Finkel LH. Cholinergic neuromodulation of an anatomically reconstructed hippocampal CA3 pyramidal cell. Neurocomputing. 2000;32–33:197–205. [Google Scholar]
- Nilsson L, Nordberg A, Hardy J, Wester P, Winblad B. Physostigmine restores 3H-acetylcholine efflux from Alzheimer brain slices to normal level. J Neural Transm. 1986;67:275–285. doi: 10.1007/BF01243353. [DOI] [PubMed] [Google Scholar]
- Nobukawa S, Yamanishi T, Nishimura H, Wada Y, Kikuchi M, Takahashi T. Atypical temporal-scale-specific fractal changes in Alzheimer’s disease EEG and their relevance to cognitive decline. Cogn Neurodyn. 2019;13:1–11. doi: 10.1007/s11571-018-9509-x. [DOI] [PMC free article] [PubMed] [Google Scholar]
- Pan Y. Alterations of potassium channels in rat brain with β-amyloid peptide impairment and studies of potassium channel regulators. Beijing: Chinese Academy of Medical Sciences & Peking Union Medical College; 2004. [Google Scholar]
- Peng Y. Study on dynamic characteristics of the hippocampal neuron under current stimulation. Adv Mater Res. 2011;341–342:350–354. [Google Scholar]
- Peng Y. Study on the complex neuron model’s reduction and its dynamic characteristics. Int J Nonlinear Sci Numer. 2015;16:129–139. [Google Scholar]
- Peng Y, Wang J, Zheng C. Study on dynamic characteristics’ change of hippocampal neuron reduced models caused by the Alzheimer’s disease. J Biol Dyn. 2016;10:250–262. doi: 10.1080/17513758.2016.1162856. [DOI] [PubMed] [Google Scholar]
- Perry EK, Tomlinson BE, Blessed G, Bergmann K, Gibson PH, Perry RH. Correlation of cholinergic abnormalities with senile plaques and mental test scores in senile dementia. Br Med J. 1978;2(6150):1457–1459. doi: 10.1136/bmj.2.6150.1457. [DOI] [PMC free article] [PubMed] [Google Scholar]
- Ponomareva NV, Korovaitseva GI, Rogaev EI. EEG alterations in non-demented individuals related to apolipoprotein E genotype and to risk of Alzheimer’s disease. Neurobiol Aging. 2008;29:819–827. doi: 10.1016/j.neurobiolaging.2006.12.019. [DOI] [PubMed] [Google Scholar]
- Qi JS, Qiao JT. Suppression of large conductance Ca2+-activated K+ channels by amyloid beta-protein fragment 31–35 in membrane patches excised from hippocampal neurons. Sheng Li Xue Bao. 2001;53:198–204. [PubMed] [Google Scholar]
- Ramsden M, Plant LD, Webster NJ, Vaughan PF, Henderson Z, Pearson HA. Different effects of unaggregated and aggregated amyloid beta protein (1-40) on K+ channel currents in cultures of rat cerebellar granule and cortical neurons. J Neurochem. 2001;79:699–712. doi: 10.1046/j.1471-4159.2001.00618.x. [DOI] [PubMed] [Google Scholar]
- Robbe D, Buzsaki G. Alteration of theta timescale dynamics of hippocampal place cells by a cannabinoid is associated with memory impairment. J Neurosci. 2009;29:12597–12605. doi: 10.1523/JNEUROSCI.2407-09.2009. [DOI] [PMC free article] [PubMed] [Google Scholar]
- Sarter M, Hasselmo ME, Bruno JP, Givens B. Unraveling the attentional functions of cortical cholinergic inputs: interactions between signal-driven and cognitive modulation of signal detection. Brain Res Rev. 2005;48:98–111. doi: 10.1016/j.brainresrev.2004.08.006. [DOI] [PubMed] [Google Scholar]
- Sen-Bhattacharya B, Serap-Sengor N, Cakir Y, Maguire L, Coyle D (2014) Spectral and non-linear analysis of thalamocortical neural mass model oscillatory dynamics. In: Advanced computational approaches to biomedical engineering, pp 87–112
- Shah MM, Migliore M, Valencia I, Cooper EC, Brown DA. Functional significance of axonal Kv7 channels in hippocampal pyramidal neurons. Proc Natl Acad Sci USA. 2008;105:7869–7874. doi: 10.1073/pnas.0802805105. [DOI] [PMC free article] [PubMed] [Google Scholar]
- Sims NR, Bowen DM, Smith CC, Flack RH, Davison AN, Snowden JS, Neary D. Glucose metabolism and acetylcholine synthesis in relation to neuronal activity in Alzheimer’s disease. Lancet. 1980;1(8164):333–336. doi: 10.1016/s0140-6736(80)90884-3. [DOI] [PubMed] [Google Scholar]
- Wang R, Wang J, Yu H, Wei X, Yang C, Deng B. Power spectral density and coherence analysis of Alzheimer’s EEG. Cogn Neurodyn. 2015;9:291–304. doi: 10.1007/s11571-014-9325-x. [DOI] [PMC free article] [PubMed] [Google Scholar]
- Webster NJ, Ramsden M, Boyle JP, Pearson HA, Peers C. Amyloid peptides mediate hypoxic increase of L-type Ca2+ channels in central neurons. Neurobiol Aging. 2006;27:439–445. doi: 10.1016/j.neurobiolaging.2005.02.002. [DOI] [PubMed] [Google Scholar]
- Whitehouse PJ, Price DL, Struble RG, Clark AW, Coyle JT, Delon MR. Alzheimer’s disease and senile dementia: loss of neurones in basal forebrain. Science. 1982;217:408–417. doi: 10.1126/science.7058341. [DOI] [PubMed] [Google Scholar]
- Zou X, Coyle D, Wong-Lin K, Maguire L. Computational study of hippocampal-septal theta rhythm changes due to beta-amyloid-altered ionic channels. PLoS One. 2011;6(6):e21597. doi: 10.1371/journal.pone.0021579. [DOI] [PMC free article] [PubMed] [Google Scholar]
- Zou X, Coyle D, Wong-Lin K, Maguire L. Beta-amyloid changes in A-type K+ current can alter hippocampo-septal network dynamics. J Comput Neurosci. 2012;32:465–477. doi: 10.1007/s10827-011-0363-7. [DOI] [PubMed] [Google Scholar]


