

Abstract
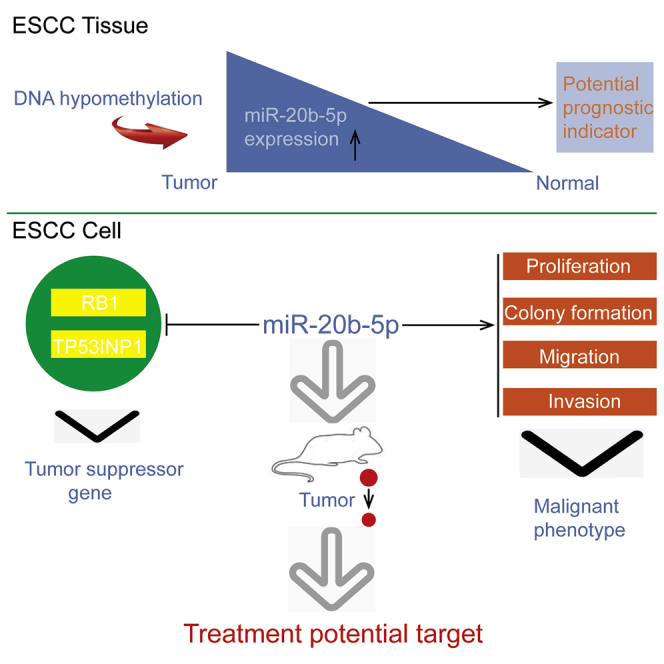
Novel therapies tailored to the molecular composition mechanism of esophageal squamous cell carcinoma (ESCC) are needed to improve patient survival. miR-20b-5p expression was significantly upregulated in cancerous tissues and associated with lymph node metastasis, clinical stage, and overall survival (OS). An analysis of the methylation status of the miR-20b-5p gene indicated that the hypomethylation of the CpG sites located upstream of the miR-20b-5p gene in the ESCC tissues was more frequent than in the adjacent normal tissues, and the methylation status of miR-20b-5p correlated inversely with its expression levels. Notably, a series of gain- and loss-of-function assays elucidated that miR-20b-5p promoted ESCC cell proliferation, migration, and invasion both in vitro and in vivo. Luciferase reporter assays, western blot, and qRT-PCR revealed that RB1 and TP53INP1 were the direct targets of miR-20b-5p. Moreover, the effects of ectopic miR-20b-5p expression were abrogated by RB1 and TP53INP1 overexpression. In contrast, the effects of miR-20b-5p depletion were impaired by RB1 and TP53INP1 knockdown. Treatment with a miR-20b-5p antagomir dramatically increased tumor growth and inhibited RB1 and TP53INP1 protein expression in nude mice. This work provided novel insights on the molecular mechanism of ESCC and further provided suggestions for therapy development.
Keywords: esophageal squamous cell carcinoma, ESCC, microRNAs, methylation, biomarkers
Graphical Abstract
Introduction
On the global scale, esophageal cancer ranks sixth in terms of cancer-associated mortality.1 Each year, more than 480,000 new cases emerge, while 400,000 patients succumb to the malignant tumor.2 This tumor type can be subdivided into esophageal squamous cell carcinoma (ESCC) and adenocarcinoma, while adenocarcinoma is globally less prevalent than ESCC.3, 4, 5, 6, 7 Despite the great efforts underlying some recent advancements, the occurrence and development of esophageal malignancies still require more in-depth research work, especially with regard to the molecular details, to facilitate the development of novel treatments, thereby increasing patient survival.
MicroRNAs (miRNAs), which belong to a class of small noncoding RNAs, with lengths ranging from 18 to 25 nt, generally bind to the recognition site within specific mRNAs to induce mRNA degradation or inhibit translation, thereby regulating the downstream pathways.8,9 It was reported that miRNAs could affect multiple biological processes, from cell division to cell death, by silencing gene functions at the post-transcriptional level. The regulatory functions of miRNAs were mainly achieved by targeting the partially complementary sequences within the 3′ UTR of mRNAs.10 Specifically, miRNAs could either induce or prevent tumor development, which would be determined by the actual functions of the targeted mRNAs.11 Accordingly, previous studies demonstrated the clinical significance of various tumor-related miRNAs, especially in the diagnosis and prognosis of tumors.12, 13, 14, 15, 16
The gene for miR-20b-5p resides in chromosome region Xq26.2. For mammals, this family of miRNAs, including miR-20b-3p and miR-20b-5p, is highly conserved. According to The Cancer Genome Atlas (TCGA) database (https://www.cancer.gov/about-nci/organization/ccg/research/structural-genomics/tcga), along with the results of recent relevant research, miR-20b-5p expression has a significant increase in ESCC tissue and serum, and the increase becomes more significant due to the advanced stages of esophageal cancer (stages III and IV).17
Until this study, the molecular mechanism by which miR-20b-5p could influence ESCC progression remained largely unknown. Therefore, we managed to identify the mRNA target for the miRNA and the downstream signaling pathway for understanding the pathogenesis of ESCC, as well as providing a promising biomarker and therapeutic target for ESCC. In the first experiments, the expression status of the miR-20b-5p gene in ESCC was examined. Furthermore, the analytical investigation focused on the relationship between miR-20b-5p expression status and ESCC progression, together with the potency of serum miR-20b-5p as a noninvasive ESCC indicator. Based on the confirmation of clinical relevance, the analyses also investigated how miR-20b-5p participates in various biological processes to control tumor development at the molecular level.
Results
Increased miR-20b-5p Expression in Human ESCC Is Associated with Poor Survival Rates
In order to clarify the influences of miR-20b-5p on ESCC progression, we used TCGA database to analyze miR-20b-5p expression in ESCC tissue. The expression of miR-20b-5p was significantly increased in ESCC tissues compared to the adjacent esophageal tissues (Figure S1). Then, using an in situ hybridization method, the miR-20b-5p expression levels of 93 ESCC-positive samples were assessed and compared with adjacent non-ESCC esophageal tissue samples. It was observed that the scrambled miRNA staining results were negative or insignificant in the controls (Figure 1A). Nonetheless, the U6 small nuclear RNA (snRNA) signals could be obviously detected in the esophageal tissue (Figure 1B). Accordingly, the results confirmed that miR-20b-5p expression was significantly increased in ESCC tissues (Figures 1C and 1D). Furthermore, a higher average level of miR-20b-5p was detected in advanced clinical stages than that in early clinical stages (Figure 1D; discovery group of Table 1). Moreover, the clinicopathological features of ESCC samples were analyzed to determine whether the miR-20b-5p expression level could influence the clinicopathological features. The overexpression of miR-20b-5p showed significant association with the advanced tumor progression and the occurrence of lymph node metastasis, as detailed in the discovery group of Table 1.
Figure 1.

In Situ Hybridization to Detect miR-20b-5p Expression in 93 Paired ESCC and Adjacent Noncancerous Tissue Samples
(A) Scrambled miRNA negative control (no expression). (B) U6 snRNA positive control (strong expression). (C) miR-20b-5p expression in adjacent esophageal tissues (no or low expression). (D) miR-20b-5p expression in ESCC tissues (left: miR-20b-5p expression in ESCC tissues; middle: low or moderate expression; right: strong expression).
Table 1.
Correlation of miR-20b-5p Expression with ESCC Clinicopathological Characteristics
| Clinical Detail | Discovery Groupa (n = 93) |
Validation Groupa (n = 92) |
||||
|---|---|---|---|---|---|---|
| Low (n = 21) (%) | High (n = 72) (%) | p | Low (n = 25) (%) | High (n = 67) (%) | p | |
| Sex | ||||||
| Male | 18 (23.4) | 59 (76.6) | 0.687 | 21 (27.3) | 56 (72.7) | 0.961 |
| Female | 3 (18.8) | 13 (81.2) | 4 (26.7) | 11 (73.3) | ||
| Age | ||||||
| ≤60 | 6 (22.2) | 21 (77.8) | 0.958 | 7 (21.9) | 25 (78.1) | 0.404 |
| >60 | 15 (22.7) | 51 (77.3) | 18 (30.0) | 42 (70.0) | ||
| Tumor size | ||||||
| <5 cm | 9 (17.6) | 42 (82.4) | 0.210 | 15 (25.9) | 43 (74.1) | 0.712 |
| ≥5 cm | 12 (28.6) | 30 (71.4) | 10 (29.4) | 24 (70.6) | ||
| Tumor stageb | ||||||
| T1+T2 | 7 (31.8) | 15 (68.2) | 0.270 | 4 (20.0) | 16 (80.0) | 0.415 |
| T3+T4 | 13 (20.3) | 51 (79.7) | 21 (29.2) | 51 (70.8) | ||
| Histological grade | ||||||
| Well/moderate | 18 (24.3) | 56(75.7) | 0.427 | 23 (31.1) | 51 (68.9) | 0.088 |
| Poor/NS | 3 (15.8) | 16 (84.2) | 2 (11.1) | 16 (88.9) | ||
| Lymph node metastasis | ||||||
| Negative | 17 (37.8) | 28 (62.2) | 0.001 | 19 (36.5) | 33 (63.5) | 0.021 |
| Positive | 4 (8.3) | 44 (91.7) | 6 (15.0) | 34 (85.0) | ||
| Clinical stageb | ||||||
| I+II | 17 (35.4) | 31 (64.6%) | 0.002 | 20 (39.2) | 31 (60.8) | 0.004 |
| III+IV | 3 (7.5) | 37 (92.5) | 5 (12.2) | 36 (87.8) | ||
NS, not systematization.
The samples of in situ hybridization were named as the “discovery group,” and the other samples using qRT-PCR were named as the “validation group.”
Numbers may be less than the total number if missing data.
Also, from the clinical perspective, the results of Kaplan-Meier testing indicated that overexpressed miR-20b-5p was associated with reduced survival rates (Figure 2A). In addition, other relevant clinical factors, including age, sex, histological type, clinical stages, and the miRNA profile, could be taken into account as co-variates. Therefore, multivariate Cox regression was adopted for estimating the independent prognostic significance underlying miR-20b-5p, as outlined in the discovery group of Table 2.
Figure 2.

Relative miR-20b-5p Expression Levels in ESCC Tissues and Serum and Its Clinical Significance
(A) Kaplan-Meier overall survival curves with high and low miR-20b-5p expression in 93 patients with ESCC. (B) Quantitation of miR-20b-5p was performed using qRT-PCR in 92 paired ESCC (T) and corresponding control tissues (N). The fold changes were calculated by relative quantification (2−ΔCt, with U6 as the internal control). (C and D) miR-20b-5p expression was detected in lymph node metastasis (C) and different clinical stages (D) of ESCC. (E) Kaplan-Meier curves depicting overall survival according to the expression of miR-20b-5p. (F) The expression level of serum miR-20b-5p in 102 ESCC patients and 60 healthy controls were measured by qRT-PCR and normalized to U6. (G and H) miR-20b-5p expression was detected in lymph node metastasis (G) and different clinical stages (H). (I) Receiver operating characteristic (ROC) curve analysis of the miR-20b-5p assay ratio for diagnosing ESCC patients.
Table 2.
Multivariate Cox Regression Results for Candidate Factor Interfering OS of ESCC
| Variable | Discovery Group (n = 93) |
Validation Group (n = 92) |
||||
|---|---|---|---|---|---|---|
| 95% CI | RR | p | 95% CI | RR | p | |
| Sex (male versus female) | 0.168–1.187 | 0.447 | 0.106 | 0.192–1.078 | 0.455 | 0.073 |
| Age (≤60 versus >60 years) | 0.771–2.737 | 1.452 | 0.248 | 0.595–1.860 | 1.052 | 0.861 |
| Tumor size (≤5 versus >5 cm) | 0.664–2.092 | 1.179 | 0.574 | 0.464–1.465 | 0.824 | 0.510 |
| Tumor stages (T1+T2 versus T3+T4) | 0.613–3.020 | 1.360 | 0.449 | 0.746–3.633 | 1.647 | 0.217 |
| Histologic grade (well/moderate versus poor/NS) | 0.729–2.870 | 1.446 | 0.292 | 0.340–1.415 | 0.693 | 0.314 |
| Lymph node metastasis (negative versus positive) | 0.148–5.839 | 0.929 | 0.937 | 0.368–2.475 | 0.954 | 0.924 |
| Clinical stages (I+II versus III+IV) | 0.241–10.360 | 1.597 | 0.634 | 0.353–2.806 | 0.996 | 0.994 |
| miR-20b-5p expression levels (low versus high) | 1.190–5.720 | 2.609 | 0.017 | 1.538–7.310 | 3.353 | 0.002 |
OS, overall survival; 95% CI, 95% confidence interval; RR, relative risk; NS, not systematization.
To validate miR-20b-5p overexpression in ESCC tissues, qRT-PCR was the optimal approach to quantify the miRNA expression. The ratio of the relative expression in 92 paired ESCC tissues and in the control groups was used as the cutoff value, which was calculated by the 2−ΔΔCt method To determine high expression, the ratio should be higher than 1; to determine low expression, the ratio should be lower than 1. According to the quantitative analyses, in 92 examined samples taken from the tumor site of ESCC, the miR-20b-5p expression levels were remarkably upregulated compared to the paired control samples (Figure 2B; Table 1). Furthermore, the miR-20b-5p expression levels were particularly high due to the occurrence of metastatic lymph node or advanced ESCC, namely stages III and IV (Figures 2C and 2D; validation group of Table 1). According to the Kaplan-Meier survival test, the overexpressed miR-20b-5p showed significant correlation with the poor prognosis of ESCC patients (Figure 2E). Based on the capability to deal with the impact of multiple factors on survival time, the Cox regression model could be commonly used in the etiology exploration and prognosis analysis of tumors. Thereby, it was verified that the miRNA signature could be an independent prognostic factor indicating the overall survival (OS) of the ESCC patients, as indicated by the results of multivariate Cox regression, which are listed in the validation group of Table 2.
Finally, by qRT-PCR, we measured the mature miR-20b-5p level in the serum of 102 ESCC patients and 60 healthy control groups. The expression of the miRNA was significantly higher in the serum of ESCC patients than that in the control group (Figure 2F; Table 3). Similarly, the serum miR-20b-5p was positively associated with the occurrence of lymph node metastasis or advanced ESCC stages, namely stages III and IV (Figures 2G and 2H; Table 3). To determine whether the serum miR-20b-5p could be considered as a biomarker for the diagnosis and prognosis of ESCC, the receiver operating characteristic (ROC) curve was generated with the expression level of miR-20b-5p in serum. As shown in Figure 2I, the area under the curve (AUC) of miR-20b-5p was 0.859 (95% confidence interval, 0.801–0.916), with a sensitivity of 76.3% and a specificity of 87.1%. These data suggested that miR-20b-5p was a stable and relatively reliable diagnostic and predictive biomarker to discriminate ESCC patients from normal controls.
Table 3.
Serum miR-20b-5p Expression Based on ESCC Clinicopathological Characteristics
| Characteristics | miR-20b-5p Expression Status |
||
|---|---|---|---|
| Low (n = 51) (%) | High (n = 51) (%) | p | |
| Sex | |||
| Male | 39 (51.3) | 37 (48.7) | 0.650 |
| Female | 12(46.2) | 14 (53.8) | |
| Age | |||
| <60 | 20 (44.4) | 25 (55.6) | 0.319 |
| ≥60 | 31 (54.4) | 26 (45.6) | |
| Tumor size | |||
| <5 cm | 36 (52.2) | 33 (47.8) | 0.525 |
| ≥5 cm | 15 (45.5) | 18 (54.5) | |
| Tumor stage | |||
| T1+T2 | 20 (57.1) | 15 (42.9) | 0.297 |
| T3+T4 | 31 (46.3) | 36 (53.7) | |
| Histological grade | |||
| Well/moderate | 38 (52.8) | 34 (47.2) | 0.385 |
| Poor/NS | 13 (43.3) | 17 (56.7) | |
| Lymph node metastasis | |||
| Negative | 31 (62.0) | 19 (38.0) | 0.017 |
| Positive | 20 (38.5) | 32 (61.5) | |
| Clinical stages | |||
| I+II | 41 (69.5) | 18 (30.5) | 0.000 |
| III+IV | 10 (23.3) | 33 (76.7) | |
NS, not systematization.
DNA Hypomethylation Results in miR-20b-5p Overexpression in ESCC
As the miR-20b-5p promoter contained multiple CpG sites, DNA methylation might be a part of the mechanism to regulate miR-20b-5p transcription. The amplicon, which was located within the miR-20b-5p promoter region, was 310 bp in length and included CpG units. Each CpG unit might contain one or more CpG sites. The hierarchical clustering analysis was conducted to evaluate the significances of the CpG sites for ESCC, as detailed in Figure 3A. Then, the CpG methylation level was determined according to the color of each miR-20b-5p CpG unit in each sample. According to the overall methylation profile provided by the cluster analysis, miR-20b-5p DNA methylation status showed notable difference in the ESCC tissues compared with the normal esophageal tissues (Figure 3B). Also, this study evaluated the individual methylation levels of CpG units within the miR-20b-5p promoter, and seven CpG units were identified, which had significantly suppressed methylation in the ESCC tissue samples compared with the normal esophageal tissue samples (Figure 3C). The results of nonparametric tests revealed that the methylation levels at CpG_1.2.3.4.5, CpG_6, CpG_7.8, CpG_9, CpG_10.11.12, CpG_13, and CpG_14 showed significant decreases in the ESCC tissue samples (mean methylation of 14.72%, 17.32%, 23.53%, 14.34%, 12.35%, 10.54%, and 14.04%, respectively) when compared with those of the paired normal esophageal tissue samples (mean methylation of 28.45%, 25.91%, 26.52%, 32.53%, 41.52%, 42.52%, and 40.71%, respectively; p < 0.05). Therefore, in the examined ESCC tissues, the miR-20b-5p overexpression had significant correlation with miR-20b-5p promoter hypomethylation.
Figure 3.

DNA Methylation Status of miR-20b-5p by MassARRAY
(A) Methylation profile of CpG sites for the miR-20b-5p gene. The color of the circles is related to the percentage of methylation at each CpG site. Boxes indicate the different methylation patterns between 14 ESCC samples and the corresponding tissues. (B) Hierarchical cluster analysis of CpG site methylation profiles of the miR-20b-5p promoter region in esophageal squamous cell carcinoma (n = 14) and control esophageal tumors (n = 14). The color gradient between green and red indicates methylation of each miR-20b-5p unit in each sample ranging from 0% to 60%. Gray represents technically inadequate or missing data. (C) Evaluation of CpG methylation within the miR-20b-5p promoter. The distribution of the seven analyzed CpG units within miR-20b-5p is shown. Data are presented as the mean value ± SD from triplicate experiments. @@p < 0.01.
Promotion by miR-20b-5p Overexpression on ESCC Cell Growth and Metastasis
Considering the relatively low miR-20b-5p expression among the seven ESCC cell lines (Figure 4A), KYSE30 and KYSE180 were chosen for subsequent examination of miR-20b-5p expression profiles. Henceforth, to clarify miR-20b-5p functions on regulating ESCC cellular activities, the KYSE30 and KYSE180 cells were transfected with a miR-20b-5p mimic. The transfection efficiency could be confirmed with the considerably increased miR-20b-5p expression, which was determined using the aforementioned qRT-PCR method (Figure 4B). Thereby, the results of cellular function assays demonstrated that the increased exogenous miR-20b-5p expression had markedly promoted the proliferation, colony formation, migration, and invasion processes of the KYSE30 and KYSE180 cells, as illustrated in Figures 4C–4H.
Figure 4.

miR-20b-5p Overexpression Promoted Cell Proliferation, Colony Formation, and Migration
(A) The RNA level of miR-20b-5p in seven ESCC cell lines. (B) Quantitation of the miR-20b-5p expression level after transfection with miR-20b-5p mimic in KYSE30 and KYSE180 cell lines. (C and D) The cell growth curve was measured by MTS after transfection with the miR-20b-5p mimic in KYSE30 (C) and KYSE180 (D) cell lines, and the optical density (OD)570 was normalized to the star point (0 h). (E and F) Representative images were taken and quantitation of colony formation was performed after transfection with miR-20b-5p mimic in KYSE30 (E) and KYSE180 (F) cell lines. (G and H) Representative images were taken and quantitation of the transwell assay was performed after transfection with the miR-20b-5p mimic in KYSE30 (G) and KYSE180 (H) cell lines. Data are presented as the mean value ± SD from triplicate experiments. @p < 0.05, @@p < 0.01.
Next, the ESCC cells were transfected with a miR-20b-5p inhibitor to confirm the effects of the miRNA expression, which was remarkably altered in the opposite direction (Figure 5A). Consequently, as induced by the inserted inhibitor, the suppressed miR-20b-5p expression could suppress the biological activities of the TE1 and EC109 cells in vitro, such as cell growth (Figures 5B and 5C), colony formation (Figures 5D and 5E), and cell migration and cell invasion (Figures 5F and 5G). Upon downregulation of miR-20b-5p, the percentages of ESCC cells in the early and late phases clearly increased compared with the percentages measured in the controls (Figure S2), indicating that miR-20b-5p downregulation resulted in apoptosis arrest in ESCC cells. These results were consistent with the expectations that arose from the earlier observations in this study.
Figure 5.

Repression of miR-20b-5p Expression Significantly Inhibited Cell Growth, Colony Formation, and Migration in ESCC Cells
(A) Quantitation of the miR-20b-5p expression level after transfection with the miR-20b-5p inhibitor in TE1 and EC109 cell lines. (B and C) The cell growth curve was measured by MTS after transfection with the miR-20b-5p inhibitor in TE1 (B) and EC109 (C) cell lines, and the OD570 was normalized to the star point (0 h). (D and E) Representative images were taken and quantitation of colony formation was performed after transfection with the miR-20b-5p inhibitor in TE1 (D) and EC109 (E) cell lines. (F and G) Representative images were taken and quantitation of the transwell assay was performed after transfection with the miR-20b-5p inhibitor in the TE1 (F) and EC109 (G) cell lines. Data are presented as the mean value ± SD from triplicate experiments. @p < 0.05, @@p < 0.01.
Targeting RB1 and TP53INP1 by miR-20b-5p to Induce Tumor Cell Increase and Metastasis
To identify how the miR-20b-5p gene regulated ESCC progression, the research for candidate downstream targets was conducted with several bioinformatics approaches, including miRDB, miRTarBase, and miRWalk (Figure 6A). Subsequently, the candidate genes with known regulatory functions on cell proliferation and invasive ability were examined using Gene Ontology (GO) terms together with qRT-PCR. According to the discoveries, the 3′ UTRs of the mRNA RB1 and TP53INP1 contained partially complementary sequences that could match the binding site of miR-20b-5p, as illustrated in Figure 6B. At that point, in order to verify whether RB1 and TP53INP1 could directly interact with the miRNA transcripts, the miR-20b-5p mimic was transfected into the KYSE30 and KYSE180 cells. The results showed remarkable downregulation on the mRNAs and proteins of RB1 and TP53INP1 (Figures 6C and 6D). In addition, the TE1 and EC109 cells were transfected with the miR-20b-5p inhibitor to confirm the relationship. Based on the results, the miR-20b-5p expression was downregulated by the inhibitor, which subsequently enhanced the mRNA and protein expression of RB1 and TP53INP1 for the TE1 and EC109 cells (Figures 6E and 6F). Next, the dual-luciferase reporter assay could clarify whether the miR-20b-5p functions relied on the RB1 and TP53INP1 expression. Then, the fragments included the miR-20b-5p binding sequences in the 3′ UTR regions of the RB1 and TP53INP1, or the corresponding mutated sequences were cloned into the dual-luciferase reporter vectors pmiR-RB-REPORT. The constructed reporters were introduced into the KYSE30 and KYSE180 cells together with the miR-20b-5p mimic or the miRNA negative control (miR-NC) via co-transfection, and the luciferase assay was carried out. Consequently, the miR-20b-5p mimic effectively inhibited the luciferase activities of the RB1-3′ UTR and TP53INP1-3′ UTR (Figures 6G–6I). Meanwhile, it was observed that the miR-NC failed to inhibit the luciferase activities of the RB1-3′ UTR and TP53INP1-3′ UTR. The inhibition by miR-20b-5p on the RB1-3′ UTR and TP53INP1-3′ UTR was considered to be sequence-specific, because the luciferase activities of RB1-mutant (mut) and TP53INP1-mut could not be inhibited by introduction of the miR-20b-5p gene. Therefore, it was concluded that the miR-20b-5p could directly bind to the 3′ UTR of RB1 and TP53INP1.
Figure 6.

RB1 and TP53INP1 Were Two Direct Target Genes of miR-20b-5p
(A and B) RB1 and TP53INP1 were identified as potential regulatory targets of miR-20b-5p by considering the downregulation of genes using prediction tools and qRT-PCR. (C and D) The expression levels of RB1 (C) and TP53INP1 (D) mRNA and protein were measured by qRT-PCR and western blot analysis using GAPDH as the loading control after transfection with miR-20b-5p mimic in the KYSE30 and KYSE180 cell lines, respectively. (E and F) The expression levels of RB1 (E) and TP53INP1 (F) mRNA and protein were measured by qRT-PCR and western blot analysis using GAPDH as the loading control after transfection with miR-20b-5p inhibitors in the TE1 and EC109 cell lines, respectively. (G–I) Dual-luciferase reporter assay. The relative luciferase activity was normalized to the Renilla luciferase activity assay after cotransfection with miR-20b-5p mimic and miR-RB-REPORT constructs containing WT or MUT RB1 and the TP53INP1 3′ UTR region in KYSE30 and KYSE180 cell lines. Data are presented as the mean value ± SD from triplicate experiments. @@p < 0.01.
To validate RB1 and TP53INP1 as the functional targets for miR-20b-5p in the KYSE30 and KYSE180 cells, the endogenous expression patterns of RB1 and TP53INP1 in the ESCC cells were disabled via the transfection of miR-20b-5p mimic and recovered via the transfection with the pEGFP-N1-RB1-expression or pEGFP-N1-TP53INP1-expression constructs (Figures 7A and 7B). The results proved that the migratory and invasive actions enhanced by the transfected miRNA mimic were counteracted by the presence of expression constructs, as detailed in Figures 7C–7F. Furthermore, the expressions of the RB1 and TP53INP1 could be silenced by siRNA transfection in the TE1 and EC109 cells, resulting in remarkably decreased mRNA and protein production (Figures 7G and 7H). Thereby, depending on silencing the expression of RB1 and TP53INP1, the migration and invasion activities were found to be significantly enhanced, as illustrated in Figures 7I and 7J. In contrast, when we respectively transfected the KYSE30 and KYSE180 cells with the RB1 and TP53INP1 plasmids, as expected, RB1 and TP53INP1 overexpression significantly inhibited the ESCC growth and metastasis regulatory properties (Figures S3 and S4).
Figure 7.

A Rescue Assay Was Performed to Confirm that RB1 and TP53INP1 Were the Functional Targets of miR-20b-5p
(A and B) Protein and mRNA levels of RB1 (A) and TP53INP1 (B) in KYSE30 and KYSE180 cell lines cotransfected with miR-20b-5p mimic and pEGFP-C1 plasmid containing RB1 and TP53INP1 CDS sequence. (C–F) Transwell assay of cells cotransfected with miR-20b-5p mimic and RB1 or TP53INP1 plasmids. (G and H) The expression of RB1 (G) and TP53INP1 (H) at the mRNA and protein level after siRNA silencing in TE1 or EC109 cells. (I and J) Transwell assay after transfection with RB1 (I) or TP53INP1 (J) siRNA in TE1 or EC109 cells, respectively. Data are presented as the mean value ± SD from triplicate experiments. @p < 0.05, @@p < 0.01.
In Vivo Tumor Growth and Metastasis Accelerated by miR-20b-5p Expression
As the final step, using nude mice as the animal model, this study investigated the regulatory function by the miR-20b-5p gene on ESCC development. During the examination, KYSE180 cells were transfected with either a lentiviral expression vector that could increase the miR-20b-5p expression (Lenti-mimic), or with a negative control lentiviral vector (Lenti-vector). The transfection efficiency was shown by the overexpressed miR-20b-5p in the KYSE180 cells, which was checked with qRT-PCR, as shown in Figure 8A. Then, subcutaneous injections of KYSE180 cells were conducted to cause transplanted tumors for BALB/c nude mice. During this process, since the 7th day from implantation, the lengths and widths of the tumors were tracked every 5 days, until six measurements were obtained. The growth curve of the transplanted tumor indicated obvious growth acceleration in the miR-20b-5p overexpression group compared to the controls (Figures 8B and 8C). Subsequently, the tumors were dissected, which was followed by the final measurements of the volumes and weights. The mean volume and weight of the group with miR-20b-5p overexpression had significant increases, as detailed in Figure 8D.
Figure 8.

miR-20b-5p Promoted Tumor Growth and Metastasis In Vivo
(A) miR-20b-5p expression levels in stable overexpressing KYSE180 cells (Lenti-mimic) and control cells (Lenti-vector). (B–D) Stable miR-20b-5p-overexpressing KYSE180 cells were subcutaneously injected into nude mice to form solid tumors, and representative images of tumor volumes and weights were analyzed by in vivo luciferase imaging on the last day of analysis (n = 5 for each group). (E and F) The metastatic nodules were observed in the lungs, brains, livers and bones of mice treated with stable miR-20b-5p-overexpressing KYSE180 cells or control vector cells by the vein injection method. (G–I) KYSE180 cells were subcutaneously injected into nude mice to form solid tumors and synchronously treated with miR-20b-5p antagomir or miRNA antagomir negative control (n = 5 for each group); a 10-nmol miR-20b-5p antagomir as well as the miRNA-negative control in 0.1 mL of saline buffer was locally injected into nude mice to treat tumor mass once every 5 days; tumor volumes (H) and weights (I) in nude mice are shown. (J) Immunohistochemical staining of Ki67, RB1, and TP53INP1 in tumor tissues dissected from nude mice treated with miR-20b-5p antagomir or the miRNA-negative control. (K) RB1 and TP53INP1 protein expression were measured by immunohistochemical staining in 103 ESCC samples and pair-matched esophageal tissues. @p < 0.05, @@p < 0.01.
At that point, intravenous injections of 106 luciferase-labeled tumor cells into the tail veins were conducted. The luciferase activities could represent the systemic tumor burden of the nude mice. In the group that had received the injections of the cells with overexpressed miR-20b-5p, the metastasis burdens in the lung, brain, liver, and bone were higher than those of the control group (Figures 8E and 8F). It was checked that the expression of miR-20b-5p was significantly higher in the miRNA overexpression group than in the control group by qRT-PCR (Figure S5A), while RB1 and TP53INP1 had oppositely altered expression levels (Figures S5B and S5C). The findings, depending on the mouse models, showed the regulatory function of miR-20b-5p to facilitate ESCC growth and metastasis. Accordingly, to investigate the inhibitory effect on ESCC growth in nude mice by the miR-20b-5p antagomir, BALB/c nude mouse tumorigenic models were prepared with the KYSE180 cell line. Following a 7-day waiting period, the miR-20b-5p antagomir or the miRNA antagomir NC (miR-antagomir NC) were administered into the implanted tumors via direct injections every 5 days. The tumor volumes were tracked every 5 days until the 32nd day. As a result from the treatment with miR-20b-5p antagomir, the tumor volumes and weights showed significant decreases compared to the group treated with the miR-antagomir NC, as detailed in Figures 8G–8I. The expression of miR-20b-5p was significantly decreased in the miRNA antagomir group compared with the control group, which was checked by qRT-PCR (Figure S5D). These results suggested that the miRNA antagomir could take along miRNA-20b-5p as a carrier, which could be used in a therapeutic scenario for appropriate delivery into tumor cells, specifically, as suggested by the ESCC mouse model.
In the next step, the tumor cell proliferation was evaluated with immunohistochemical staining for Ki-67 in the formalin-fixed, paraffin-embedded (FFPE) samples taken from the xenograft tumors. The staining intensities of tumor samples were observed to be lower than those of the miR-20b-5p antagomir group (Figure 8J). Moreover, compared to the group of miR-antagomir NC, the remarkable increases of RB1 and TP53INP1 expression levels were measured in the xenograft tumor samples treated with the miR-20b-5p antagomir, as detailed in Figure 8J. By pairing the 103 tumor-positive and adjacent tumor-negative samples, the results demonstrated that the RB1 and TP53INP1 expression levels were lower in ESCC samples than those of the controls (Figure 8K; Table 4).
Table 4.
Correlation between the RB1 and TP53INP1 Expressions and the ESCC Clinicopathological Parameters
| Clinical Details | RB1 Expression Status |
TP53INP1 Expression Status |
||||
|---|---|---|---|---|---|---|
| Low (n = 79) (%) | High (n = 24) (%) | p | Low (n = 36 (%) | High (n = 67) (%) | p | |
| Sex | ||||||
| Male | 65 (76.5) | 20 (23.5) | 0.905 | 56 (65.9) | 29 (34.1) | 0.407 |
| Female | 14 (77.8) | 4 (22.2) | 10 (55.6) | 8 (44.4) | ||
| Agea | ||||||
| <60 | 29 (82.9) | 6 (17.1) | 0.307 | 23 (65.7) | 12 (34.3) | 0.793 |
| ≥60 | 48 (73.8) | 17 (26.2) | 41 (63.1) | 24 (36.9) | ||
| Tumor sizea | ||||||
| < 5 cm | 46 (78.0) | 13 (22.0) | 0.783 | 37 (62.7) | 22 (37.3) | 0.748 |
| ≥5 cm | 31 (75.6) | 10 (24.4) | 27 (65.9) | 14 (34.1) | ||
| Tumor stage | ||||||
| T1+T2 | 9 (75.0) | 3(25.0) | 0.882 | 5 (41.7) | 7 (58.3) | 0.085 |
| T3+T4 | 70 (76.9) | 21(23.1) | 61 (67.0) | 60 (33.0) | ||
| Histological grade | ||||||
| Well/moderate | 58 (77.3) | 17 (22.7) | 0.803 | 47 (62.7) | 28 (37.3) | 0.625 |
| Poor/NS | 21 (75.0) | 7 (25.0) | 19 (67.9) | 9 (32.1) | ||
| Lymph node metastasis | ||||||
| Negative | 25 (54.3) | 21 (45.7) | 0.000 | 21 (45.7) | 25 (54.3) | 0.000 |
| Positive | 52 (94.5) | 3 (5.5) | 45 (81.8) | 10 (18.2) | ||
| Clinical stages | ||||||
| I+II | 20 (51.3) | 19 (48.7) | 0.000 | 17(43.6) | 22 (56.4) | 0.000 |
| III+IV | 57 (91.9) | 5 (8.1) | 49 (79.0) | 13 (21.0) | ||
NS, not systematization.
Numbers may be less than the total number if missing data.
Discussion
According to the results from the current study, the miR-20b-5p expression showed significant upregulation in the ESCC samples in comparison with the corresponding normal tissue samples. Importantly, note that the miR-20b-5p overexpression could be detected using the serum samples taken from the ESCC patients. Overall, the abnormally increased expression patterns of miR-20b-5p were positively correlated with the invasive ability of tumor, metastatic lymph nodes, and advanced ESCC stages according to tumor, node, and metastasis (TNM) system. According to the precedent-setting work, Huang et al.17 reported that the expression patterns of five serum miRNAs (miR-20b-5p, miR-28-3p, miR-192-5p, miR-223-3p, and miR-296-5p) showed significant increases among the cancerous samples compared to the tumor-negative samples. Furthermore, miR-20b expression was significantly higher in the brain metastases of breast cancer, compared to the primary breast tumors without brain metastasis.18 For miR-138 and miR-145, downregulated miRNA expression levels in ESCC tissue have been pointed out.19, 20, 21, 22, 23, 24 In comparison, miR-21, miR-200c, and miR-133a were upregulated with the presence of esophageal malignancy.25,26 Multiple miRNAs, namely miR-10, miR-182, miR-338-3p, and miR-708-5p, had positive associations with the advanced tumor stages of non-small cell lung cancer (NSCLC), as well as with lymph node metastasis.27, 28, 29, 30 Moreover, endogenous circulating miRNAs have been investigated with increasing interest, due to the potency to accurately estimate the risks, occurrence levels, staging, and prognosis for various tumor types. For example, the serum exosomes of miR-296-5p were proved to be indicative for ESCC diagnosis and staging, due to its increasing expression in higher-stage cancer cases.17 These types of serum-based approaches were thought to be more advantageous than the invasive biopsy methods, while the biopsy methods currently served as the mainstream approaches for tumor-related clinical examinations, especially for ESCC. In particular, to facilitate the utilization of miRNA indicators in clinical practice, this study was the first to verify the actual significance of miR-20b-5p within the tissue and serum in clinical examinations.
DNA hypomethylation-mediated activation of oncogenic miRNAs was suggested to be a key factor for promoting tumorigenesis. Such oncogenic miRNAs could directly target the tumor suppressor genes and silence them. In previous research, aberrant promoter methylation was associated with the gene silencing function of several miRNAs in prostate cancer cases.31, 32, 33 This phenomenon could also be real in terms of a variety of miRNAs, such as miR-196b, miR-9-1, let-7a-3, miR-106a, and miR-146a.34, 35, 36, 37 Therefore, the present study hypothesized that this epigenetic mechanism could induce miR-20b-5p upregulation. Furthermore, the overall methylation status of the examined ESCC tissues was observed to be notably lower than that of the normal esophageal tissue samples, which was consistent with miR-20b-5p upregulation in ESCC tissues. Therefore, this was also the first study to investigate the underlying regulatory mechanism that modulates the endogenous expression of miR-20b-5p via DNA methylation.
Based on the previous works, it was suggested that the molecular details relevant to the functions of miR-20b-5p in ESCC would offer some new clues toward the comprehensive understanding of ESCC pathogenesis. In line with this expectation, it was confirmed that the abnormally overexpressed miR-20b-5p could increase tumor cell proliferation, colony formation, and invasive potency. Meanwhile, suppressed miR-20b-5p expression was shown to induce the opposite effects. To conclude, miR-20b-5p was tumorigenic for ESCC. Additionally, this study demonstrated that more remarkably increased expression levels of miR-20b-5p could be detected in the metastatic ESCC specimens, which were sampled from tumors at advanced stages. Moreover, overexpressed miR-20b-5p facilitated tumor development in mice, while the overexpression was also positively associated with distant metastasis. Importantly, also note that the exogenously enhanced miR-20b-5p expression led to the accelerated growth of transplanted tumors in vivo, which promised certain therapeutic effects to suppress ESCC growth via targeting miR-20b-5p. These results suggested that the miRNA antagomir could take along miRNA-20b-5p as a carrier, which could be used in a therapeutic scenario for appropriate delivery into tumor cells, and it was specifically proved using the ESCC mouse model. Nevertheless, a limitation of the present study was caused by the lack of ongoing clinical trials testing the application of miR-20b-5p in any disease. Therefore, the clinical significance of miR-20b-5p requires further research to evaluate.
The results from previous works suggested the existence of an autoregulatory feedback loop between E2F1 and miR-20a-5p/miR-20b-5p, which might have critical influence on the proliferation and differentiation of myoblasts through autoregulatory interactions. As follow-up research, findings in another recent study elucidated the molecular interactions underlying muscle differentiation with the emphasis on miR-20b-5p, which extended the knowledge base about muscle cell development and abnormality.38 Moreover, the long noncoding RNA H19 was discovered to accelerate the progression of endometrial cancer via the miR-20b-5p/AXL/HIF-1α signaling pathway, which was considered as a promising access point to improve the diagnosis and treatment strategies for endometrial cancer.39 Similarly, the results obtained in the current study showed that miR-20b-5p had certain associations with the growth and metastasis of ESCC. Therefore, the innovation of therapeutic techniques that target miR-20b-5p, in combination with the currently conventional first-line anti-ESCC therapy methods, might be particularly beneficial for ESCC patients prone to high risks of metastasis.
To further identify the downstream signaling pathway underlying the above-mentioned functions of miR-20b-5p, this study selected the putative targets of miR-20b-5p in ESCC with cutting-edge bioinformatics tools. The results of bioinformatics analysis revealed that miR-20b-5p could target the 3′ UTR binding sites of mRNA RB1 and TP53INP1. In addition, it was demonstrated that the expression levels of RB1 and TP53INP1 could be effectively repressed by miR-20b-5p. Since the miR-20b-5p gene belonged to the miR-106a-363 cluster, which was known to be closely related to the miR-17-92 and miR-106b-25 clusters, it could be classified as a member of the miR-17 family.40,41 The tumor suppressor PTEN was reported to be targeted by miR-20b-5p.42 Similarly, RB1 was also recognized as a tumor suppressor, especially in controlling cellular growth and tumorigenesis.43 Specifically, the aberrant RB1 level was known to inhibit the development of various cancer cells by modulating DNA replications, cell cycles, and apoptosis.44 Previous studies have also reported the correlations of RB1 with lung metastasis and breast cancer.45,46 TP53INP1 was known as a proapoptotic stress-induced gene among the targets of p53. It was also known as a tumor suppressor gene that modulated cellular homeostasis depending on antiproliferative and proapoptotic biological processes, and it could adopt either p53-dependent or p53-independent pathways.47, 48, 49 Gironella et al.50 showed that TP53INP1 expression was repressed by the oncogenic miRNA miR-155, which was overexpressed in pancreatic ductal adenocarcinoma cells. Despite the RB1 and TP53INP1, which were selected for investigation in this study, the other candidate targets, which also showed tumor-related regulatory functions, might have had some comparable effects on ESCC. Other related studies also proposed that the miR-20b-5p had the potency to facilitate cell proliferation and invasive processes via targeting BTG3 under the occurrence of NSCLC, which might contribute to the improvement of patient survival as a therapeutic target for NSCLC treatments in the future.51 Furthermore, inhibition of human metastasis-associated lung adenocarcinoma transcript 1 (MALAT1) could suppress the progression and metastasis of colorectal cancer (CRC) and improve the sensitivity of HCT-116 and HCT-116/5-fluorouracil (5-FU) cancer cells to 5-FU regulation via targeting miR-20b-5p. Based on the aforementioned findings, the present study further clarified a new direction for future investigations on ESCC development, which suggested that the interactions between the target mRNAs and miR-20b-5p could become the clues for novel ESCC diagnostic or treatment methods.52
In summary, for the first time, this study reported valuable evidence that increased miR-20b-5p expressions induced by promoter hypomethylation could modulate ESCC growth and metastasis via targeting RB1 and TP53INP1. Moreover, it was suggested that serum miR-20b-5p might be a clinically significant biomarker, which could be considered as an independent predictor for the OS rates of ESCC. Therefore, the findings in this study indicated that miR-20b-5p is a significant tumorigenic factor in ESCC, which is also a potential prognostic indicator and therapeutic target for ESCC treatments.
Materials and Methods
Sample Collection and Ethics Statement
In the present study, the assembled chip array (containing 93 samples taken from ESCC sites and the ESCC-negative control samples HEso-Squ180Sur-02 and HEso-Squ180Sur-03) was offered by Outdo Biotech (Shanghai, China). The other 92 pairs of frozen paraffin ESCC tissue samples and the matched adjacent noncancerous tissue samples were offered by the North China University of Science and Technology Affiliated People’s Hospital during a period ranging from 2009 to 2013. The serum samples were donated by 102 ESCC patients. In addition, 60 tumor-negative control samples were offered by the above-mentioned hospital. The serum specimens were temporarily kept at 4°C for transition and frozen at −80°C until the experimental section was conducted. This sample collection was initiated after approval was granted by the Ethics Committee of the hospital. Informed consent had been submitted by every participant. The inclusion of each patient specimen was authorized by formal written consent of the individual, while the tissues for experiments were collected as the dissected samples for diagnostic procedures conducted by the pathology department, which were approved to be used for research once the clinical examinations were completed.
Cell Lines and Cell Cultures
In the present study, the seven cell lines of human ESCC, namely TE1, EC109, KYSE30, KYSE150, KYSE180, KYSE450, and KYSE510, were offered by Cell Culture Center, Peking Union Medical College (Beijing, China) and Typical Culture Cell Bank, Chinese Academy of Sciences (Shanghai, China). The human embryonic kidney 293T (HEK293T) cells were offered by ATCC (Manassas, VA, USA). The culture medium for culturing ESCC cells was RPMI 1640, and the medium for HEK293T cells was DMEM supplemented with 10% fetal bovine serum (Gibco-BRL, Grand Island, NY, USA), which were kept in a humidified atmosphere under 5% CO2 and 37°C.
In Situ Hybridization of miR-20b-5p
The miR-20b-5p probe (5′-TACCTGCACTATGAGCACTTTG-3′) was tagged with 3′ and 5′ digoxigenin (DIG) and modified locked nucleic acid (LNA) (Redlandbio.biomart.cn, Guangzhou, China). U6 snRNA (5′-CACGAATTTGCGTGTCATCCTT-3′) and scrambled probes (5′-GTGTAACACGTCTATACGCCCA-3′) were used as positive and negative controls, respectively. The probe-target complex was detected using an anti-DIG-alkaline phosphate conjugate, with nitroblue tetrazolium (NBT) and 5-bromo-4-chloro-3-indolyl phosphate (BCIP) as the chromogen. The blue color of staining was defined as positive expression of miR-20b-5p by in situ hybridization. As for the detection of miR-20b-5p in situ, the specimens were incubated with proteinase K (15 μg/mL) under 37°C for 10 min. The specimens were washed with PBS and dehydrated using sequentially increased concentrations of ethanol. The miR-20b-5p probe was added onto the specimens, and the ensuing incubation was performed under 60°C for 1 h. When incubation ended, the specimens were washed briefly in pre-warmed 5×, 1×, and 0.2× SSC (60°C) in sequence. The primary antibody against DIG was incubated with specimens under room temperature for 60 min, and the substrate NBT/BCIP was added and incubated in dark for about 15 min. Once specific blue signal was observed, KTBT was used to stop further reaction. All procedures were performed under RNase-free conditions. The blue color of staining was defined as positive expression of miR-20b-5p by in situ hybridization. All images were observed and diagnosed by two clinical pathologists independently. At least five random fields of each sample were scanned and evaluated by the pathologists blinded to grouping and clinical features. Samples were classified according to cytoplasmic miR-20b-5p intensity as follows: negative, negative or faint expression in most cells; low expression, low expression in most cells or moderate expression in <50% of the cells; and high expression, moderate to strong expression in most cells.
DNA Extractions and Bisulfite Modifications
The genome DNA extraction for the ESCC cell lines used 14 frozen fresh ESCC samples and the matched noncancerous samples. The extracted DNA samples were purified and modified with bisulfite. The PCR was conducted to amplify miR-20b-5p for detection with the primers as follows: 5′-aggaagagagTGGTGTGAGTAGTTGGAGTATATTTTG-3′ (forward) and 5′-cagtaatacgactcactatagggagaaggctATATTTACCAACCCAACCTA ACCAA-3′ (reverse). The product with confirmed presence of the miRNA was qualified for the subsequent tests. NanoDrop 2000 (Thermo Fisher Scientific, USA) was applied to examine the converted DNA. The PCR amplification was conducted with a TaKaRa rTaq kit (TaKaRa, Dalian, China) in compliance with the manufacturer’s protocol.
Quantitative Analysis on DNA Methylation
The UCSC genome browser (http://genome.ucsc.edu) was the tool for identifying and sequencing the CpG sites. The primer sequences used in the quantitative analysis were set up with EpiDesigner software (http://www.epidesigner.com/start3.html). Then, the reverse primers were tagged with T7 promoters to enable the in vivo transcription, and the forward primers were tagged with 10-mer tags to enable the adjustment of melting temperature. The methylation status was quantified for evaluation with the MassARRAY platform (Agena Bioscience, USA). In addition, the mass spectra data were obtained with MassARRAY compact matrix-assisted laser desorption ionization-time of flight (MALDI-TOF) (Agena Bioscience, USA), while the methylation status of the individual units were evaluated with EpiTYPER 1.0.5 (Agena Bioscience, USA). The sites indicated by the non-applicable data were excluded from the analytical processing. The expression of methylation status adopted the percentage of the methylated cytosines over the total number of readable cytosines.
Steps of the miRNA Transfection Process
The miRNA mimics (50 nmol/L), inhibitors (100 nmol/L), antagomirs, and negative controls were offered by RiboBio (Guangzhou, China). The processing of transfection was set up and conducted in compliance with the manufacturer’s guidelines. Lipofectamine 2000 (Invitrogen, USA) was applied as a transfection agent. At 48 h later, the transfected samples became ready for the following experiments.
Plasmid Construction
In the present study, the pDonR223 plasmids with the human RB1 and TP53INP1 genes were offered by Axybio Bio-Tech (Changsha, China). The intact sequences of the two genes were acquired using pDonR223-RB1 and pDonR223-TP53INP1 plasmids via amplification. XhoI and HindIII were applied to process the RB1 and TP53INP1 products as well as the pEGFP-N1 plasmids, and the resultant fragments underwent purification and ligation with T4 DNA ligase. The ligated products were transformed into TOP10 competent cells, and the positive clones were named pEGFP-N1-RB1 and pEGFP-N1-TP53INP1, respectively.
Quantitative Real-Time PCRs
The total RNA extracts were processed with the reverse transcription (RT) reactions to enable the subsequent quantitative polymerase chain reaction (qRT-PCR), which worked with the StepOnePlus real-time system (Applied Biosystems, USA). In the present study, the internal controls included GAPDH and U6. miRNAs were detected with stem-loop primers purchased from RiboBio (China) as described. GAPDH and U6 small nucleolar RNA were used for normalization. qPCR was conducted using a QuantiTect SYBR Green PCR kit (TaKaRa Bio, Japan) on a StepOne real-time PCR system (Applied Biosystems, USA). Relative expression levels were calculated using the 2−ΔΔCt method (Bio-Rad CFX manager software 3.1). All of the primers are listed in Table S1.
Predictions of the Targets and Luciferase Reporter Assays
In the present study, the bioinformatics tools were applied as follows: miRWalk, miRDB, and miRTarBase. The 3′ UTRs of RB1 and TP53INP1 were obtained with the amplifying processes performed on the human genomic DNA. The transcripts were respectively integrated into the pmiR-RB-REPORT (RiboBio, Guangzhou, China) at XhoI and NotI. According to the same procedures, the RB1 fragments and TP53INP1 3′ UTR mutants were integrated into the pmiR-RB-REPORT control vector at XhoI and NotI. Referring to the reporter assays, the wild-type reporter plasmid and miR-20b-5p mimics were accessed into ESCC cells via co-transfection. The determination of firefly and Renilla luciferase activities was conducted on cell lysates with a dual-luciferase reporter assay system. The measurement was started at 48 h post-transfection following the default protocol. The luciferase unit of firefly was normalized on the Renilla value to calibrate the transfection efficiency process.
In Vitro Cell Proliferation Assays
The cells at a density of 5 × 10³ per well were seeded using a 96-well standard plate, and then the 3-(4,5-dimethylthiazol-2-yl)-5-(3-carboxymethoxyphenyl)-2-(4-sulfophenyl)-2H-tetrazolium (MTS) method was adopted in compliance with the standard procedures. 20 μL of MTS solution was applied into each sample. The plate was incubated at 37°C for 2 h. The optical densities were immediately examined at 570 nm with a microplate reader (Bio-Rad, Hercules, CA, USA).
Colony Formation Assay
The transfection upon ESCC cells used one of the miR-20b-5p mimics, that is, miR-mimic negative control, miR-20b-5p inhibitor, or miR-inhibitor negative control. Then, following a 24-h waiting period, the transfected samples were processed with trypsin, counted, and cultured onto new dishes at 1 × 10³ cells/dish. After 10 days, the colonies were fixed with 3.7% methanol, followed by staining with 0.1% crystal violet. On each plate, the colonies with at least 50 cells were scored. This section was repeated independently three times.
Transwell Migration/Invasion Assay
The protocol of setting transwell chambers (8-μm pore size; Costar) complied with the standard setting offered by the manufacturer. The cell cultures grew to a subconfluency of approximately 75%–80% and were then serum starved for a 24-h period. Following detachment by the addition of trypsin, PBS was used to wash the harvested cells, which were subsequently resuspended into the fresh culture medium without any serum. 100 μL of cell suspension at the approximate density of 5 × 10⁴ cells/mL was filled into the upper chamber. At that point, the medium was filled into the bottom wells of the chambers. At 24 h later, the cells that failed to migrate were cleaned away from the upper side of the filters with cotton swabs. The cells with positive migration were fixed with a 5% glutaraldehyde solution for counting. 0.25% trypan blue was applied to stain the lower surfaces of the filters. 6 images of ×10 fields were randomly selected for each membrane to count the migratory cells. Overall, the resulting data were calculated from three independent experiments. At the end of this section, the invasive potentials were measured by inserts of Matrigel coating.
Western Blotting
Radioimmunoprecipitation assay (RIPA) buffer was the reagent for extracting whole-cell lysates. A brief summary of the procedure follows. The lysate samples were processed with SDS-PAGE for separation, followed by transferring onto polyvinylidene fluoride (PVDF) membranes. 5% bovine serum albumin was applied to the membranes for blocking. The primary antibodies included anti-RB1, anti-TP53INP1, and anti-GAPDH (ab181616, ab202026, and ab8245; Abcam, Cambridge, UK); subsequently, the membranes were treated with goat anti-mouse immunoglobulin G (IgG) (1:2,000) or goat anti-rabbit IgG (1:3,000) secondary antibodies. Finally, the resultant patterns were detected with Image Reader LAS-4000 (Fujifilm, Japan) followed by interpretation using Multi Gauge v3.2 software.
Knockdown of the siRNAs
The siRNAs for the RB1 (5′-GAACGATTATCCATTCAAA-3′) and TP53INP1 (5′-GCAGGTGGATTAACCACTA-3′) were produced by RiboBio (Guangzhou, China). Following the manufacturer’s manual, the siRNAs were transfected into the examined cells at the assigned concentrations using Lipofectamine RNAiMAX (Invitrogen) to achieve the concurrent inhibition of the targeted genes, respectively.
Acquisition of Stable Cell Lines
The lentiviral vectors were offered by XIEBHC Biotechnology (Beijing, China). A luciferase and puromycin reporter gene driven by the EF1α promoter was also introduced to signify the efficacy of the infection process in a timely manner. In addition, for the purpose of constructing the required lentiviral vectors, the miR-20b-5p precursor sequences, as well as the NC, were integrated into the pHBLV-U6-MCS and EF1α-Luc-T2A-puromycin lentiviral vectors. Then, the lentiviruses were assembled through co-transfecting the HEK293T cells with pSPAX2 and pMD2.G by LipoFiter reagent. The supernatants were ready for collection at 48 and 72 h later, respectively, and subsequently processed with 0.45-μm cellulose acetate filters (Millipore, USA). A step of ultracentrifugation was applied to the lentiviruses to increase the concentration. Then, the examined ESCC cells were transduced with lentivirus of an MOI of 5 based on the addition of 5 μg/mL polybrene. At 24 h later, the supernatant was discarded, followed by the addition of fresh medium. After a 96-h incubation, the infection efficiency was examined with RT-PCR, and the samples were treated with 2 μg/mL puromycin for 14 days to complete the selection.
Tumorigenicity and Metastasis Assay In Vivo
All of the experimental animals were handled with humane care, which conformed to the recommendations of the Guide for the Care and Use of Laboratory Animals released by the National Institutes of Health. The design of animal testing was also in accordance with the Animal Experiment Guidelines of the Biomedical Research Institute. For the subcutaneous model, the BALB/c nude mice aged 4–6 weeks received subcutaneous injection at the right hip with 1 × 10⁶ transfected cells. For the metastasis model, 1 × 10⁶ transfected cells were injected into the tail veins of the mice. Five weeks later, subcutaneous tumor colonies were evaluated with H&E stain and histological examinations. Bioluminescence images were also visualized to observe the growth and metastasis of the implanted cells. The mice were anesthetized with isoflurane, and D-luciferin solution (in vivo imaging solutions [PerkinElmer], 150 mg/kg in PBS) was injected intravenously for the systemic xenografts. The images were detected by an IVIS Spectrum imaging system (PerkinElmer) at 2–5 min after the injections, and the captured images were interpreted with a Living Image software package (PerkinElmer, Caliper Life Sciences), by which the photon flux (photons/s/cm2/steradian) within the regions of interest (ROIs) drawn around the bioluminescence signals were measured.
Antagomir Treatments
The antagomir and miRNA antagomir negative control (RiboBio, Guangzhou, China) were implemented in accordance with the standardized procedures. Also, miR-20b-5p antagomir (10 nmol in 0.1 mL of saline buffer), as well as the same amount of miRNA negative control, was locally injected into the tumor masses once every 5 days during the 5-week period. When the treatment processes were completed, the tumors were sampled for immunohistochemistry (IHC) assays. The tumor sizes were monitored by recording the length (L) and width (W) every 5 days, and the volumes were calculated as (L × W2)/2. The mice were sacrificed by cervical dislocation on day 32, and the tumors were dissected and frozen until the subsequent experimental sections.
Evaluations of the Immunohistochemical Staining Results
After cleaning with paraffin, the sections underwent boiling in 10 mM citrate buffer (pH 6.0) for antigen retrieval. 3% H2O2 was added to deactivate peroxidase. The slides were then processed with serum blocking, overnight incubation in the solution of assigned antibodies at 4°C, and incubation with anti-rabbit and diaminobenzidine (Sigma) for visualization. Meanwhile, the equivalent experiment with negative control was independently conducted. The IHC staining was read under light microscopy (Olympus). RB1 and TP53INP1 expression was scored semiquantitatively according to the percentage of positive cells and cytoplasmic/nuclear staining intensity. The results were assessed by two investigators independently. The percentage of positively stained cells was as follows: 0 (<5% positive cells), 1 (6%–25% positive cells), 2 (26%–50% positive cells), 3 (51%–75% positive cells), or 4 (>75% positive cells). The cytoplasmic/nuclear staining intensity was categorized as follows: 0 score, negative; 1 score, buff; 2 score, yellow; and 3 score, brown. Optimal cutoff values for this assessment system were identified as follows: high expression of RB1 and TP53INP1 was defined as an expression index score of 5, while low expression was defined as an expression index score of <5.
Statistical Analysis
All data are shown as mean ± SD. A Student’s t test, χ2 test, and ANOVA were conducted. The log rank test was conducted for the effects of the clinical variables and miRNAs on patients’ OS. The Cox regression model was established for the effects of the related factors on the ESCC survival rates. The ROC curves were established to verify the feasibility of serum miRNA as a diagnostic indicator. The methylation data of each CpG unit of the miR-20b-5p from 14 pairs of ESCC tissue samples were interpreted with stratified cluster analysis, which incorporated Cluster 3.0 and TreeView software. The Wilcoxon test was also used in order to compare the miR-20b-5p expressions between the ESCC tissue samples and the control esophageal tissue samples. The relative expression values were calculated using the 2−ΔΔCt method (Bio-Rad CFX manager software 3.1). Based on the 2−ΔΔCt method, ΔΔCt = ΔCt − average (Avg), where ΔCt = (Ct miR-20b-5p − Ct U6) − Avg(Ct miR-20b-5p − Ct U6). It was determined that p <0.05 validated positive significance. The statistical analysis utilized SPSS 16.0 software (SPSS, USA).
Author Contributions
J.Y. and S.C. contributed to analysis and interpretation of data and drafting of the manuscript. Y.N., M.L., and J.Z. contributed to acquisition of data and technical support and revised the manuscript for important intellectual content. J.Z., P.G., and W.W performed arrays and some experiments and contributed to technical support. J.Y., S.C., and M.L. contributed to analysis and interpretation of data. X.H. and G.S. contributed to study concept and design, analysis and interpretation of data, and drafting of the manuscript. All authors read and approved the final manuscript.
Conflicts of Interest
The authors declare no competing interests.
Acknowledgments
This work was supported by the Young Top-Notch Talent Project of Hebei Province (no. JI2016(10), http://www.hebgcdy.com/); the Talent Project of Hebei Province (A201801005, https://rst.hebei.gov.cn/index.html); the Academician Workstation Construction Special Project of Tangshan People’s Hospital (199A77119H, https://kjt.hebei.gov.cn/www/index_ssl/index.html); the Natural Science Foundation of Outstanding Youth of Hebei Province (H2019105026, https://kjt.hebei.gov.cn/www/index_ssl/index.html); and the Basic Research Cooperation Project of Beijing-Tianjin-Hebei (H2019105143,19JCZDJC64500(Z), https://kjt.hebei.gov.cn/www/index_ssl/index.html).
Footnotes
Supplemental Information can be found online at https://doi.org/10.1016/j.omtn.2020.05.015.
Contributor Information
Xiaochen Han, Email: 18931521050@163.com.
Guogui Sun, Email: guogui_sun2013@163.com.
Supplemental Information
References
- 1.Fitzmaurice C., Dicker D., Pain A., Hamavid H., Moradi-Lakeh M., MacIntyre M.F., Allen C., Hansen G., Woodbrook R., Wolfe C., Global Burden of Disease Cancer Collaboration The global burden of cancer 2013. JAMA Oncol. 2015;1:505–527. doi: 10.1001/jamaoncol.2015.0735. [DOI] [PMC free article] [PubMed] [Google Scholar]
- 2.Jemal A., Bray F., Center M.M., Ferlay J., Ward E., Forman D. Global cancer statistics. CA Cancer J. Clin. 2011;61:69–90. doi: 10.3322/caac.20107. [DOI] [PubMed] [Google Scholar]
- 3.Chen W., Zheng R., Baade P.D., Zhang S., Zeng H., Bray F., Jemal A., Yu X.Q., He J. Cancer statistics in China, 2015. CA Cancer J. Clin. 2016;66:115–132. doi: 10.3322/caac.21338. [DOI] [PubMed] [Google Scholar]
- 4.Song Y., Li L., Ou Y., Gao Z., Li E., Li X., Zhang W., Wang J., Xu L., Zhou Y. Identification of genomic alterations in oesophageal squamous cell cancer. Nature. 2014;509:91–95. doi: 10.1038/nature13176. [DOI] [PubMed] [Google Scholar]
- 5.Pennathur A., Gibson M.K., Jobe B.A., Luketich J.D. Oesophageal carcinoma. Lancet. 2013;381:400–412. doi: 10.1016/S0140-6736(12)60643-6. [DOI] [PubMed] [Google Scholar]
- 6.Talukdar F.R., di Pietro M., Secrier M., Moehler M., Goepfert K., Lima S.S.C., Pinto L.F.R., Hendricks D., Parker M.I., Herceg Z. Molecular landscape of esophageal cancer: implications for early detection and personalized therapy. Ann. N Y Acad. Sci. 2018;1434:342–359. doi: 10.1111/nyas.13876. [DOI] [PubMed] [Google Scholar]
- 7.Chen W., Li Y., Yuan D., Peng Y., Qin J. Practical value of identifying circulating tumor cells to evaluate esophageal squamous cell carcinoma staging and treatment efficacy. Thorac. Cancer. 2018;9:956–966. doi: 10.1111/1759-7714.12771. [DOI] [PMC free article] [PubMed] [Google Scholar]
- 8.Dragomir M., Mafra A.C.P., Dias S.M.G., Vasilescu C., Calin G.A. Using microRNA networks to understand cancer. Int. J. Mol. Sci. 2018;19:E1871. doi: 10.3390/ijms19071871. [DOI] [PMC free article] [PubMed] [Google Scholar]
- 9.Liu H., Lei C., He Q., Pan Z., Xiao D., Tao Y. Nuclear functions of mammalian microRNAs in gene regulation, immunity and cancer. Mol. Cancer. 2018;17:64. doi: 10.1186/s12943-018-0765-5. [DOI] [PMC free article] [PubMed] [Google Scholar]
- 10.Li X., Kleeman S., Coburn S.B., Fumagalli C., Perner J., Jammula S., Pfeiffer R.M., Orzolek L., Hao H., Taylor P.R. Selection and application of tissue microRNAs for nonendoscopic diagnosis of Barrett’s esophagus. Gastroenterology. 2018;155:771–783.e3. doi: 10.1053/j.gastro.2018.05.050. [DOI] [PMC free article] [PubMed] [Google Scholar]
- 11.Mari L., Hoefnagel S.J.M., Zito D., van de Meent M., van Endert P., Calpe S., Sancho Serra M.D.C., Heemskerk M.H.M., van Laarhoven H.W.M., Hulshof M.C.C.M. MicroRNA 125a regulates MHC-I expression on esophageal adenocarcinoma cells, associated with suppression of antitumor immune response and poor outcomes of patients. Gastroenterology. 2018;155:784–798. doi: 10.1053/j.gastro.2018.06.030. [DOI] [PubMed] [Google Scholar]
- 12.Bandi N., Zbinden S., Gugger M., Arnold M., Kocher V., Hasan L., Kappeler A., Brunner T., Vassella E. miR-15a and miR-16 are implicated in cell cycle regulation in a Rb-dependent manner and are frequently deleted or down-regulated in non-small cell lung cancer. Cancer Res. 2009;69:5553–5559. doi: 10.1158/0008-5472.CAN-08-4277. [DOI] [PubMed] [Google Scholar]
- 13.Yanaihara N., Caplen N., Bowman E., Seike M., Kumamoto K., Yi M., Stephens R.M., Okamoto A., Yokota J., Tanaka T. Unique microRNA molecular profiles in lung cancer diagnosis and prognosis. Cancer Cell. 2006;9:189–198. doi: 10.1016/j.ccr.2006.01.025. [DOI] [PubMed] [Google Scholar]
- 14.Liu B., Qu J., Xu F., Guo Y., Wang Y., Yu H., Qian B. miR-195 suppresses non-small cell lung cancer by targeting CHEK1. Oncotarget. 2015;6:9445–9456. doi: 10.18632/oncotarget.3255. [DOI] [PMC free article] [PubMed] [Google Scholar]
- 15.Ambros V. The functions of animal microRNAs. Nature. 2004;431:350–355. doi: 10.1038/nature02871. [DOI] [PubMed] [Google Scholar]
- 16.Valeri N., Braconi C., Gasparini P., Murgia C., Lampis A., Paulus-Hock V., Hart J.R., Ueno L., Grivennikov S.I., Lovat F. MicroRNA-135b promotes cancer progression by acting as a downstream effector of oncogenic pathways in colon cancer. Cancer Cell. 2014;25:469–483. doi: 10.1016/j.ccr.2014.03.006. [DOI] [PMC free article] [PubMed] [Google Scholar]
- 17.Huang Z., Zhang L., Zhu D., Shan X., Zhou X., Qi L.W., Wu L., Zhu J., Cheng W., Zhang H. A novel serum microRNA signature to screen esophageal squamous cell carcinoma. Cancer Med. 2017;6:109–119. doi: 10.1002/cam4.973. [DOI] [PMC free article] [PubMed] [Google Scholar]
- 18.Ahmad A., Ginnebaugh K.R., Sethi S., Chen W., Ali R., Mittal S., Sarkar F.H. miR-20b is up-regulated in brain metastases from primary breast cancers. Oncotarget. 2015;6:12188–12195. doi: 10.18632/oncotarget.3664. [DOI] [PMC free article] [PubMed] [Google Scholar]
- 19.Harada K., Baba Y., Ishimoto T., Shigaki H., Kosumi K., Yoshida N., Watanabe M., Baba H. The role of microRNA in esophageal squamous cell carcinoma. J. Gastroenterol. 2016;51:520–530. doi: 10.1007/s00535-016-1161-9. [DOI] [PubMed] [Google Scholar]
- 20.Dykxhoorn D.M. MicroRNAs and metastasis: little RNAs go a long way. Cancer Res. 2010;70:6401–6406. doi: 10.1158/0008-5472.CAN-10-1346. [DOI] [PMC free article] [PubMed] [Google Scholar]
- 21.Song J.H., Meltzer S.J. MicroRNAs in pathogenesis, diagnosis, and treatment of gastroesophageal cancers. Gastroenterology. 2012;143:35–47.e2. doi: 10.1053/j.gastro.2012.05.003. [DOI] [PubMed] [Google Scholar]
- 22.Liu A., Zhu J., Wu G., Cao L., Tan Z., Zhang S., Jiang L., Wu J., Li M., Song L., Li J. Antagonizing miR-455-3p inhibits chemoresistance and aggressiveness in esophageal squamous cell carcinoma. Mol. Cancer. 2017;16:106. doi: 10.1186/s12943-017-0669-9. [DOI] [PMC free article] [PubMed] [Google Scholar]
- 23.Shi Q., Wang Y., Mu Y., Wang X., Fan Q. miR-433-3p inhibits proliferation and invasion of esophageal squamous cell carcinoma by targeting GRB2. Cell. Physiol. Biochem. 2018;46:2187–2196. doi: 10.1159/000489548. [DOI] [PubMed] [Google Scholar]
- 24.Gong H., Song L., Lin C., Liu A., Lin X., Wu J., Li M., Li J. Downregulation of miR-138 sustains NF-κB activation and promotes lipid raft formation in esophageal squamous cell carcinoma. Clin. Cancer Res. 2013;19:1083–1093. doi: 10.1158/1078-0432.CCR-12-3169. [DOI] [PubMed] [Google Scholar]
- 25.Hamano R., Miyata H., Yamasaki M., Kurokawa Y., Hara J., Moon J.H., Nakajima K., Takiguchi S., Fujiwara Y., Mori M., Doki Y. Overexpression of miR-200c induces chemoresistance in esophageal cancers mediated through activation of the Akt signaling pathway. Clin. Cancer Res. 2011;17:3029–3038. doi: 10.1158/1078-0432.CCR-10-2532. [DOI] [PubMed] [Google Scholar]
- 26.Akanuma N., Hoshino I., Akutsu Y., Murakami K., Isozaki Y., Maruyama T., Yusup G., Qin W., Toyozumi T., Takahashi M. MicroRNA-133a regulates the mRNAs of two invadopodia-related proteins, FSCN1 and MMP14, in esophageal cancer. Br. J. Cancer. 2014;110:189–198. doi: 10.1038/bjc.2013.676. [DOI] [PMC free article] [PubMed] [Google Scholar]
- 27.Li Y., Zhang H., Gong H., Yuan Y., Li Y., Wang C., Li W., Zhang Z., Liu M., Liu H., Chen J. miR-182 suppresses invadopodia formation and metastasis in non-small cell lung cancer by targeting cortactin gene. J. Exp. Clin. Cancer Res. 2018;37:141. doi: 10.1186/s13046-018-0824-1. [DOI] [PMC free article] [PubMed] [Google Scholar]
- 28.Yu T., Liu L., Li J., Yan M., Lin H., Liu Y., Chu D., Tu H., Gu A., Yao M. miRNA-10a is upregulated in NSCLC and may promote cancer by targeting PTEN. Oncotarget. 2015;6:30239–30250. doi: 10.18632/oncotarget.4972. [DOI] [PMC free article] [PubMed] [Google Scholar]
- 29.Li Y., Chen P., Zu L., Liu B., Wang M., Zhou Q. MicroRNA-338-3p suppresses metastasis of lung cancer cells by targeting the EMT regulator Sox4. Am. J. Cancer Res. 2016;6:127–140. [PMC free article] [PubMed] [Google Scholar]
- 30.Wu X., Liu T., Fang O., Dong W., Zhang F., Leach L., Hu X., Luo Z. MicroRNA-708-5p acts as a therapeutic agent against metastatic lung cancer. Oncotarget. 2016;7:2417–2432. doi: 10.18632/oncotarget.6594. [DOI] [PMC free article] [PubMed] [Google Scholar]
- 31.Ramalho-Carvalho J., Graça I., Gomez A., Oliveira J., Henrique R., Esteller M., Jerónimo C. Downregulation of miR-130b∼301b cluster is mediated by aberrant promoter methylation and impairs cellular senescence in prostate cancer. J. Hematol. Oncol. 2017;10:43. doi: 10.1186/s13045-017-0415-1. [DOI] [PMC free article] [PubMed] [Google Scholar]
- 32.Torres-Ferreira J., Ramalho-Carvalho J., Gomez A., Menezes F.D., Freitas R., Oliveira J., Antunes L., Bento M.J., Esteller M., Henrique R., Jerónimo C. miR-193b promoter methylation accurately detects prostate cancer in urine sediments and miR-34b/c or miR-129-2 promoter methylation define subsets of clinically aggressive tumors. Mol. Cancer. 2017;16:26. doi: 10.1186/s12943-017-0604-0. [DOI] [PMC free article] [PubMed] [Google Scholar]
- 33.Ramalho-Carvalho J., Martins J.B., Cekaite L., Sveen A., Torres-Ferreira J., Graça I., Costa-Pinheiro P., Eilertsen I.A., Antunes L., Oliveira J. Epigenetic disruption of miR-130a promotes prostate cancer by targeting SEC23B and DEPDC1. Cancer Lett. 2017;385:150–159. doi: 10.1016/j.canlet.2016.10.028. [DOI] [PubMed] [Google Scholar]
- 34.Hou Y.Y., You J.J., Yang C.M., Pan H.W., Chen H.C., Lee J.H., Lin Y.S., Liou H.H., Liu P.F., Chi C.C. Aberrant DNA hypomethylation of miR-196b contributes to migration and invasion of oral cancer. Oncol. Lett. 2016;11:4013–4021. doi: 10.3892/ol.2016.4491. [DOI] [PMC free article] [PubMed] [Google Scholar]
- 35.Zhu X.W., Yao D.M., Wu D.H., Wen X.M., Yang J., Guo H., Yang L., Deng Z.Q., Zhang Y.Y., Qian W. Let-7a-3 hypomethylation is associated with favorable/intermediate karyotypes but not with survival in acute myeloid leukemia. Tumour Biol. 2016;37:491–501. doi: 10.1007/s13277-015-3734-2. [DOI] [PubMed] [Google Scholar]
- 36.Yuan R., Zhi Q., Zhao H., Han Y., Gao L., Wang B., Kou Z., Guo Z., He S., Xue X., Hu H. Upregulated expression of miR-106a by DNA hypomethylation plays an oncogenic role in hepatocellular carcinoma. Tumour Biol. 2015;36:3093–3100. doi: 10.1007/s13277-014-2945-2. [DOI] [PubMed] [Google Scholar]
- 37.Wang X., Gao H., Ren L., Gu J., Zhang Y., Zhang Y. Demethylation of the miR-146a promoter by 5-Aza-2′-deoxycytidine correlates with delayed progression of castration-resistant prostate cancer. BMC Cancer. 2014;14:308. doi: 10.1186/1471-2407-14-308. [DOI] [PMC free article] [PubMed] [Google Scholar]
- 38.Papageorgiou S.G., Kontos C.K., Tsiakanikas P., Stavroulaki G., Bouchla A., Vasilatou D., Bazani E., Lazarakou A., Scorilas A., Pappa V. Elevated miR-20b-5p expression in peripheral blood mononuclear cells: a novel, independent molecular biomarker of favorable prognosis in chronic lymphocytic leukemia. Leuk. Res. 2018;70:1–7. doi: 10.1016/j.leukres.2018.04.014. [DOI] [PubMed] [Google Scholar]
- 39.Zhu H., Jin Y.M., Lyu X.M., Fan L.M., Wu F. Long noncoding RNA H19 regulates HIF-1α/AXL signaling through inhibiting miR-20b-5p in endometrial cancer. Cell Cycle. 2019;18:2454–2464. doi: 10.1080/15384101.2019.1648958. [DOI] [PMC free article] [PubMed] [Google Scholar] [Retracted]
- 40.Tanzer A., Stadler P.F. Molecular evolution of a microRNA cluster. J. Mol. Biol. 2004;339:327–335. doi: 10.1016/j.jmb.2004.03.065. [DOI] [PubMed] [Google Scholar]
- 41.Landais S., Landry S., Legault P., Rassart E. Oncogenic potential of the miR-106-363 cluster and its implication in human T-cell leukemia. Cancer Res. 2007;67:5699–5707. doi: 10.1158/0008-5472.CAN-06-4478. [DOI] [PubMed] [Google Scholar]
- 42.Zhu J., Chen L., Zou L., Yang P., Wu R., Mao Y., Zhou H., Li R., Wang K., Wang W. miR-20b, -21, and -130b inhibit PTEN expression resulting in B7-H1 over-expression in advanced colorectal cancer. Hum. Immunol. 2014;75:348–353. doi: 10.1016/j.humimm.2014.01.006. [DOI] [PubMed] [Google Scholar]
- 43.Simpson D.S., Mason-Richie N.A., Gettler C.A., Wikenheiser-Brokamp K.A. Retinoblastoma family proteins have distinct functions in pulmonary epithelial cells in vivo critical for suppressing cell growth and tumorigenesis. Cancer Res. 2009;69:8733–8741. doi: 10.1158/0008-5472.CAN-09-1359. [DOI] [PMC free article] [PubMed] [Google Scholar]
- 44.Di Fiore R., D’Anneo A., Tesoriere G., Vento R. RB1 in cancer: different mechanisms of RB1 inactivation and alterations of pRb pathway in tumorigenesis. J. Cell. Physiol. 2013;228:1676–1687. doi: 10.1002/jcp.24329. [DOI] [PubMed] [Google Scholar]
- 45.Johnson J., Thijssen B., McDermott U., Garnett M., Wessels L.F.A., Bernards R. Targeting the RB-E2F pathway in breast cancer. Oncogene. 2016;35:4829–4835. doi: 10.1038/onc.2016.32. [DOI] [PMC free article] [PubMed] [Google Scholar]
- 46.Liu F., Cai Y., Rong X., Chen J., Zheng D., Chen L., Zhang J., Luo R., Zhao P., Ruan J. miR-661 promotes tumor invasion and metastasis by directly inhibiting RB1 in non small cell lung cancer. Mol. Cancer. 2017;16:122. doi: 10.1186/s12943-017-0698-4. [DOI] [PMC free article] [PubMed] [Google Scholar]
- 47.Okamura S., Arakawa H., Tanaka T., Nakanishi H., Ng C.C., Taya Y., Monden M., Nakamura Y. p53DINP1, a p53-inducible gene, regulates p53-dependent apoptosis. Mol. Cell. 2001;8:85–94. doi: 10.1016/s1097-2765(01)00284-2. [DOI] [PubMed] [Google Scholar]
- 48.Tomasini R., Samir A.A., Pebusque M.J., Calvo E.L., Totaro S., Dagorn J.C., Dusetti N.J., Iovanna J.L. p53-dependent expression of the stress-induced protein (SIP) Eur. J. Cell Biol. 2002;81:294–301. doi: 10.1078/0171-9335-00248. [DOI] [PubMed] [Google Scholar]
- 49.Tomasini R., Seux M., Nowak J., Bontemps C., Carrier A., Dagorn J.C., Pébusque M.J., Iovanna J.L., Dusetti N.J. TP53INP1 is a novel p73 target gene that induces cell cycle arrest and cell death by modulating p73 transcriptional activity. Oncogene. 2005;24:8093–8104. doi: 10.1038/sj.onc.1208951. [DOI] [PubMed] [Google Scholar]
- 50.Gironella M., Seux M., Xie M.J., Cano C., Tomasini R., Gommeaux J., Garcia S., Nowak J., Yeung M.L., Jeang K.T. Tumor protein 53-induced nuclear protein 1 expression is repressed by miR-155, and its restoration inhibits pancreatic tumor development. Proc. Natl. Acad. Sci. USA. 2007;104:16170–16175. doi: 10.1073/pnas.0703942104. [DOI] [PMC free article] [PubMed] [Google Scholar]
- 51.Peng L., Li S., Li Y., Wan M., Fang X., Zhao Y., Zuo W., Long D., Xuan Y. Regulation of BTG3 by microRNA-20b-5p in non-small cell lung cancer. Oncol. Lett. 2019;18:137–144. doi: 10.3892/ol.2019.10333. [DOI] [PMC free article] [PubMed] [Google Scholar]
- 52.Tang D., Yang Z., Long F., Luo L., Yang B., Zhu R., Sang X., Cao G. Inhibition of MALAT1 reduces tumor growth and metastasis and promotes drug sensitivity in colorectal cancer. Cell. Signal. 2019;57:21–28. doi: 10.1016/j.cellsig.2019.01.013. [DOI] [PubMed] [Google Scholar]
Associated Data
This section collects any data citations, data availability statements, or supplementary materials included in this article.