

Abstract
Microglia, the resident immune cells of the brain, can exhibit a broad range of activation phenotypes, many of which have been implicated in several diseases and disorders of the central nervous system including those related to alcohol abuse. Given the complexity of global-scale molecular changes that define microglial activation, accurate phenotypic classification in the context of alcohol exposure is still lacking. We employed an optimized method for deep, quantitative proteome profiling of primary microglia in order to characterize their response to acute exposure to alcohol (ethanol) as well as the pro-inflammatory driver and TLR4 agonist, LPS. From this analysis, 5,062 total proteins were identified where 4,857 and 4,928 of those proteins were quantifiable by label-free quantitation in ethanol and LPS treatment groups, respectively. This study highlights the subtle, yet significant proteomic changes that occur in ethanol-treated microglia, which do not align with the robust pro-inflammatory phenotype induced by TLR4 activation. Specifically, our results indicate inhibition of several upstream regulators associated with inflammation, opposing effects on pathways such as phagocytosis upon comparison to TLR4-mediated pro-inflammatory phenotype, and a potential metabolic shift associated with increased expression of proteins related to OXPHOS and lipid homeostasis. Data are available via ProteomeXchange with identifier PXD14466.
Keywords: Alcohol, Proteomics, Microglia, LPS, Neuroinflammation, Neuroimmune
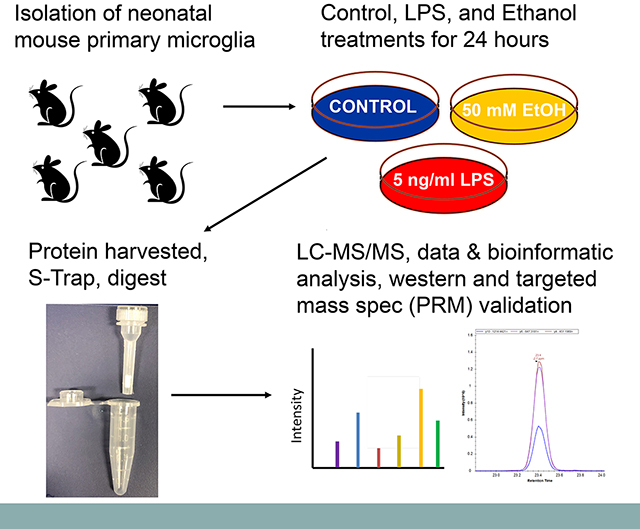
Graphical Abstract
1. Introduction
Alcohol abuse, including heavy binge and chronic drinking, has been associated with numerous detrimental effects on human health with neurological damage being among the common consequences. The effect of ethanol on the CNS is of great significance, as ethanol is known to cause substantial CNS dysfunction when abused, with glial cell activation implicated as a major mechanism underlying ethanol-induced neuronal damage [1]. In particular, microglia, the resident immune cells of the brain, have been implicated in numerous neurological disorders including pathophysiological outcomes associated with neuroinflammation due to their activation from chronic alcohol abuse [2, 3]. Pro-inflammatory activation of microglia through chronic ethanol exposure has been reported, which is characterized by increased production of several pro-inflammatory cytokines and chemokines, morphological changes consistent with pro-inflammatory activation, as well as increases in other inflammatory markers like NFκB-p65 and iNOS, reviewed in [1]. Recent studies, however, suggest microglia have a wide range of activation phenotypes and that these variations may result in a range of phenotypes from protective to damaging [4–6].
Previous evidence suggests that this broader range of microglial activation phenotypes, induced by short-term exposure to ethanol, can actually suppress the innate immune response or exhibit unique molecular profiles indicating an activation phenotype that does not align with inflammation [4, 7, 8]. Our previous studies aimed to characterize the microglial proteome within the context of these varied physiological changes; we have determined several specific protein markers and pathways critical for ethanol-induced microglial activation in an acute exposure model [9, 10]. By comparing the activation phenotype of a rat microglial cell line in response to LPS, a well-characterized pro-inflammatory stimulus, with the activation response from acute exposure to ethanol, we observed no direct evidence of a pro-inflammatory posture (devoid of iNOS and pro-inflammatory markers) [10]. However, upon acute administration of ethanol, we found that microglia were characterized by an activation phenotype represented by increased production of cell adhesion/migration markers after 12 hours post-exposure [9, 10]. This particular activation phenotype was also similarly characterized in an independent study utilizing a 4-day alcohol binge model; here they reported a lack of OX-6 and ED-1 immunoreactive microglia and no evidence of pro-inflammatory cytokine production [4]. These studies suggest ethanol-induced neuroinflammation may not be initiated by ethanol acting on microglia directly, but rather other factors may be the cause (e.g., ethanol-induced neuronal injury and subsequent release of factors into the environment). The broad range of ethanol-induced microglial activation phenotypes has yet to be fully elucidated and may provide critical information as to the full role microglia play in CNS dysfunction arising from chronic alcohol abuse.
The complexity of these pathways has opened up a new series of questions regarding directionality of activation and the full roles glial cells play in ethanol-induced neuronal injury. This study seeks to further elucidate the role of microglia within the context of ethanol by utilizing a non-biased proteomic approach to characterize primary mouse microglial cells after 24 hours following ethanol administration. We further characterized LPS-induced activation phenotype through deep proteome sequencing in order to bioinformatically compare this particular pro-inflammatory phenotype to ethanol-treated microglial proteome profiles. The use of LPS-treated microglia for comparison is also justified based on previous studies that show interaction and modulation of TLR4 signaling by ethanol [11, 12]. The improved sample processing and data acquisition methods previously described have been implemented in order to obtain deep proteome coverage with high quantitation precision for ethanol-treated primary mouse microglia [13]. In addition to rigorous statistical filtering, several differentially expressed proteins identified from proteomic analysis were validated via western blot analysis as well as parallel reaction monitoring (PRM). This approach has also allowed for the identification of low-abundant proteins relevant to microglial function (e.g., transcription factors, chemokines/cytokines, etc.) as well as the detection of novel differentially expressed proteins from ethanol and LPS-treated microglia, providing detailed mechanistic insight into how these molecular species drive microglial phenotypic changes.
2. Materials and methods
2.1. Experimental design and statistical rationale
Neonatal mouse primary microglia were utilized in this study in order to accurately characterize phenotypic changes by mass spectrometry-based proteomics in a more physiologically relevant biological system (compared to microglial cell lines such as mouse BV2 or rat HAPI cells). We have recently published our optimized approach for protein processing and mass spectrometry analysis of mouse microglial cells, which showed excellent label-free quantitation precision (6.7% median CV) for 300K microglial cells (n=3 biological replicates, n=2 technical replicates) with a depth of coverage of approximately 5,000 proteins [13]. In order to determine expression changes of 1.25-fold or higher at an average quantitation precision of CV=10%, n=5 replicates per group would be needed at alpha=0.05 and to achieve a power of at least 0.90 (with assumption of similar biological variability). Our study does not employ a conventional multiple testing approach to control FDR (e.g., Bonferroni or Benjamini-Hochberg procedures) because of the tendency to decrease sensitivity; however, we utilize a filtering approach that combines Welch’s t-test and z-score values (p<0.05 and |z-score|>1), which has been shown to adequately control FDR while maintaining high sensitivity for proteomic label-free quantitation [14].
In terms of treatment dose, 5ng/mL of LPS was used, which induces a robust pro-inflammatory response in primary microglia without introducing cytotoxic effects that can be observed at higher doses [15, 16]. The ethanol concentration utilized (50 mM) represents a relevant blood alcohol concentration that can be observed in chronic alcoholics or severe, acute exposure cases in humans [17, 18]. Ethanol concentration was not regulated in this model (i.e., maintaining same concentration over 24 h), in order to mimic the initial BAC and physiological clearance observed in an acute ethanol exposure model in mice (5g/kg ethanol administration over 24 h) [19]. Characterization of proteomic changes at 24 h will allow for identification of longer-lasting effects underlying microglial activation phenotype.
2.2. Primary microglia preparation and treatment
Primary mouse microglia were prepared from brains of newborn pups of C57BL/6J mice following our published procedures [20–22]. Isolated microglia were seeded to poly-D-lysine coated 6-well cell culture plates (5 × 10⁵ cells/well) for proteomic analysis and to Nunc 8-chamber glass slides (2 × 10⁴ cells/chamber) and maintained in Dulbecco’s Modified Eagle’s Media (DMEM) supplemented with 10% fetal bovine serum (FBS) at 37°C with 5% CO2. The next day, cells were treated for 24 h with DMEM supplemented with 2% FBS alone (control), or that containing 5 ng/mL LPS or 50 mM ethanol. For proteomic analysis, treated cells were detached with a brief treatment with trypsin-EDTA PBS solution and then washed three times with ice-cold PBS. Cell pellets were snap frozen in liquid nitrogen and stored at −80°C until further processing for mass spectrometric analysis. A total of 5 biological replicates were collected for each treatment condition. Cells in chamber slides were rinsed 3x with PBS, fixed in 4% formaldehyde in PBS for 10 min at room temperature and then stored in PBS at 4°C until further analysis.
2.3. Sample Processing
Once thawed, pelleted cells were initially spun down at 17,000 × g for 2 minutes before being processed using the suspension trap (S-Trap) [23, 24] micro spin column digestion protocol as previously described [13]. In brief, cells were lysed, and DNA was sheared in 50 μL 50 mM ammonium bicarbonate buffer containing 5% sodium dodecyl sulfate. Protein concentrations were determined using the 660 nm protein assay (Pierce). An average protein yield of 25.7 ± 4.5 μg per replicate (representing ~5×10⁵ primary microglial cells) was obtained. Aliquots of 5 μg were saved in −80°C for later validation, while approximately 25 μl were immediately processed for mass spectrometric analysis. These samples were reduced and alkylated, then clarified. The supernatant was acidified to a final concentration of 1.2% phosphoric acid. Six times the supernatant volume of S-Trap protein binding buffer was then added and mixed thoroughly. The samples were then passed through the S-Trap micro column. Protein bound within the protein-trapping matrix of the spin column was then washed with S-Trap buffer 4 times. Proteolytic digestion was performed using 2 μg Trypsin/Lys-C protease (Promega) incubated in a heat block for 2 h at 47°C.
After digestion, peptides were eluted with 50 mM ABC, followed by 0.2% formic acid in LC-MS grade H2O, then 35 μL of 50% acetonitrile containing 0.2% formic acid. Eluted peptides were centrifuged under vacuum until completely dried and then resuspended in 0.1% formic acid in H2O. Samples were sonicated 10 min in a water bath and centrifuged 17,000 × g for 30 min to fully pull down any non-soluble particulate before transferring the clarified peptide supernatant into autosampler vials.
2.4. Mass spectrometry and data analysis
Using an Ultimate 3000 UPLC system (Thermo), a 2 cm × 75 μm ID PepMap C18 trap column (Thermo) was used to pre-concentrate digested samples before running through a 55°C-heated 75 cm × 75 μm ID PepMap column (Thermo) packed with 2 μm, 100 Å C18 material. Peptides were separated using a 120-minute gradient from 2–28% B, where B was 0.1% formic acid in 80% acetonitrile:20% water. An inline mass spectrometric analysis was performed on a hybrid quadrupole-Orbitrap instrument (Q Exactive Plus, Thermo) employing both conventional and then modified (segmented) data-dependent acquisition (DDA) approaches as previously published [13]. The conventional mode of DDA utilized a top 10 method spanning the m/z range of 375–1200 where the precursor MS scan was performed at 70,000 resolution followed by MS/MS scans at 17,500 resolution. The segmented approach differed by splitting the scan ranges into 3 segments for DDA: m/z 375–600, m/z 600–800, and m/z 800–1200. The first two ranges featured a top 6 DDA method as they contained higher peptide densities while the m/z 800–1200 range only required a top 3 DDA method. Settings for the full MS and MS/MS resolution as well as AGC and maximum IT were the same as in the conventional DDA with the exception of the MS/MS maximum IT which was increased to 100 ms in the m/z 800–1200 range.
Using MaxQuant (version 1.6.1.0), raw files were searched against the UniprotKB protein database for Mus musculus, UP000000589 with 53,096 entries. The conventional DDA and segmented DDA files were included as technical replicates for each biological replicate (n=5) in the MaxQuant analysis. Search parameters included the constant modification of cysteine by carbamidomethylation and the variable modification of N-terminal protein acetylation and methionine oxidation. A second database of known contaminants provided with MaxQuant was also used in the search, and the first search tolerance was set to 20 ppm followed by a main search tolerance of 4.5 ppm. Additionally, a decoy database search strategy was employed using reversed sequences to achieve protein and peptide FDR values of less than 1%. LFQ-based quantitation was enabled, which is peak intensity-based quantitation, with a minimum ratio count of 1, in addition to the “match-between-runs” feature using default settings.
The resulting ProteinGroups text file was then edited by the removal of reverse and contaminant sequences as well as proteins only identified by modification and then uploaded into Perseus (version 1.6.1.1) separately for LPS vs. Control and Ethanol vs. Control. LFQ values were log2-transformed and proteins with missing values in more than just 2 out of the 5 replicates were removed. Missing values were replaced using the imputation function in Perseus with width and downshift parameters set to 0.3 and 1.8, respectively. In Excel, the average ratio of treatment over control was calculated along with a Welch’s t-test (p-value < 0.05) and z-score (z-value > 1). Statistically significant differentially expressed proteins were filtered using both Welch’s t-test and z-score cutoffs in order to limit the false discovery rate while maintaining sensitivity [25, 26]. These lists were used for further validation via PRM and western blot analysis. The protein identification and average ratio of each list of proteins filtered by Welch’s t-test alone were then uploaded to Ingenuity Pathway Analysis (IPA). Bioinformatic analysis of the less stringent lists provided IPA a larger pool to help predict upstream regulators, over-represented canonical pathways, as well as other biological and disease functions (p < 0.05, Fisher’s exact test). Overall protein identification list (pre-Perseus), filtered protein lists with imputations (post-Perseus), and differentially expressed protein lists after Welch’s t-test are provided as supplementary information for each respective treatment compared to control (Supp. Tables 1 and 2).
2.5. Validation in adult-derived microglia
Adult-derived immortalized microglial (IMG) cells were grown and maintained in DMEM supplemented with 10% FBS, 50 U/ml penicillin and 50 μg/ml streptomycin and incubated in 5% CO2, 37 °C. Cells were grown to approximately 70% confluence in 75-cm2 flasks, and either treated with 10 ng/ml LPS or maintained as non-treated controls (each condition in triplicate). A higher dose was utilized (10 ng/ml compared to 5 ng/ml LPS used for primary cells) given the tendency of cell lines to have lower biological responsiveness compared to their primary cell counterparts; however, the dose was still within an appropriate range to induce a robust pro-inflammatory response yet not introduce cytotoxic effects. Cells were then rinsed 3x with ice-cold PBS where the last rinse was used to scrape-collect cells. Samples were then spun down at 300 × g, 4°C for 10 minutes, PBS supernatants was removed, and cells were resuspended and transferred into 1.7 ml tubes before their final spin. Once supernatants were removed for the final time, cell pellets were flash-frozen in liquid nitrogen and stored in −80°C for future validation.
2.6. Western blot validation
Primary microglia were lysed and quantified as stated above. Once thawed, 2 μg of each replicate were re-suspended in 2X Laemmli buffer, loaded onto precast SDS-PAGE TGX 18-well gels along with protein standards, and run at 125V for approximately 1.5 h (Bio-Rad). Proteins were transferred to methanol pre-soaked PVDF membranes using the semi-dry turbo transfer system (Bio-Rad) at 2.5A, 25V for 10 min. Blots were rinsed well in TBST then blocked in a 5% (wt/vol) powdered milk in PBS solution for 1 h at room temperature. Next, the blots were washed in BSA in TBST for 1 h prior to primary antibody incubation. Primary antibody HCLS1 (Cell Signaling) was used at a 1:1000 concentration, shaking overnight at 4°C. The primary antibody was resuspended in a 5% BSA/TBST solution. The next day, blots were washed 3 times for 20 min each, in TBST at room temperature prior to the addition of HRP-conjugated anti-rabbit secondary antibody (Cell Signaling). The secondary antibody was prepared in 5% milk (wt/vol) and TBST at a 1:3000 dilution. Blots were then washed for 20 min, 3 times in TBST prior to developing. Blots were incubated for 1 min in SuperSignal West Pico PLUS Chemiluminescent Substrate (Bio-Rad) and developed using the Amersham Imager 680 (GE). Blots were re-probed with primary antibody GAPDH/HRP (Cell Signaling) as a loading control overnight and imaged again the following day.
To validate ZNFX1, 10-well gels (n=3 technical replicates) were run as previously described with 10 μg of IMG mouse lysate of control and LPS (n=3 biological replicates) with the following alterations. They were probed with 1:1000 non-purified anti-serum from rabbits immunized with the N-terminal portion of ZNFX1 (residues 1–15, antibody generated by Covance). Gels were transferred with the semi-dry turbo transfer system (Bio-Rad) at 1.3A, 25V for 15 min, rabbit secondary was added, and bands were imaged as previously described. Once imaged, a 1:3000 dilution of β-actin with an HRP-conjugated mouse secondary antibody (Cell Signaling) was used as the loading control. All western blot images were quantified using ImageQuant TL (version 8.2.0, GE).
2.7. Immunofluorescence (IF) analysis
IF analysis of primary microglia grown in glass chamber slides was performed following our previously published protocols with minor modifications [27, 28]. Briefly, following incubation for 2 hr with blocking solution (2% normal donkey serum and 0.1% Triton X-100 in PBS), cells were incubated overnight at 4°C with rabbit anti-mouse CD86 (Cell Signaling Technology) diluted 1:200 in the blocking solution. Afterwards, cells were washed 3 times with PBS and then incubated for 1 hr at room temperature with donkey anti-rabbit IgG conjugated to Cy5 (Jackson ImmunoResearch) diluted 1:500 in the blocking solution. After PBS washes, cells were coverslipped in a DAPI-containing mounting medium (Sigma). Images were captured and analyzed with a ThermoFisher EVOS M5000 Imaging System equipped with Cy5 and DAPI light cubes.
2.8. PRM validation
Parallel reaction monitoring (PRM) masses were configured for several proteins of interests by using two specific peptides for each protein and scanning for each specific mass (Supp. Table 3). Selection of peptides was based on several criteria: 1) low PEP value for MS/MS identification (indicating confident score), 2) 7–20 residues, 3) minimal distribution of the peptide signal across multiple charge states, and 4) absent of amino acids prone to modification if possible (e.g., methionine oxidation). For PRM analysis, the gradient time was shortened to 60 min and MS2 parameters included 35,000 resolution, AGC target of 2e5, maximum IT of 150 ms, isolation window of 1.2 m/z, and normalized collision energy value of 28. PRM data were processed in Skyline (version 4.2.0.18305) where peptide levels were normalized to 2 unique peptide sequences derived from beta-actin (Supp. Table 3). Specifically, the peak area ratios of quantifiable peptides normalized to the global standard (beta-actin) were summed for the top 3 most abundant y-ions in each replicate (n=5 per group). The summed total ratio was then averaged and statistical significance between groups was determined using a Welch’s t-test (p<0.05).
3. Results and discussion
3.1. Overall and Quantifiable Protein Identification
After removal of contaminants and decoys, MaxQuant identified 5,062 unique protein groups overall, resulting in the deepest proteomic coverage, to our knowledge, of LPS- and ethanol-treated primary microglia to date. Of these, 4,928 unique proteins were quantifiable by having valid values in at least 3 out of 5 possible replicates, in at least LPS or control groups. LPS also had an average CV of 19.8%, demonstrating high reproducibility throughout the 5 replicates. Similarly, when comparing ethanol to control, 4,857 unique proteins were found quantifiable with an average CV of 20.5%. The increased CV compared to our previously published work in the IMG microglial cell line using the same methods (~10% average CV) was presumably due to the biological variability associated with neonatal-derived primary microglia [13].
3.2. Novel Proteins and Pathways Associated with LPS-induced Microglial Response
The improved coverage obtained from our enhanced methodology resulted in the identification and quantification of protein expression levels in LPS-treated microglia that are consistent with a pro-inflammatory activation phenotype (Fig. 1 A, B). In addition to high proteomic coverage of known pathways, we also identified several novel, low-abundant proteins including transcriptional regulators and other chemokine and signaling proteins (Supp. Tables 1). Robust markers of the pro-inflammatory response that were observed (Top 20 most abundant differentially expressed proteins in Fig. 1B) include increased expression of IFIT1, IFIT2, and IFIT3, IRG1, and CMPK2. IFITs have been shown to play a significant role in the immune response especially in regard to defending against viral pathogens [29, 30]. IRG1 is a robust macrophage/microglial marker that links metabolism to the pro-inflammatory response [31]. Interestingly, in relation to CMPK2, LPS-induced CMPK2 upregulation was recently linked to the increase of mitochondrial DNA and subsequent activation of NLRP3 inflammasome [32, 33]. The reported proteomic results complement markers used in the conventional M1 and M2 classification system, which are highlighted in Supp. Table 4. Classical activation (M1) markers were accurately identified and quantified by proteomic analysis of LPS-treated microglia and include CD86, CD40, CD74, IL-1ß, and CCL5. Consistent with the proteomic analysis, IF analysis showed a significantly increased expression of CD86 in LPS-treated, but not ethanol-treated primary microglia (Fig. 1 C, D). The relative abundance of the M1 markers as well as the top 20 most abundant differentially expressed proteins were estimated by dividing the total intensity of the individual protein by the total intensity of all proteins identified by MaxQuant. Actin, the most abundant protein based on MS intensity, was calculated to be approximately 4.5% of the total protein content and used for normalization. The top 20 markers identified by proteomics (Fig. 1B) are in the range of 10–100 fold lower than actin in terms of relative abundance. In comparison, CD86, TNF and iNOS (conventional M1 markers) were 1,000 to >10,000 fold lower in relative abundance compared to actin. Given their high abundance and magnitude fold-change at the protein level, all proteins shown in Fig. 1B potentially represent markers to more accurately and reliably measure pro-inflammatory phenotypic changes (through TLR2/4 activation).
Figure 1.

Proteomic and IF Validation Results for LPS-treated Microglia. (A) Volcano plot showing the LPS-induced differentially expressed proteins (highlighted) after Welch’s t-test and z-score filtering. (B) Average Log2(LFQ) values levels of the top 20 significantly differentially expressed proteins (Welch’s t-test p<0.05 and |z-score| >1) found in LPS-treated microglia compared to control. Error bars represent ± SE (n=5). (C) IF analysis validated the differential effects on CD86 expression in primary microglia of treatments for 24 hr with 5 ng/ml LPS and 50 mM ethanol. Omission of first antibody showed no fluorescent signal. (D) Five images from each treatment condition of each experiment (three experiments total) were analyzed and fluorescent intensities were normalized against that of control and expressed as mean ± SEM. *, p<0.05 compared to control cells (ANOVA analysis with Duncan’s post hoc analysis).
It is important to note that some ratios are generated based on the imputation function in Perseus. For example, values for known LPS-induced proteins including iNOS or pro-inflammatory cytokines such as IL1α where no protein intensity was detected in the control group, will generate significantly high ratio values. Additionally, it should be realized that matching MS1 features based on accurate mass and retention time parameters (‘match between runs’) can increase FDR related to diminished MS/MS support for low abundance proteins. Both scenarios suggest using alternative approaches such as PRM to address these issues as shown for IRG1 and IL1α (Fig. 2).
Figure 2.

Western Blot and PRM Validation of Selected Differentially Expressed Proteins from LPS-treated Microglia. (A) Western Blot analysis was performed to validate ZNFX1 expression levels in biological (n=3) and technical replicates (n=3) (representative blot shown). β-actin was used as a loading control. Blots were quantified using ImageQuant TL (v.8.2.0, GE), which verified LPS treatment resulted in a significant increase in ZNFX1 levels. (B) PRM validation (n=5 biological replicates per group) was also performed on each of the following proteins: ZNFX1, IRG1, IL1α, each showing significant increases in LPS treatment compared to control. *p<0.05, **p<0.01, ***p<0.001, **** p<0.0001
Specific focus on transcriptional regulators of the LPS-induced microglial activation response showed the expected upregulation of STAT1 with an average fold change of 2.89, and NFκB2 with an average fold change of 4.53. Supp. Table 5 shows the functional annotation of LPS-induced differentially expressed proteins that passed both the Welch’s test and z-score cutoff using IPA, which includes the category of transcriptional regulators. Thirty-one of these transcriptional regulators were annotated as nuclear localized with several of these regulators known to be involved with immune response pathways. Focusing on those regulators that exhibited higher magnitude fold change and are novel in terms of limited information on biological function, ZNFX1 (4.02 fold change) was selected for further investigation. Although ZNFX1 has been shown to be a transcriptionally regulated gene associated with immune responses within the brain, its function still remains unclear [34]. Recently, a study using C. elegans provided evidence that ZNFX1 could be a critical epigenetic regulator that may help in establishing spatial and temporal zones of molecular activity during epigenetic regulation [35]. Specifically, within the contexts of LPS-induced microglial activation, it has previously only been shown transcriptionally upregulated [36]. ZNFX1 has multiple zinc finger domains, a motif that suggests DNA binding and potential transcriptional regulator activity. This study presents the first instance of proteomic coverage showing a significant increase in ZNFX1 protein levels in activated microglia and provides rationale for further study of this protein as a possible key player in the robust pro-inflammatory activation of microglia. The increase of ZNFX1 in LPS-treated microglia was validated through PRM analysis in primary neonatal-derived mouse microglia as well as Western blot analysis of adult-derived microglial (IMG) cells, which we previously characterized the proteome under normal conditions [13, 37] (Fig. 2). Interestingly, the magnitude fold-change of ZNFX1 upregulation was similar to the other important transcription factors related to the pro-inflammatory response including STAT1 and NFκB. These results therefore provide evidence that ZNFX1 protein levels may be important to the immune response of microglia in all developmental stages and future work will focus on the functional role of this protein in microglia.
Ingenuity pathway analysis (IPA) of the differentially expressed proteins found in LPS-treated microglia showed significantly enriched upstream regulators, canonical pathways as well as bio- and disease functions (Supp. Tables 6). The confidence in these predictions is shown by a z-score, indicating predicted activity changes, as well as the significance of overlap of the identified differentially expressed proteins with known upstream regulator targets reported in the literature. To emphasize the quality of the uploaded data set, and validation of the LPS treatment, the top hit for the predicted upstream regulators was in fact LPS itself (z-score of 9.154, p-value of 9.87E-29). The list of differentially expressed proteins and their fold changes yielding this prediction is provided in Supp. Table 7. The significant number and overlap of proteomically determined proteins with known LPS downstream targets as well as the largely consistent associations of differential expression in relation to predicted activation of LPS validate the quantitation accuracy of our LFQ approach for microglial phenotype characterization. Other predicted increases in upstream regulator activity include histone deacetylase (HDAC, z-score of 2.178). HDAC enzymes have been found to upregulate the inflammatory response of microglia as demonstrated in studies utilizing HDAC inhibitors in order to target deleterious neuroinflammation [38]. Other predicted upstream regulators include an increased activity in both interferon alpha and gamma (IFNα and IFNγ), well-known pro-inflammatory cytokines induced by pathogen-associated molecular patterns (PAMP) such as LPS. The data set also aligned with a predicted decrease in prostaglandin E2 receptor EP4 subtype (PTGER4), an anti-inflammatory receptor which was found to be a possible agonistic target to help reduce inflammation and treat Alzheimer’s disease [39, 40]. IPA predictions also included downstream functional outcomes aligned with increased microglial activation such as increased activation of myeloid cells. It is important to note that the identified upstream regulators and related activity changes are based on bioinformatic analysis and would require validation to confirm these predictions. The main conclusion from these bioinformatic predictions is the general outcome of alignment of the proteomically determined proteins in relation to the pro- or anti-inflammatory association of these upstream regulators.
3.3. Novel Proteins and Pathways Associated with Alcohol-induced Microglial Response
Improved depth of coverage also helped identify statistically significant, differentially expressed proteins and pathways in ethanol-treated primary microglia (Supp. Tables 2). The total differentially expressed proteins are shown as a Volcano plot in Fig. 3A and the top 20 most abundant proteins found significantly differentially expressed are shown in Fig. 3B. Of note, catalase (CAT), known to be increased as a cellular protection response against reactive oxygen species such as hydrogen peroxide, was shown to have a 1.3-fold increase. CAT can also contribute to the oxidative metabolism of ethanol, which further highlights the relevance of upregulation of this protein in the context of ethanol-treated microglia. The data also showed a modest increased fold change of 1.2 in cytochrome c oxidase subunit 2 (MTCO2/ COX2). Both proteins demonstrated a significant Welch’s p-value and z-score greater than 1. This result is of particular significance as recent evidence has shown COX2 to not simply be a potential activator of the immune response as previously thought, but could mediate processes associated with neuroprotection [41]. Additionally, lower abundant proteins such as metallothionein (MT1), with a 2.04 fold change increase, was also identified. Increases in MT1 and CAT are of significance as both are antioxidant enzymes found to have anti-inflammatory effects and inhibit the proliferation of microglia that is usually observed during a pro-inflammatory immune response, respectively [42–44]. Both targets were further validated through PRM mass spectrometry (Fig. 4).
Figure 3.

Proteomic Results for Ethanol-treated Microglia. (A) Volcano plot showing the ethanol-induced differentially expressed proteins (highlighted) after Welch’s t-test and z-score filtering. (B) Average Log2(LFQ) values levels of the top 20 significantly differentially expressed proteins (Welch’s t-test p<0.05 and |z-score| >1) found in ethanol-treated microglia compared to control. Error bars represent ± SE (n=5).
Figure 4.

PRM validation of CAT and MT1. Representative PRM data (top panels) showing the 3 top y-ions used for quantitation and corresponding quantitation results (bottom panels) for CAT and MT1. Both CAT and MT1 showed significant increases in ethanol-treated microglia while showing downregulation after LPS treatment. *p<0.05, **p<0.01, error bars indicate SEM.
Additional evaluation of upregulated proteins within the top 20 most abundant differentially expressed proteins in Fig. 3 revealed LIPA, SPNS1, and SDHC. Interestingly, as is the case for COX2, SDHC is another component of the OXPHOS pathway. We then applied higher stringency to the bioinformatic filtering, which included pathway analysis of proteins filtered based on z-score and p-value in addition to Benjamini-Hochberg (B-H) p-value correction of the canonical pathway enrichment results. Using this approach, ethanol-treated microglia showed OXPHOS activation as a significantly enriched pathway (z-score of 2.449 and p-value of 6.02E-03 after B-H multiple testing correction). Specifically, 6 OXPHOS-associated proteins were upregulated including MTCO1, MTCO2, MTND4, NDUFA7, NDUFB7, and SDHC (Supp. Fig. 1). In addition to the predicted activation of OXPHOS, the up-regulated proteins LIPA and SPNS1, are involved in hydrolysis of cholesterol esters/triglycerides and sphingolipid trafficking. Taken together, there appears to be a metabolic shift towards utilization of OXPHOS as well as alteration in lipid homeostasis in ethanol-treated microglia. Interestingly, this metabolic shift, which includes upregulation of LIPA and utilization of OXPHOS, are key features of IL-4-mediated, anti-inflammatory (M2) macrophage phenotype [45], suggesting ethanol could induce a similar metabolic shift that favors an anti-inflammatory phenotype in microglia.
As was the case with LPS, IPA predicted significant upstream regulators and biological disease functions based on the alignment of the differentially expressed protein dataset of ethanol-treated microglia and current published works. Unlike LPS, however, these predictions did not fully align with pro-inflammatory activation of microglia. Here, this study highlights several instances of partial or alternative mechanisms and pathways of microglial activation through predicted upstream regulators, canonical pathways, as well as diseases and biological functions (Supp. Tables 8). For example, HGF, which is shown to increase in brains with neuronal damage, specifically microglia exposed to inflammatory mediators, was predicted to be decreased in ethanol-treated microglia (z-score of −2.415) [46]. A decrease in E2F1 was also predicted (z-score of −2.674, overlap p-value of 1.72E-3). This result is another instance where the downstream targets in the ethanol dataset suggested an upstream regulator with effects opposite to those found in LPS as a previous study showed E2F1 ablation limits neuroinflammation [47]. Alternatively, increased predicted activation of leukemia inhibitory factor (LIF), a cytokine important for proper microglia function [48], was predicted to be activated (z-score of 2, though only a p-value of overlap of 0.299). Notably, another study reported microglia-derived LIF necessary for astrocyte recruitment and differentiation in immune response [49]. LIF could be an important factor in the interplay between various cells of the CNS and the complicated regulatory network initiated due to acute ethanol exposure and may warrant further study. Furthermore, decreased activity in LY294002, a chemical kinase inhibitor of PI3K, was also predicted. This inhibitor has been shown to act upon, and thereby reduce, IFNγ-stimulated inducible nitric oxide synthase expression in mouse BV2 microglial cells [50].
Predicted regulator effects also show an increase in RB1 and a decrease in ERG activation states. The target proteins of this predicted regulators align with those from the ethanol-treated microglial dataset. Interestingly, RB1 was shown to increase AKT expression when knocked out in mouse embryonic fibroblasts [51]. Therefore, as the dataset presented in this study shows a decrease of AKT1, the prediction provided by IPA showed an increase of RB1. Simultaneously, IPA predicted a decrease in ERG as the cause of the observed decreased HDAC, WIPF1, and CDC42BPB found in the ethanol-treated microglial proteome. As previously mentioned, HDAC is well known to play a role in inflammation and IPA was able to predict a downstream biological function of decreased cell protrusions. As previously mentioned, it is important to note that these are bioinformatic predictions and are not necessarily the cause of the resulting significantly expressed proteins observed; however, the overlap of our proteomic data with these predictions suggest an overall trend that acute ethanol exposure results in a general overall inhibitory effect on immune response pathways.
Further evaluation of predicted downstream biological functional outcomes identified a significant decrease in observed engulfment of phagocytes (z-score of −2.190, overlap p-value of 8.83E-03) as well as a decreased trend of phagocytosis of neutrophils (z-score of −1.982, p-value of 6.35E-03) (Fig. 5). Specifically, downregulation of C3, SYK, and WAS and upregulation of TLR3 leads to predicted inhibition of phagocytosis. Similarly, downregulation of C3, SYK, WAS as well as CTNND1, MAP1S, PTPN6, and SWAP70 leads to predicted inhibition of engulfment of phagocytes. One marker associated with the phagocytosis/engulfment pathways in Figure 5 is ethanol-induced TLR3 upregulation where TLR3 shows mixed effects on phagocytosis based on the literature (i.e., upregulation is inconsistent with predicted inhibition of engulfment of phagocytes while upregulation is consistent with predicted inhibition of phagocytosis). Recent work has shown the importance of TLR3 signaling in the neuroimmune response to alcohol and its role in regulation of alcohol drinking behavior in mice [52, 53]. Our proteomic results show that ethanol does not affect the expression other TLRs with some indication of inhibition of pathways related to TLR2/4; therefore, ethanol could potentially suppress related immune functions while selectively increasing TLR3 expression with no predicted activity changes. This result is consistent with a recent study showing acute alcohol exposure suppresses TLR4-related pathways but has no effect on the TLR3-TRIF pathway activity in human monocytes/macrophages (both in vivo and in vitro) [7]. Our data suggest that previous alcohol exposure could prime microglial cells to be more responsive through TLR3 signaling, in turn contributing to modulation of neuroimmune and drinking behavior associated with subsequent drinking episodes.
Figure 5.

Predicted Inhibition of Phagocytosis in Ethanol-treated Microglia. Due to high significant overlap between experimentally observed differentially expressed proteins and literature, bioinformatic (IPA) analysis shows predicted inhibition of the engulfment of phagocytes/phagocytosis of neutrophils in ethanol-treated microglia. Blue indicates predicted inhibition while red and green nodes indicate experimentally determined up- and down-regulation, respectively. The blue arrow indicates the association of the up- or down-regulation of the differentially expressed protein to the central node representing the functional outcome (e.g., SYK downregulation leads to predicted inhibition of either engulfment of phagocytes or phagocytosis of neutrophils). The orange arrow indicates a result inconsistent with predicted activity.
3.4. Comparison of LPS- and Alcohol-treated Microglia Proteomic Response
The differences in microglial phenotypes can be emphasized when comparing the proteomic datasets of ethanol and LPS treatment groups. Here we report several proteins that differed significantly between the two treatments, which were selected for further validation. Of note, HCLS1/HS1 revealed an increased fold change of 2.11 in LPS-treated microglia while alternatively exhibiting a decreased fold change of −1.37 in ethanol-treated microglia. Increased levels of HCLS1 in LPS-treated microglia were validated through Western blot analysis as well as through PRM mass spectrometry, though only a decreasing trend (p=0.055) in ethanol-treated microglia could be detected through PRM analysis of HCLS1 (Fig. 6). The contrasting expression levels of HCLS1 between treatments are particularly interesting, as it has been found to act within the immune response particularly in cell migration by playing a role as an actin-regulatory adaptor protein at the immune synapse during T-cell activation [54, 55]. Opposing differences in predicted downstream biological functions could be found including cell movement, a pathway that could implicate HCLS1, which was predicted to be increased in LPS-treated microglia (z-scores of 2.371, p-value of 4.8E-17) while decreased in ethanol-treated microglia (z-score of −2.991, p-value of 4.00E-4).
Figure 6.

Western Blot and PRM Validation of HCLS1. (A) Representative Western blot and HCLS1 protein ratios normalized to GAPDH were quantified using ImageQuant TL (v.8.2.0, GE). In the top band, HCLS1 protein expression levels between ethanol and control were non-significant while in LPS they were significantly increased. In the second band (corresponding to correct MW of HCLS1); however, HCLS1 expression levels were significantly decreased in ethanol compared to control. (B) Representative PRM data showing the 3 top y-ions used for quantitation and related quantitation results for HCLS1 where a significant increase was found in the LPS treatment group compared to control. #p<0.10, *p<0.05, **p<0.01, ***p<0.001, **** p<0.0001
Additionally, a significant difference was shown in FCγ receptor-mediated phagocytosis in macrophages and monocytes (Fig. 7). Within this robust regulatory network, opposite trends were predicted in several key proteins. The signal transducer tyrosine kinase (SYK) was upregulated in LPS-treated microglia as expected. Several studies have shown SYK strongly upregulated in the classical response of microglia and macrophages [56]. Opposite of this result, SYK was downregulated in ethanol-treated microglia. SYK has also been linked as a downstream target of TREM2, which has been recently studied as a key regulator of microglial function including phagocytosis in which mutations have been linked to Alzheimer’s disease [57]. TREM2 is significantly downregulated (−8.37) in LPS-treated microglia; however, no change was observed after acute ethanol exposure. Additionally, SYK has been linked to HCLS1 regulation, and as both are shown to be downregulated in ethanol-treated microglia, they may be critical in the specific activation response of microglia to ethanol [58, 59]. Our study also highlights several opposing expression level changes at the protein level that are part of the nascent phagosome. WASP and SLAP130, for example, are necessary in phagosome development and were both detected to be upregulated in LPS-treated microglia while downregulated in ethanol-treated microglia. WASP regulation is particularly of interest as it is necessary for co-regulation of cell migration along with HCLS1 [60]. The expression changes in these phagocytosis-related proteins is particularly interesting as a recent transcriptomic study reported ethanol treatment decreases amyloid beta phagocytosis in rat primary microglia [61]. Given the minimal overlap of differentially expressed proteins in this study compared to the transcripts identified in [61], the results highlight the importance of utilizing multiple systems biology approaches to characterize the complex phenotypic changes that occur in microglia. The metabolic changes related to OXPHOS activation and LIPA upregulation suggest an M2-like phenotype in ethanol-treated microglia; however, inhibition of phagocytosis is inconsistent with this particular activation state. Additionally, the proteomic results did not show differential expression of conventional M2 markers such as CD206 and Arg1 (Supp. Table 4). Therefore, alcohol could induce metabolic features consistent with an M2-like phenotype in microglia but the activation phenotype is likely within a unique sub-type classification based on inhibitory effects observed with phagocytosis. Another important point to address is the subtle changes in protein expression observed with ethanol treatment, which could be related to changes in post-translational modifications such as modulation of phosphorylation levels within these important signaling pathways. Future work will address the phosphoproteomic as well as metabolomic profiles that could more accurately define activity changes of relevant immune-related proteins/pathways in microglia.
Figure 7.

Differences in FCγ Receptor-Mediated Phagocytosis in Macrophages and Monocytes between LPS and Ethanol Treatment Groups. Opposite trends were predicted in several key proteins of this pathway between LPS treatment (A) and ethanol treatment (B). A zoomed in view displays the differences in signal transducer tyrosine kinase (SYK), which was upregulated in LPS and downregulated in ethanol treatment groups (C). Another zoomed in view of the nascent phagosome includes WASP and SLAP130 is shown, which also presented opposing protein expression level changes (increased and decreased levels after LPS and ethanol treatment, respectively). Red and green indicate up- and down-regulation, respectively, as determined by proteomic analysis.
When comparing the significantly differentially expressed proteins from both treatments, IPA was able to show side-by-side predictions, several of which contrasted in direction or intensity of regulation. Several of these share a trend that ethanol treatment does not induce the strong activated response of microglia as observed with LPS treatment. For example, Oncostatin M (OSM), a proinflammatory cytokine, was predicted to be an increased upstream regulator in LPS-treated microglia (z-score of 4.04, p-value of 2.78E-12) while in ethanol-treated microglia the opposite could be observed (z-score of −1.698, p-value of 5.46E-4). Alternatively, PPARα, known to be involved in regulation of anti-inflammatory pathways, is predicted to be a decreased upstream regulator in LPS-treated microglia (z-score of −2.52, overlap p-value of 1.76E-17) while increased in ethanol-treated microglia (z-score of 2.542 and p-value of 3.06E-2) [62]. Additionally, PPARGC1A, which is a co-activator of PPARG, was predicted to be activated in ethanol-treated microglia (z-score of 2.17 and p-value of 2.13E-3). PPARG, in particular, is a regulator of M2 polarization and its downstream targets such as CAT, MT-CO2, and LIPA (Supp. Tables 8 – upstream regulators tab) overlap with the top 20 hits shown in Fig. 3B. AMPK was also predicted to be a decreased upstream regulator in LPS-treated microglia (z-score of −2.57, overlap p-value of 7.85E-3) while increased in ethanol-treated microglia (z-score of 2.393, p-value of 5.65E-3). Interestingly, a recent study showed that the activation of AMPK resulted in inhibition of pro-inflammatory activation in BV2s, a mouse microglial cell line [63].
In addition to the opposite effects of ethanol and LPS on pathway and upstream regulator activity, similar protein expression changes were also observed for several proteins (Supp. Table 9). Proteins that are upregulated in both ethanol and LPS groups include transcriptional repressor p66 alpha, GRAM domain-containing protein 1A, General transcription factor II-I, and DNA dC->dU-editing enzyme APOBEC-3. The exact role of these proteins in terms of microglial activation are unclear but their broad range of general functions include transcriptional regulation, response to viral infection, and cholesterol transport. The upregulation of these proteins could represent important molecular players in general activation response of microglia; however, future studies are needed to delineate the exact contributions of these proteins to microglial activation phenotype.
These significant contrasts might be the key differences in the unique phenotype observed in ethanol-treated microglia as opposed to the pro-inflammatory activation mediated by TLR4 activation. It is apparent that acute exposure to ethanol results in subtle, long-lasting changes in the microglial proteome with a general inhibitory effect on multiple immune-related functions such as phagocytosis and cell migration as well as a metabolic shift associated with differential expression of proteins related to OXPHOS and lipid homeostasis.
4. Conclusion
Through deep proteomic profiling and bioinformatic analyses, this study was able to provide detailed global-scale mechanistic information in terms of the effects of ethanol on primary mouse microglia. Given the depth of coverage reported, we even expanded upon the characterization of the pro-inflammatory phenotype mediated by LPS, which includes the novel protein ZNFX1. Here we found the changes induced by acute ethanol exposure are not consistent with the robust activation response induced by a TLR2/4 agonist. Instead, the ethanol-induced proteomic changes align with a phenotype related to a suppressed immune response and potentially a metabolic status that would indicate an anti-inflammatory (M2-like) phenotype. Specifically, the contrast of ethanol-treated microglia to the LPS-mediated pro-inflammatory response suggests that ethanol has an inhibitory effect on multiple immune response pathways such as cell migration and phagocytosis, while selectively increasing expression of proteins related to anti-inflammatory effects (e.g., CAT, MT1, and OXPHOS proteins). The molecular signatures identified by proteomics suggest a unique alcohol-induced activation phenotype for microglia. Future work will focus on implementing our approach for phenotype characterization utilizing various animal models of chronic ethanol exposure, in order to more accurately classify dose- and time-dependent phenotypic changes of microglia in vivo.
Supplementary Material
Supplemental Figure 1. OXPHOS Activation in Ethanol-treated Microglia. IPA analysis revealed significant enrichment (p-value = 6.02E-03 after B-H multiple testing correction) of OXPHOS pathway with a predicted activation state (z-score = 2.449). Red indicates upregulation and highlighted nodes indicate individual complex components identified as differentially expressed by proteomics.
Supplemental Table 3. PRM peptide and mass list. Each protein of interest had two unique peptides chosen for validation with corresponding specific mass.
Supplemental Table 4. Markers of M1/M2 classification system. Proteomic analysis identified several markers of M1 (classical activation) and M2 (anti-inflammatory) activation.
Supplemental Table 5. Annotation of LPS-induced differentially expressed proteins. Ingenuity Pathway Analysis (IPA) was used to annotate class (e.g., transcriptional regulator) and localization of proteins regulated by LPS.
Supplemental Tables 6. Ingenuity Pathway Analysis (IPA) of the differentially expressed proteins found in LPS-treated microglia showing significantly enriched upstream regulators, canonical pathways, as well as bio- and disease functions.
Supplemental Table 7. The list of differentially expressed proteins and their fold changes yielding a predicted LPS upstream regulator from the LPS-treated microglia dataset.
Supplemental Tables 8. Ingenuity Pathway Analysis (IPA) of the differentially expressed proteins found in EtOH-treated microglia showing significantly enriched upstream regulators, canonical pathways, as well as bio- and disease functions.
Supplemental Table 9. Common differentially expressed proteins between EtOH- and LPS-treated microglia.
Supplemental Tables 1. LPS Protein Identification. Overall protein identification list (pre-Perseus), filtered protein lists with imputations (post-Perseus), and differentially expressed protein lists after Welch’s t-test are provided as supplementary information for LPS treatment compared to control.
Supplemental Tables 2. Ethanol Protein Identification. Overall protein identification list (pre-Perseus), filtered protein lists with imputations (post-Perseus), and differentially expressed protein lists after Welch’s t-test are provided as supplementary information for EtOH treatment compared to control.
Significance.
Alcohol abuse has a significant impact on the central nervous system, which includes the pathophysiological mechanisms resulting from glial cell activation. Microglia, in particular, are the resident immune cells of the brain and exhibit a broad range of activation phenotypes. The molecular changes that drive microglial activation phenotype are complex and have yet to be fully characterized in the context of alcohol exposure. Our study highlights the first and most comprehensive characterization of alcohol-induced proteomic changes in primary microglia to date and has shed light on novel immune-related and metabolic pathways that are altered due to alcohol exposure. The results from this study provide an important foundation for future work aimed to understand the complexity of alcohol-induced microglial activation in vivo and other translational models of acute and chronic alcohol exposure.
Highlights.
Deep proteome profiling identified 5,062 unique proteins in mouse primary microglia
4,928 and 4,857 proteins were quantifiable in LPS and ethanol treatment groups, respectively
Bioinformatic analysis predicted ethanol-induced inhibition of several pro-inflammatory pathways
Ethanol-induced pathway alterations suggest a metabolic phenotype resembling alternative activation
Acknowledgment
We acknowledge the NIH/NIAAA for funding, grant numbers AA026082 and AA025183.
Footnotes
Publisher's Disclaimer: This is a PDF file of an unedited manuscript that has been accepted for publication. As a service to our customers we are providing this early version of the manuscript. The manuscript will undergo copyediting, typesetting, and review of the resulting proof before it is published in its final form. Please note that during the production process errors may be discovered which could affect the content, and all legal disclaimers that apply to the journal pertain.
References
- [1].Henriques JF, Portugal CC, Canedo T, Relvas JB, Summavielle T, Socodato R, Microglia and alcohol meet at the crossroads: Microglia as critical modulators of alcohol neurotoxicity, Toxicol Lett 283 (2018) 21–31. [DOI] [PubMed] [Google Scholar]
- [2].Crews FT, Sarkar DK, Qin L, Zou J, Boyadjieva N, Vetreno RP, Neuroimmune Function and the Consequences of Alcohol Exposure, Alcohol Res 37(2) (2015) 331–41–344–51. [PMC free article] [PubMed] [Google Scholar]
- [3].Crews FT, Lawrimore CJ, Walter TJ, Coleman LG Jr., The role of neuroimmune signaling in alcoholism, Neuropharmacology 122 (2017) 56–73. [DOI] [PMC free article] [PubMed] [Google Scholar]
- [4].Marshall SA, McClain JA, Kelso ML, Hopkins DM, Pauly JR, Nixon K, Microglial activation is not equivalent to neuroinflammation in alcohol-induced neurodegeneration: The importance of microglia phenotype, Neurobiol Dis 54 (2013) 239–51. [DOI] [PMC free article] [PubMed] [Google Scholar]
- [5].Walter TJ, Crews FT, Microglial depletion alters the brain neuroimmune response to acute binge ethanol withdrawal, J Neuroinflammation 14(1) (2017) 86. [DOI] [PMC free article] [PubMed] [Google Scholar]
- [6].McClain JA, Morris SA, Deeny MA, Marshall SA, Hayes DM, Kiser ZM, Nixon K, Adolescent binge alcohol exposure induces long-lasting partial activation of microglia, Brain Behav Immun 25 Suppl 1 (2011) S120–8. [DOI] [PMC free article] [PubMed] [Google Scholar]
- [7].Muralidharan S, Lim A, Catalano D, Mandrekar P, Human Binge Alcohol Intake Inhibits TLR4-MyD88 and TLR4-TRIF Responses but Not the TLR3-TRIF Pathway: HspA1A and PP1 Play Selective Regulatory Roles, J Immunol 200(7) (2018) 2291–2303. [DOI] [PMC free article] [PubMed] [Google Scholar]
- [8].Lee H, Jeong J, Son E, Mosa A, Cho GJ, Choi WS, Ha JH, Kim IK, Lee MG, Kim CY, Suk K, Ethanol selectively modulates inflammatory activation signaling of brain microglia, J Neuroimmunol 156(1–2) (2004) 88–95. [DOI] [PubMed] [Google Scholar]
- [9].Bell-Temin H, Culver-Cochran AE, Chaput D, Carlson CM, Kuehl M, Burkhardt BR, Bickford PC, Liu B, Stevens SM Jr., Novel Molecular Insights into Classical and Alternative Activation States of Microglia as Revealed by Stable Isotope Labeling by Amino Acids in Cell Culture (SILAC)-based Proteomics, Mol Cell Proteomics 14(12) (2015) 3173–84. [DOI] [PMC free article] [PubMed] [Google Scholar]
- [10].Bell-Temin H, Zhang P, Chaput D, King MA, You M, Liu B, Stevens SM Jr., Quantitative proteomic characterization of ethanol-responsive pathways in rat microglial cells, J Proteome Res 12(5) (2013) 2067–77. [DOI] [PubMed] [Google Scholar]
- [11].Fernandez-Lizarbe S, Montesinos J, Guerri C, Ethanol induces TLR4/TLR2 association, triggering an inflammatory response in microglial cells, J Neurochem 126(2) (2013) 261–73. [DOI] [PubMed] [Google Scholar]
- [12].Fernandez-Lizarbe S, Pascual M, Guerri C, Critical role of TLR4 response in the activation of microglia induced by ethanol, J Immunol 183(7) (2009) 4733–44. [DOI] [PubMed] [Google Scholar]
- [13].Guergues J, Zhang P, Liu B, Stevens SM Jr., Improved Methodology for Sensitive and Rapid Quantitative Proteomic Analysis of Adult-Derived Mouse Microglia: Application to a Novel In Vitro Mouse Microglial Cell Model, Proteomics 19(11) (2019) e1800469. [DOI] [PMC free article] [PubMed] [Google Scholar]
- [14].Ramus C, Hovasse A, Marcellin M, Hesse AM, Mouton-Barbosa E, Bouyssie D, Vaca S, Carapito C, Chaoui K, Bruley C, Garin J, Cianferani S, Ferro M, Van Dorssaeler A, Burlet-Schiltz O, Schaeffer C, Coute Y, Gonzalez de Peredo A, Benchmarking quantitative label-free LC-MS data processing workflows using a complex spiked proteomic standard dataset, J Proteomics 132 (2016) 51–62. [DOI] [PubMed] [Google Scholar]
- [15].Liu B, Wang K, Gao HM, Mandavilli B, Wang JY, Hong JS, Molecular consequences of activated microglia in the brain: overactivation induces apoptosis, J Neurochem 77(1) (2001) 182–9. [DOI] [PubMed] [Google Scholar]
- [16].Gao HM, Jiang J, Wilson B, Zhang W, Hong JS, Liu B, Microglial activation-mediated delayed and progressive degeneration of rat nigral dopaminergic neurons: relevance to Parkinson’s disease, J Neurochem 81(6) (2002) 1285–97. [DOI] [PubMed] [Google Scholar]
- [17].Olson KN, Smith SW, Kloss JS, Ho JD, Apple FS, Relationship between blood alcohol concentration and observable symptoms of intoxication in patients presenting to an emergency department, Alcohol Alcohol 48(4) (2013) 386–9. [DOI] [PubMed] [Google Scholar]
- [18].Rivara FP, Jurkovich GJ, Gurney JG, Seguin D, Fligner CL, Ries R, Raisys VA, Copass M, The magnitude of acute and chronic alcohol abuse in trauma patients, Arch Surg 128(8) (1993) 907–12; discussion 912–3. [DOI] [PubMed] [Google Scholar]
- [19].Kriss CL, Gregory-Lott E, Storey AJ, Tackett AJ, Wahls WP, Stevens SM Jr., In Vivo Metabolic Tracing Demonstrates the Site-Specific Contribution of Hepatic Ethanol Metabolism to Histone Acetylation, Alcohol Clin Exp Res 42(10) (2018) 1909–1923. [DOI] [PMC free article] [PubMed] [Google Scholar]
- [20].Zhang P, Culver-Cochran AE, Stevens SM Jr., Liu B, Characterization of a SILAC method for proteomic analysis of primary rat microglia, Proteomics 16(9) (2016) 1341–6. [DOI] [PMC free article] [PubMed] [Google Scholar]
- [21].Gao HM, Hong JS, Zhang W, Liu B, Synergistic dopaminergic neurotoxicity of the pesticide rotenone and inflammogen lipopolysaccharide: relevance to the etiology of Parkinson’s disease, J Neurosci 23(4) (2003) 1228–36. [DOI] [PMC free article] [PubMed] [Google Scholar]
- [22].Liu B, Hong JS, Primary rat mesencephalic neuron-glia, neuron-enriched, microglia-enriched, and astroglia-enriched cultures, Methods Mol Med 79 (2003) 387–95. [DOI] [PubMed] [Google Scholar]
- [23].HaileMariam M, Eguez RV, Singh H, Bekele S, Ameni G, Pieper R, Yu Y, S-Trap, an Ultrafast Sample-Preparation Approach for Shotgun Proteomics, J Proteome Res 17(9) (2018) 2917–2924. [DOI] [PubMed] [Google Scholar]
- [24].Zougman A, Selby PJ, Banks RE, Suspension trapping (STrap) sample preparation method for bottom-up proteomics analysis, Proteomics 14(9) (2014) 1006–0. [DOI] [PubMed] [Google Scholar]
- [25].Deeb SJ, D’Souza RC, Cox J, Schmidt-Supprian M, Mann M, Super-SILAC allows classification of diffuse large B-cell lymphoma subtypes by their protein expression profiles, Mol Cell Proteomics 11(5) (2012) 77–89. [DOI] [PMC free article] [PubMed] [Google Scholar]
- [26].Tyanova S, Temu T, Sinitcyn P, Carlson A, Hein MY, Geiger T, Mann M, Cox J, The Perseus computational platform for comprehensive analysis of (prote)omics data, Nat Methods 13(9) (2016) 731–40. [DOI] [PubMed] [Google Scholar]
- [27].Sharma H, Hirko AC, King MA, Liu B, Role of NADPH oxidase in cooperative reactive oxygen species generation in dopaminergic neurons induced by combined treatment with dieldrin and lindane, Toxicol Lett 299 (2018) 47–55. [DOI] [PubMed] [Google Scholar]
- [28].Tikamdas R, Singhal S, Zhang P, Smith JA, Krause EG, Stevens SM Jr., Song S, Liu B, Ischemia-responsive protein 94 is a key mediator of ischemic neuronal injury-induced microglial activation, J Neurochem 142(6) (2017) 908–919. [DOI] [PubMed] [Google Scholar]
- [29].Fensterl V, Sen GC, Interferon-induced Ifit proteins: their role in viral pathogenesis, J Virol 89(5) (2015) 2462–8. [DOI] [PMC free article] [PubMed] [Google Scholar]
- [30].Mathews S, Branch Woods A, Katano I, Makarov E, Thomas MB, Gendelman HE, Poluektova LY, Ito M, Gorantla S, Human Interleukin-34 facilitates microglia-like cell differentiation and persistent HIV-1 infection in humanized mice, Mol Neurodegener 14(1) (2019) 12. [DOI] [PMC free article] [PubMed] [Google Scholar]
- [31].Michelucci A, Cordes T, Ghelfi J, Pailot A, Reiling N, Goldmann O, Binz T, Wegner A, Tallam A, Rausell A, Buttini M, Linster CL, Medina E, Balling R, Hiller K, Immune-responsive gene 1 protein links metabolism to immunity by catalyzing itaconic acid production, Proc Natl Acad Sci U S A 110(19) (2013) 7820–5. [DOI] [PMC free article] [PubMed] [Google Scholar]
- [32].Zhong Z, Liang S, Sanchez-Lopez E, He F, Shalapour S, Lin XJ, Wong J, Ding S, Seki E, Schnabl B, Hevener AL, Greenberg HB, Kisseleva T, Karin M, New mitochondrial DNA synthesis enables NLRP3 inflammasome activation, Nature 560(7717) (2018) 198–203. [DOI] [PMC free article] [PubMed] [Google Scholar]
- [33].Coll RC, Holley CL, Schroder K, Mitochondrial DNA synthesis fuels NLRP3 activation, Cell Res 28(11) (2018) 1046–1047. [DOI] [PMC free article] [PubMed] [Google Scholar]
- [34].Pasick J, Diederich S, Berhane Y, Embury-Hyatt C, Xu W, Imbalance between innate antiviral and pro-inflammatory immune responses may contribute to different outcomes involving low- and highly pathogenic avian influenza H5N3 infections in chickens, J Gen Virol 98 (6) (2017) 1245–1258. [DOI] [PubMed] [Google Scholar]
- [35].Ishidate T, Ozturk AR, Durning DJ, Sharma R, Shen EZ, Chen H, Seth M, Shirayama M, Mello CC, ZNFX-1 Functions within Perinuclear Nuage to Balance Epigenetic Signals, Mol Cell 70(4) (2018) 639–649 e6. [DOI] [PMC free article] [PubMed] [Google Scholar]
- [36].Das A, Chai JC, Kim SH, Park KS, Lee YS, Jung KH, Chai YG, Dual RNA sequencing reveals the expression of unique transcriptomic signatures in lipopolysaccharide-induced BV-2 microglial cells, PLoS One 10(3) (2015) e0121117. [DOI] [PMC free article] [PubMed] [Google Scholar]
- [37].McCarthy RC, Lu DY, Alkhateeb A, Gardeck AM, Lee CH, Wessling-Resnick M, Characterization of a novel adult murine immortalized microglial cell line and its activation by amyloid-beta, J Neuroinflammation 13 (2016) 21. [DOI] [PMC free article] [PubMed] [Google Scholar]
- [38].Durham BS, Grigg R, Wood IC, Inhibition of histone deacetylase 1 or 2 reduces induced cytokine expression in microglia through a protein synthesis independent mechanism, J Neurochem 143(2) (2017) 214–224. [DOI] [PubMed] [Google Scholar]
- [39].Shi J, Johansson J, Woodling NS, Wang Q, Montine TJ, Andreasson K, The prostaglandin E2 E-prostanoid 4 receptor exerts anti-inflammatory effects in brain innate immunity, J Immunol 184(12) (2010) 7207–18. [DOI] [PMC free article] [PubMed] [Google Scholar]
- [40].Woodling NS, Wang Q, Priyam PG, Larkin P, Shi J, Johansson JU, Zagol-Ikapitte I, Boutaud O, Andreasson KI, Suppression of Alzheimer-associated inflammation by microglial prostaglandin-E2 EP4 receptor signaling, J Neurosci 34(17) (2014) 5882–94. [DOI] [PMC free article] [PubMed] [Google Scholar]
- [41].Choi SH, Aid S, Bosetti F, The distinct roles of cyclooxygenase-1 and −2 in neuroinflammation: implications for translational research, Trends Pharmacol Sci 30(4) (2009) 174–81. [DOI] [PMC free article] [PubMed] [Google Scholar]
- [42].Mander PK, Jekabsone A, Brown GC, Microglia proliferation is regulated by hydrogen peroxide from NADPH oxidase, J Immunol 176(2) (2006) 1046–52. [DOI] [PubMed] [Google Scholar]
- [43].Inoue K, Takano H, Shimada A, Satoh M, Metallothionein as an anti-inflammatory mediator, Mediators Inflamm 2009 (2009) 101659. [DOI] [PMC free article] [PubMed] [Google Scholar]
- [44].Chung RS, Leung YK, Butler CW, Chen Y, Eaton ED, Pankhurst MW, West AK, Guillemin GJ, Metallothionein treatment attenuates microglial activation and expression of neurotoxic quinolinic acid following traumatic brain injury, Neurotox Res 15(4) (2009) 381–9. [DOI] [PubMed] [Google Scholar]
- [45].Huang SC, Everts B, Ivanova Y, O’Sullivan D, Nascimento M, Smith AM, Beatty W, Love-Gregory L, Lam WY, O’Neill CM, Yan C, Du H, Abumrad NA, Urban JF Jr., Artyomov MN, Pearce EL, Pearce EJ, Cell-intrinsic lysosomal lipolysis is essential for alternative activation of macrophages, Nat Immunol 15(9) (2014) 846–55. [DOI] [PMC free article] [PubMed] [Google Scholar]
- [46].Zhang L, Himi T, Murota S, Induction of hepatocyte growth factor (HGF) in rat microglial cells by prostaglandin E(2), J Neurosci Res 62(3) (2000) 389–95. [DOI] [PubMed] [Google Scholar]
- [47].Wu J, Sabirzhanov B, Stoica BA, Lipinski MM, Zhao Z, Zhao S, Ward N, Yang D, Faden AI, Ablation of the transcription factors E2F1–2 limits neuroinflammation and associated neurological deficits after contusive spinal cord injury, Cell Cycle 14(23) (2015) 3698–712. [DOI] [PMC free article] [PubMed] [Google Scholar]
- [48].Holmberg KH, Patterson PH, Leukemia inhibitory factor is a key regulator of astrocytic, microglial and neuronal responses in a low-dose pilocarpine injury model, Brain Res 1075(1) (2006) 26–35. [DOI] [PubMed] [Google Scholar]
- [49].Nakanishi M, Niidome T, Matsuda S, Akaike A, Kihara T, Sugimoto H, Microglia-derived interleukin-6 and leukaemia inhibitory factor promote astrocytic differentiation of neural stem/progenitor cells, Eur J Neurosci 25(3) (2007) 649–58. [DOI] [PubMed] [Google Scholar]
- [50].Hwang SY, Jung JS, Lim SJ, Kim JY, Kim TH, Cho KH, Han IO, LY294002 inhibits interferon-gamma-stimulated inducible nitric oxide synthase expression in BV2 microglial cells, Biochem Biophys Res Commun 318(3) (2004) 691–7. [DOI] [PubMed] [Google Scholar]
- [51].Hansen JB, Petersen RK, Jorgensen C, Kristiansen K, Deregulated MAPK activity prevents adipocyte differentiation of fibroblasts lacking the retinoblastoma protein, J Biol Chem 277(29) (2002) 26335–9. [DOI] [PubMed] [Google Scholar]
- [52].Warden AS, Azzam M, DaCosta A, Mason S, Blednov YA, Messing RO, Mayfield RD, Harris RA, Toll-like receptor 3 activation increases voluntary alcohol intake in C57BL/6J male mice, Brain Behav Immun 77 (2019) 55–65. [DOI] [PMC free article] [PubMed] [Google Scholar]
- [53].McCarthy GM, Warden AS, Bridges CR, Blednov YA, Harris RA, Chronic ethanol consumption: role of TLR3/TRIF-dependent signaling, Addict Biol 23(3) (2018) 889–903. [DOI] [PMC free article] [PubMed] [Google Scholar]
- [54].Gomez TS, McCarney SD, Carrizosa E, Labno CM, Comiskey EO, Nolz JC, Zhu P, Freedman BD, Clark MR, Rawlings DJ, Billadeau DD, Burkhardt JK, HS1 functions as an essential actin-regulatory adaptor protein at the immune synapse, Immunity 24(6) (2006) 741–52. [DOI] [PMC free article] [PubMed] [Google Scholar]
- [55].Castro-Ochoa KF, Guerrero-Fonseca IM, Schnoor M, Hematopoietic cell-specific lyn substrate (HCLS1 or HS1): A versatile actin-binding protein in leukocytes, J Leukoc Biol (2018). [DOI] [PubMed] [Google Scholar]
- [56].Boddaert J, Bielen K, s Jongers B, Manocha E, Yperzeele L, Cras P, Pirici D, Kumar-Singh S, CD8 signaling in microglia/macrophage M1 polarization in a rat model of cerebral ischemia, PLoS One 13(1) (2018) e0186937. [DOI] [PMC free article] [PubMed] [Google Scholar]
- [57].Zhao Y, Wu X, Li X, Jiang LL, Gui X, Liu Y, Sun Y, Zhu B, Pina-Crespo JC, Zhang M, Zhang N, Chen X, Bu G, An Z, Huang TY, Xu H, TREM2 Is a Receptor for beta-Amyloid that Mediates Microglial Function, Neuron 97(5) (2018) 1023–1031 e7. [DOI] [PMC free article] [PubMed] [Google Scholar]
- [58].Kahner BN, Dorsam RT, Kim S, Shankar H, Kitamura D, Kunapuli SP, Hematopoietic lineage cell-specific protein-1 (HS1) regulates PAR-mediated ERK activation and thromboxane generation in platelets, Platelets 19(8) (2008) 614–23. [DOI] [PubMed] [Google Scholar]
- [59].Hao JJ, Carey GB, Zhan X, Syk-mediated tyrosine phosphorylation is required for the association of hematopoietic lineage cell-specific protein 1 with lipid rafts and B cell antigen receptor signalosome complex, J Biol Chem 279(32) (2004) 33413–20. [DOI] [PubMed] [Google Scholar]
- [60].Dehring DA, Clarke F, Ricart BG, Huang Y, Gomez TS, Williamson EK, Hammer DA, Billadeau DD, Argon Y, Burkhardt JK, Hematopoietic lineage cell-specific protein 1 functions in concert with the Wiskott-Aldrich syndrome protein to promote podosome array organization and chemotaxis in dendritic cells, J Immunol 186(8) (2011) 4805–18. [DOI] [PMC free article] [PubMed] [Google Scholar]
- [61].Kalinin S, Gonzalez-Prieto M, Scheiblich H, Lisi L, Kusumo H, Heneka MT, Madrigal JLM, Pandey SC, Feinstein DL, Transcriptome analysis of alcohol-treated microglia reveals downregulation of beta amyloid phagocytosis, J Neuroinflammation 15(1) (2018) 141. [DOI] [PMC free article] [PubMed] [Google Scholar]
- [62].Clark RB, The role of PPARs in inflammation and immunity, J Leukoc Biol 71(3) (2002) 388–400. [PubMed] [Google Scholar]
- [63].Velagapudi R, El-Bakoush A, Lepiarz I, Ogunrinade F, Olajide OA, AMPK and SIRT1 activation contribute to inhibition of neuroinflammation by thymoquinone in BV2 microglia, Mol Cell Biochem 435(1–2) (2017) 149–162. [DOI] [PMC free article] [PubMed] [Google Scholar]
Associated Data
This section collects any data citations, data availability statements, or supplementary materials included in this article.
Supplementary Materials
Supplemental Figure 1. OXPHOS Activation in Ethanol-treated Microglia. IPA analysis revealed significant enrichment (p-value = 6.02E-03 after B-H multiple testing correction) of OXPHOS pathway with a predicted activation state (z-score = 2.449). Red indicates upregulation and highlighted nodes indicate individual complex components identified as differentially expressed by proteomics.
Supplemental Table 3. PRM peptide and mass list. Each protein of interest had two unique peptides chosen for validation with corresponding specific mass.
Supplemental Table 4. Markers of M1/M2 classification system. Proteomic analysis identified several markers of M1 (classical activation) and M2 (anti-inflammatory) activation.
Supplemental Table 5. Annotation of LPS-induced differentially expressed proteins. Ingenuity Pathway Analysis (IPA) was used to annotate class (e.g., transcriptional regulator) and localization of proteins regulated by LPS.
Supplemental Tables 6. Ingenuity Pathway Analysis (IPA) of the differentially expressed proteins found in LPS-treated microglia showing significantly enriched upstream regulators, canonical pathways, as well as bio- and disease functions.
Supplemental Table 7. The list of differentially expressed proteins and their fold changes yielding a predicted LPS upstream regulator from the LPS-treated microglia dataset.
Supplemental Tables 8. Ingenuity Pathway Analysis (IPA) of the differentially expressed proteins found in EtOH-treated microglia showing significantly enriched upstream regulators, canonical pathways, as well as bio- and disease functions.
Supplemental Table 9. Common differentially expressed proteins between EtOH- and LPS-treated microglia.
Supplemental Tables 1. LPS Protein Identification. Overall protein identification list (pre-Perseus), filtered protein lists with imputations (post-Perseus), and differentially expressed protein lists after Welch’s t-test are provided as supplementary information for LPS treatment compared to control.
Supplemental Tables 2. Ethanol Protein Identification. Overall protein identification list (pre-Perseus), filtered protein lists with imputations (post-Perseus), and differentially expressed protein lists after Welch’s t-test are provided as supplementary information for EtOH treatment compared to control.