

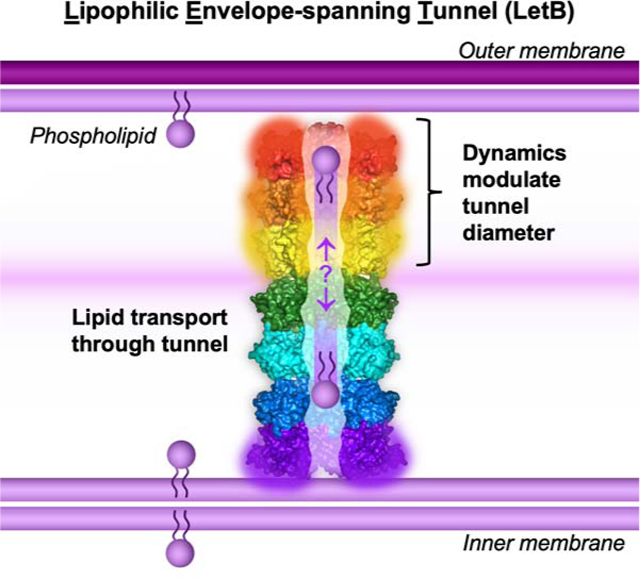
Summary
Gram-negative bacteria are surrounded by an outer membrane composed of phospholipids and lipopolysaccharide, which acts as a barrier and contributes to antibiotic resistance. The systems that mediate phospholipid trafficking across the periplasm, such as MCE (Mammalian Cell Entry) transporters, have not been well characterized. Our ~3.5 Å cryo-EM structure of the E. coli MCE protein LetB reveals a ~0.6 megadalton complex that consists of seven stacked rings, with a central hydrophobic tunnel sufficiently long to span the periplasm. Lipids bind inside the tunnel, suggesting that it functions as a pathway for lipid transport. Cryo-EM structures in the open and closed states reveal a dynamic tunnel lining, with implications for gating or substrate translocation. Our results support a model in which LetB establishes a physical link between the two membranes, and creates a hydrophobic pathway for the translocation of lipids across the periplasm.
Keywords: cryo-EM, conformational dynamics, lipid transport, bacterial cell envelope, LetB, YebT, MCE
In brief:
Structures of the open and closed states of LetB reveal seven stacked rings that span between the two membranes of Gram negative bacteria to facilitate lipid transport through the central tunnel.
Graphical Abstract
Introduction
The bacterial outer membrane (OM) constitutes a formidable barrier that protects the cell against antibiotics and other harsh environmental stresses. Understanding the machinery involved in building and maintaining the OM is critical for the development of new antimicrobials targeting these fundamental, conserved pathways. In Gram-negative bacteria, the OM is an asymmetric lipid bilayer, with a phospholipid inner leaflet and a lipopolysaccharide (LPS) outer leaflet, and this asymmetry is critical for its barrier function. To generate this barrier, membrane lipids, which are poorly soluble in water, must be transported across the hydrophilic periplasmic space between the inner membrane (IM) and OM.
Protein-based macromolecular machines have evolved unique architectures and mechanisms to transport hydrophobic molecules across aqueous spaces, such as efflux pumps and lipid/lipoprotein transporters (Konovalova and Silhavy, 2015; Okuda et al., 2016; Wang et al., 2017; Wong et al., 2019). A series of studies have unraveled how the E. coli LPS transport system employs an ABC transporter in the IM to drive movement of LPS molecules across a periplasmic bridge to an OM complex that mediates their insertion into the outer leaflet (Li et al., 2019; May et al., 2015; Owens et al., 2019; Ruiz et al., 2009; Sherman et al., 2018). How phospholipids are trafficked across the cell envelope is less well established, and MCE proteins (which contain Mammalian Cell Entry domains) have recently emerged as candidates for phospholipid transport (Casali and Riley, 2007; Ekiert et al., 2017; Isom et al., 2017). Members of this transporter family play an important role in the outer membranes of both Gram-negative bacteria (Isom et al., 2017; Malinverni and Silhavy, 2009) and Mycobacteria (Klepp et al., 2012), and are critical during host infection by various bacterial pathogens (Gioffré et al., 2005; Isom et al., 2018). Of these, the Mla system is the best characterized and has been implicated in the Maintenance of OM Lipid Asymmetry in E. coli. In contrast to the periplasmic bridge used for LPS transport, the Mla system consists of a soluble periplasmic protein (MlaC) that ferries lipids between an ABC transporter complex in the inner membrane (MlaFEDB) and a protein complex in the outer membrane (MlaA-OmpF/C) (Abellón-Ruiz et al., 2017; Ekiert et al., 2017; Hughes et al., 2018; Kamischke et al., 2019; Malinverni and Silhavy, 2009).
In the MlaFEDB complex, the MCE subunit, MlaD, forms a homohexameric ring on the periplasmic side of the IM, through which a hydrophobic tunnel was proposed to form part of the lipid translocation pathway (Ekiert et al., 2017). However, other E. coli MCE genes, such as pqiB are much larger than mlaD and encode proteins with multiple MCE domains that can create much longer architectures (Ekiert et al., 2017). MCE transport systems are ubiquitous in double-membraned bacteria and chloroplasts (Douglas and Raven, 2003), and have been implicated in the import and/or export of lipids, cholesterol or other hydrophobic molecules (Awai et al., 2006; Malinverni and Silhavy, 2009; Roston et al., 2011), suggesting that MCE proteins may have evolved different architectures and mechanisms to accommodate different hydrophobic substrates. Here, we report the high-resolution cryo-electron microscopy (cryo-EM) structure of one of the largest MCE proteins identified to date, a protein from E. coli that we name LetB for Lipophilic Envelope-spanning Tunnel B (formerly YebT; homologous to MAM-7 from Vibrio parahaemolyticus (Krachler et al., 2011)). We show that LetB forms a dynamic tunnel sufficiently long to mediate lipid transport directly between the IM and OM without the need for a shuttle protein. Thus, like LPS, phospholipids may also be transported across the periplasm by large transenvelope complexes.
Results
LetB forms a periplasm-spanning tunnel
LetB from E. coli is a large MCE gene encoded in an operon together with letA (formerly yebS), an integral inner membrane protein (Figure 1A). E. coli and Salmonella strains lacking letAB exhibit phenotypes consistent with outer membrane defects (Isom et al., 2018, 2017) (Figures S1A, B and C). LetB encodes seven MCE domains in a single polypeptide chain (MCE1 - MCE7), with an N-terminal transmembrane helix that anchors LetB to the inner membrane and is required for its function (Figure S1D). Our previous low resolution negative stain EM data showed that LetB resembles an elongated, segmented rod (Ekiert et al., 2017). To gain an understanding of how LetB may function to modulate OM integrity, we used cryo-EM to determine a high-resolution structure of LetB (residues 43–877, Figure 1A). We collected data on a Krios microscope equipped with a K2 camera (Table S1), which we processed in Relion (Fernandez-Leiro and Scheres, 2017). 2D class averages clearly show the overall arrangement of LetB, which is an elongated, hollow, hexameric structure with seven layers (Figure 1B). Extensive 3D classification, signal subtraction, and refinement schemes yielded a final set of 8 maps covering various subvolumes (Figures S1E, F and S2). The resolution of these maps ranged from ~3 – 4 Å, allowing us to build a complete structural model of LetB (Table S1, Figure S1G). After our preprint corresponding to this paper was published (Isom et al., 2019a, 2019b), another structure of LetB (YebT) was reported, with a similar overall architecture (Liu et al., 2019).
Figure 1. Cryo-EM structure of LetB.

(A) letAB operon and schematic of LetB domain organisation. The single-pass transmembrane helix (TM) is shown in black and MCE domains 1–7 in colors. The TM helix was deleted in the construct used for cryo-EM.
(B) Representative 2D class averages of LetB cryo-EM data.
(C) Topology of an MCE domain from LetB. β-strands and ⍺α-helices are depicted as arrows and rectangles, respectively.
(D) Cartoon representation of a representative MCE domain (MCE4) from LetB. Coloring of secondary structure elements corresponds to (C).
(E) MCE4 domain (colored) shown in the context of the preceding and following MCE domains (gray). Each domain is composed of a β-barrel core (green). Loops that vary significantly between domains are: β5–β6 loop (cyan), which we term pore-lining loop (PLL, see Fig. 2C), and β6–β7 loop (blue). A short helical linker (magenta) connects one domain to the next.
(F) Cartoon representation of a LetB protomer showing the linear arrangement of seven MCE domains, from the N-terminal MCE1 to the C-terminal MCE7.
(G) Surface representation of LetB. Six protomers (A-F) oligomerise laterally to form a homohexameric assembly. Each protomer runs the length of the LetB assembly. See also Figure S1, S2, Data S1 and Tables S1 and S2.
The sequences of the seven MCE domains in LetB differ considerably, with sequence identity ranging from 17% to 28% in pairwise comparisons, and the domains of LetB are also highly diverged from the other E. coli MCE proteins, MlaD and PqiB (Data S1 and Table S2). However, each MCE domain has a structurally conserved core, consisting of a seven-stranded β-barrel (Figures 1C and 1D), similar to the MCE domains of PqiB and MlaD (Ekiert et al., 2017). In addition, we identify two main regions that are variable between the structures of MCE domains (Figure 1E). The first variable region is the β6–β7 loop on the exterior surface of the β-barrel, which ranges from 9 to 15 residues in length and in which only MCE5 contains a helix. The second variable region is the β5–β6 loop, which ranges from 17 to 27 residues, with an average length of 20 residues in LetB and consists of a β-hairpin followed by a short ~two-turn helix.
The seven MCE domains of a single protomer of LetB resemble seven beads on a string (Figure 1F), with the order of the domains in the primary sequence determining the order of MCE “beads” on the string. The seven MCE domains are stacked almost directly on top of one another, and each domain is connected to the next by a short helical linker. Six copies of this linearly configured LetB protomer associate laterally to form a homohexameric assembly (Figure 1G). In the assembly, each MCE domain associates with the five other equivalent MCE domains from adjacent protomers to form a ring. The seven MCE domains lead to a final assembly of seven distinct rings, with a ring of MCE1 domains at the N-terminus and the MCE7 ring at the C-terminus (Figure 2A). These seven MCE rings that make up LetB stack to form an elongated macromolecular barrel with each protomer extending the entire length of the barrel. The N-terminal transmembrane helix of each protomer is expected to be anchored in the IM, as previously reported (Isom et al., 2017), with the MCE1 ring abutting the IM and the MCE7 ring closest to the OM.
Figure 2. LetB hexamers form a tunnel.

(A) Cartoon representation of a LetB hexamer showing 7 stacked rings, each formed from the association of six identical MCE domains.
(B) Composite model of LetB in the open state (further described in Fig. 4 and associated text), showing a tunnel running through the protein assembly. The tunnel is depicted as a smooth surface colored by the hydrophobicity of pore-facing residues, calculated using CHAP (Klesse et al., 2019).
(C) Ribbon representation of LetB. Pore-lining loops (PLLs; red) from each MCE domain form the central tunnel.
(D) Representative PLLs (PLL3 and PLL6) with pore-facing residues shown as red sticks. Most pore-facing residues are hydrophobic.
(E) Cross-section of the LetB tunnel oriented in the context of the IM and OM, with the N-terminus anchoring the complex in the IM and the C-terminus towards the OM. Grey cylinders represent transmembrane helices (TM, not present in the structure) at their expected positions. The width depicted between the IM and OM is ~220 Å, which is within the range of ~210–240 Å and based on previously measured periplasmic widths (210 Å (Matias et al., 2003) and 230 Å (Semeraro et al., 2017)), and deduced from the periplasmic spanning region of AcrAB-TolC (240 Å (Wang et al., 2017)).
See also Figure S3.
A continuous central tunnel runs through LetB, which is largely hydrophobic (Figure 2B), similar to that of the other two E. coli MCE proteins, PqiB and MlaD (Ekiert et al., 2017). Though evolutionarily unrelated, the multidrug efflux pump AcrAB-TolC forms a similarly elongated assembly in the periplasm, and uses proton motive force to transport substrates through its central tunnel out of the cell (Figure S3A). The average diameter of the LetB tunnel is ~14 Å, narrower than the tunnel running through AcrAB-TolC, but large enough for the passage of lipids and other small molecules. While in AcrAB-TolC, the tunnel is formed via the tight association of helices to form a rigid barrel, in LetB the tunnel is largely formed by the conformationally dynamic β5–β6 loops that emerge from each MCE domain, which we term pore-lining loops (PLLs) (Figures 2C and D). The length of LetB is ~220 Å, comparable to the width of the periplasmic space (Cohen et al., 2017; Graham et al., 1991; Matias et al., 2003; Semeraro et al., 2017) (Figure 2E) and to the length of the periplasm spanning region of AcrABTolC (Du et al., 2014; Shi et al., 2019). In summary, LetB is poised to serve as a tunnel for the transport of small molecules between the IM and OM by creating a bridge across the periplasm, perhaps via interactions with LetA in the IM and proteins or lipids in the OM.
Number of MCE domains determines tunnel length
The structure of LetB implies that MCE domains function as ring-shaped modular building blocks. This led us to hypothesize that in multi-domain MCE proteins, the number of MCE domains in the primary sequence specifies the number of rings stacked in the final assembly. Indeed, the primary sequences of E. coli MlaD, PqiB, and LetB consist of one, three, and seven tandem MCE domains, respectively, and structures of these three proteins revealed that they consist of one, three, and seven stacked rings (Figure 3A). To further test this hypothesis, we selected MCE proteins from other bacterial species that were predicted to contain four, five, six or eight MCE domains (Isom et al., 2017), and visualized them by negative stain EM. 2D class averages for the proteins containing four, five, and six tandem MCE domains clearly revealed multiple layers of density, consistent with barrel structures assembled from four, five, and six stacked rings, respectively (Figures 3B, S4A–S4C). The eight domain MCE protein was less stable, often resulting in smaller, likely monomeric, particles; when oligomers were formed, these contained eight stacked rings (Figures 3B, S4A–S4C). 2D class averages of the top view of all proteins revealed that they are approximately 6-fold symmetric like LetB and other MCE proteins, suggesting that they also assemble to form homo-hexamers (Figure S4A). Overall, these data indicate that MCE domains are modular building blocks of larger proteins, with each domain in the primary sequence specifying one ring in the resulting structure. From the 2D classes of these proteins and our structures of MlaD (1 ring), PqiB (3 rings), and LetB (7 rings), we estimated the lengths of the one, three, four, five, six, seven, and eight ring MCE barrels to be ~25, ~95, ~140, ~165, ~190, ~220, and ~260 Å, respectively. Thus, naturally occurring MCE proteins have evolved to form barrels with a range of lengths, perhaps in part to adapt to differences in the mean periplasmic width in different species and to accommodate larger or smaller interacting complexes in the IM or OM.
Figure 3. MCE domains are modular building blocks that determine the length of MCE protein assemblies.

(A) Cartoon representations of E. coli MCE proteins MlaD (PDB ID: 5UW2), PqiB (PDB ID: 5UVN) and LetB, which contain one, three and seven MCE domains, respectively, and form architectures with the corresponding number of rings.
(B) Negative stain EM 2D class averages of naturally occurring proteins encoding four (Desulfocapsa sulfexigens), five (Nitrincola nitratireducens), six (Pseudomonas aeruginosa), seven (E. coli, LetB), and eight (Denitrovibrio acetiphilus) MCE domains (Figure S6). Schematics to the left of 2D class averages indicate number of MCE domains present in the gene (rectangles) and expected number of rings based on modularity of MCE domains (ovals).
(C) Truncated constructs designed to modulate number of MCE rings in LetB and their expected length in the context of the periplasm. As the number of LetB domains is reduced, distance to OM is predicted to increase. Color coding is the same as in (A); see STAR Methods for rationale of construct design.
(D) Negative stain EM 2D class averages of LetB truncation mutants depicted in (C), but with the TM helix deleted for each mutant. Domain organization of the gene is shown to the left of the 2D class average. The 2D class average for the 7-ring protein is the same as the 7xMCE class in (B).
(E) Cellular assay for the function of LetB truncation mutants depicted in (C). 10-fold serial dilutions of the indicated cultures spotted on plates containing LSB and incubated overnight. The pqiAB letAB double knockout grows poorly in the presence of LSB, but can be rescued by the expression of letAB constructs containing letB encoding five, six, or seven (WT) MCE rings. Expression of constructs with letB containing two, three, or four rings fail to rescue. Growth of the strain complemented with the 6-ring mutant is reproducibly increased relative to the strain complemented with WT. Growth of all strains are unaffected on control plates containing LB only (see Figure S4F). Expression of LetB can be detected in vivo for all constructs, and expression of BamA, as a measure of envelope stress, is consistent in all strains (see Figure S4H).
See also Figure S4.
Length of LetB affects its function in vivo
Given that the length of MCE proteins varies with the number of MCE domains, and the length of LetB is approximately the same as the reported width of the periplasm in E. coli (Cohen et al., 2017; Graham et al., 1991; Matias et al., 2003; Semeraro et al., 2017), we hypothesized that LetB may physically bridge the gap between the IM and OM, creating a continuous path for lipid transport. If this model is correct, then the length of LetB would be important for its function. To test this hypothesis, we engineered shorter mutant forms of LetB, which contained two, three, four, five or six MCE domains instead of seven, as in the wild-type protein (Figure 3C, see STAR Methods for rationale of mutant design). To assess if these engineered mutants were folded and assembled into shorter barrels of the expected size, we overexpressed and purified each mutant, and imaged the proteins by negative stain EM. 2D classification revealed that all of the LetB truncation mutants folded and homo-hexamerized to form the expected number of rings (Figures 3D, S4D and S4E).
To assay the function of these shorter LetB variants, we took advantage of a genetic interaction between pqiAB and letAB mutants. Disruption of pqiAB results in a moderate growth defect in the presence of the detergent lauryl sulfobetaine (LSB), while the growth of a letAB mutant is unaffected (Isom et al., 2017). However, disruption of letAB in combination with pqiAB (pqiAB letAB double knockout) significantly exacerbates LSB sensitivity, and complementation with wild-type letAB from a plasmid relieves this exacerbation, as previously described (Isom et al., 2017) (Figure S1C). We used this complementation assay to assess whether or not the shorter LetB variants in a plasmid can also relieve the exacerbated phenotype of the pqiAB letAB double knockout. In the presence of LSB, LetB mutants that were five and six rings in length restored growth of the pqiAB letAB knockout to levels comparable or even greater than the WT, indicating that a five or six-ring form of LetB is functional (Figure 3E). In contrast, LetB variants that are four, three and two rings in length were unable to restore growth of the pqiAB letAB knockout in the presence of LSB. This indicates that these proteins are non-functional (Figure 3E and S4G), despite being stable and properly folded in vitro (Figures 3D, S4D and S4E). As the four-ring mutant was the longest variant of LetB unable to restore growth in our complementation assay, we tested two other four-ring mutants containing rings 1–2-3–7 and 1–34-7. The 1–2-3–7 mutant folded poorly as assessed by negative stain EM, while the 1–3-4–7 mutant folded and assembled into hexamers. Both the 1–2-3–7 and 1–3-4–7 mutants did not restore growth in the complementation assay (Figure S4D, E and G). Together, the data for all four-ring mutants (1–5-6–7, 1–2-3–7, and 1–3-4–7) support a model in which variants shorter than 5 rings in length do not function in cells. These results are consistent with the idea that the length of LetB may be one important factor for its function, possibly reflecting a minimum length required to bridge the distance between the IM and OM.
Conformational dynamics modulate tunnel diameter
Our cryo-EM density map showed that the local resolution varied considerably between different regions of LetB: higher in the vicinity of rings 2–4, which are well ordered, and lower in the vicinity of rings 1, 5, 6, and 7 (Figures 4A and S1E). One possibility was that conformational heterogeneity was leading to lower resolution. To tease apart different conformations, we explored multi-body refinement (Nakane et al., 2018) and 3D variability analysis (Punjani et al., 2017), which showed the flexibility of the overall structure (Movie S1). Using several masking and signal subtraction strategies (Figure S2), we identified 8 classes ranging from 2.96 Å to 3.78 Å resolution, capturing the conformational dynamics of the sample. Rings 1, 5, 6 and 7 show multiple discrete conformational states, while rings 2, 3 and 4 are relatively rigid and are resolved in one conformation (Figures 4B, S1E, S2 and Movie S2). We focus our analysis here on the two most distinct conformational states, in which the central tunnel is either open or closed.
Figure 4. Conformational dynamics showing open and closed states of LetB.

(A) Local resolution of the LetB density map before 3D classification and local refinement.
(B) Movement of the α-carbons between the composite models of the closed and open states. Trajectories indicate displacement between Cα in the closed Vs. open states; shorter, gray lines indicate minimal displacement and longer, red lines indicate larger displacement. Larger movements are primarily seen for rings 1, 5, 6 and 7, but not rings 2–4. Side view of intact LetB is shown on the left, and top views of each ring on the right.
(C) Schematic representation of domain and PLL movements observed in rings 1, 5, 6 and 7 from the open (green) to the closed (magenta) states, with axis of rotation represented as black dots.
(D) The orientation of the domains (top) and PLLs (bottom) for ring 6 in open (green) and closed (magenta) states, viewed as a cross-section from the side, and from the top (only PLLs colored). Orientation of black boxes track with the orientations of the core domain, illustrating rotation of the domain.
(E) Radius of the tunnel in open (green) and closed (magenta) states, measured using CHAP (Klesse et al., 2019).
(F) Phosphatidylethanolamine (PDB ID: 6OU) manually docked in the center of the pore illustrates the size of a typical phospholipid compared to the pore diameter in the open and closed states. No density is observed for the lipid in our structures.
The configuration of the open and closed states is controlled primarily by two factors. First, the individual MCE domains from rings 1, 5, 6 and 7 undergo pivoting motions about axes through each MCE domain (Figure 4C). Second, the PLLs of rings 1, 5, 6 and 7 shift, resulting in dilation and constriction of the corresponding pores, resembling the opening and closing of a camera diaphragm (Figure 4D). The PLLs exhibit an additional layer of flexibility: within a given state (closed or open) the PLLs can likely adopt different conformations, as evidenced by additional loop-like densities in PLLs 5 and 7 (Figure S5A). Consistent with the observation that PLLs are flexible, a crystal structure we determined of the monomeric MCE2-MCE3 domains (residues 159–383) at 2.15 Å resolution (Table S3) also revealed flexibility in the PLLs. The PLL is entirely disordered in MCE2 and adopts a significantly different conformation in MCE3 (Figures S5B–S5F), while the core MCE domains from the crystal structure are in good agreement with the EM structure. Our data suggest that while the tunnel may have a propensity to be in a more closed or more open conformation, which we were able to separate as discrete conformations, the PLLs are fluid in nature regardless of the overall conformation of the tunnel. These loop dynamics may facilitate the movement of molecules through the tunnel, and provide some plasticity to allow substrates of differing sizes to be accommodated. Substrates may include the diacyl phospholipids phosphatidylethanolamine (PE) and phosphatidylglycerol (PG), larger phospholipids such as cardiolipin, or perhaps other substrates yet to be identified. Interestingly, re-analysing our published cryo-EM dataset of MCE protein PqiB (Ekiert et al., 2017) PDB ID: 5UVN, (Ekiert et al., 2017) with newer versions of Relion (Fernandez-Leiro and Scheres, 2017) revealed similar conformational changes in this smaller, three-ring barrel (Movie S3 and Figure S3B), which result in modulation of the central pore diameter, as observed for LetB (Figures 4E and S3B).
The opening and closing of the central pore through each MCE ring could also play a role in tunnel gating and translocation of substrates. Atomic-level conformational changes are known to be important for substrate translocation in several systems such as AcrAB-TolC and the LPS transporter. Opening and closing of the periplasmic tunnel in AcrAB-TolC has been observed (Du et al., 2014), and has been proposed to be involved in the regulation of transport activity. Similarly, conformational changes in a periplasmic component of the LPS transporter have been implicated in modulating substrate transport (Owens et al., 2019). The conformational states we observe here may analogously play a role in the transport function of LetB. In E. coli, PE and PG constitute the bulk of the phospholipids in the OM (Dowhan, 1997; Gidden et al., 2009), and we have previously shown that LetB binds both PE and PG (Ekiert et al., 2017). In the open state, the LetB tunnel is sufficiently wide to allow the passage of PE or PG from ring 1 to ring 6 (diameter of lipids ~9 Å assuming a surface area of at most ~62.8 Å, (Murzyn et al., 2005)) (Figure 4E). Docking these lipids into the pore of ring 6 reveals that in the open state these lipids are easily accommodated, while in the closed state their passage is restricted (Figure 4F). The pore of ring 7 is narrower in both the closed and open states, and may restrict the flux of lipids to or from the OM. The density is weak for the tips of PLL7, where the tunnel is narrowest in ring 7, suggesting that these loops are very flexible and loop dynamics may facilitate lipid passage through the constriction. Conformational dynamics may additionally be modulated by binding partners such as LetA, or other subunits yet to be identified.
Pore-lining loops (PLLs) play a key role in LetB function
Since each PLL contributes to the formation of a dynamic, hydrophobic tunnel (Figure 2B), we hypothesized that these loops may be essential for LetB function. To test this, we generated LetB PLL deletion mutants in which the β-hairpin motif of each PLL was deleted (Figure 5A). To determine whether these mutants were functional in a cellular context, we assessed whether these mutants could relieve the exacerbated phenotype of a pqiAB letAB double mutant in the presence of LSB, using the assay described above. None of the LetB PLL mutants restored growth in the presence of LSB (Figure 5B). Negative stain EM revealed that ΔPLL2 and ΔPLL3 mutants form stable hexameric structures similar to the WT protein (Figure 5C), while the other mutants appeared to be destabilized to some degree, as they assembled into hexameric structures at a lower frequency, or not at all (Figures S7A–S7C). Strikingly, 2D class averages of both ΔPLL2 and ΔPLL3 show a loss of density where the corresponding porelining loops were deleted (Figure 5C), indicating that there is a gap in the wall of the tunnel.
Figure 5. LetB tunnel is critical for function.

(A–C) Effect of PLL deletions on LetB structure and function.
(A) PLL regions deleted in LetB mutants (red) shown in the context of a LetB protomer. Seven mutants were made; in each the red region of a single PLL was deleted.
(B) Cellular assay for the function of LetB PLL deletion mutants. 10-fold serial dilutions of the indicated cultures spotted on plates containing LSB and incubated overnight. The pqiAB letAB double knockout grows poorly in the presence of LSB, but can be rescued by the expression of letAB constructs containing WT letB. Expression of constructs with letB PLL deletion mutants fail to rescue. Growth of all strains are unaffected on control plates containing LB only (see Figure S6A). Expression of LetB can be detected in vivo for all constructs, and expression of BamA, as a measure of envelope stress, is consistent in all strains (see Figure S6B).
(C) Negative stain 2D class averages of ΔPLL2 and ΔPLL3 mutants. Yellow arrows indicate missing density at the site of deletion. A predicted structure of the hexamer is shown to the left of each 2D class average, in which the PLLs are in red and the deleted amino acids have been deleted from the model.
(D–E) Effect of point mutations in PLL2 and PLL3 on LetB structure and function.
(D) Mutated hydrophobic residues are shown as red spheres in the context of the tunnel (top) and zoomed in on each MCE domain (bottom).
(E) Cellular assay for the function of LetB with mutations in hydrophobic motifs. Results depicted as in part (B) above. Expression of constructs with indicated letB point mutations fail to rescue growth. Growth of all strains are unaffected on control plates containing LB only (see Figure S6C). Expression of LetB can be detected in vivo for all constructs, and expression of BamA, as a measure of envelope stress, is consistent in all strains (see Figure S6D).
(F) Negative stain EM 2D class averages for each point mutant, showing similar structural organisation as the wild type.
Since our results show that ΔPLL2 and ΔPLL3 are folded yet functionally impaired, we asked whether specific amino acid residues within PLL2 and PLL3 may play important roles in LetB function. An analysis of PLL sequences showed that each PLL contains a conserved hydrophobic motif, ΦxxΦΦ (Φ denotes a hydrophobic residue, x denotes any residue), which faces the tunnel interior. A similar hydrophobic motif is also observed in the MCE protein MlaD, and is important for function (Ekiert et al., 2017). To test if these residues also play a functional role in LetB, we generated six point mutants: L243N, L246N, V247N in PLL2 and L355N, L358N, L359N in PLL3 (Figure 5D). Our complementation assay showed that none of these mutants are able to relieve the exacerbated phenotype of a pqiAB letAB double mutant in the presence of LSB (Figure 5E), suggesting that each point mutation in the hydrophobic motif of PLL2 or PLL3 is sufficient to disrupt LetB function. Negative stain EM analysis of recombinantly produced mutants shows that each mutant is well-folded and assembled into a hexameric structure similar to the wild type (Figures 5F, S7D and S7E), suggesting that the observed phenotypes likely correspond to a loss of function and not destabilization of the proteins. Together, our results suggest that the intact hydrophobic tunnel lining formed by the PLLs is important for LetB function.
Substrates are bound in the tunnel of LetB
Our data point to a model in which LetB transports substrates between the IM and OM through a central tunnel. Previous work has demonstrated that both LetB and its homologs are phospholipid-binding proteins (Awai et al., 2006; Ekiert et al., 2017; Krachler et al., 2011; Thong et al., 2016). However, it is unknown precisely where phospholipids or other substrates interact with LetB, and whether the interior of the tunnel is indeed part of the transport pathway. To assess whether potential substrates such as phospholipids are present in the tunnel, we developed a crosslinking-based approach to identify the locations of substrate-binding sites within LetB. To avoid detection of phospholipids non-specifically bound to the transmembrane regions, we used a soluble LetB construct with the TM helix deleted. We site-specifically incorporated the unnatural photocrosslinking amino acid p-benzoyl-L-phenylalanine (BPA) at multiple locations within LetB using amber stop codon suppression and an orthogonal aminoacyl-tRNA synthetase/tRNA system in E. coli (Chin et al., 2002). UV irradiation of the sample leads to crosslinking of BPA to C-H bonds of potential substrates nearby. To facilitate detection of these crosslinked adducts, E. coli cultures were grown in the presence of 32P orthophosphate, leading to labelling of bulk phospholipids and other phosphate-containing molecules. Thus crosslinking-dependent 32P association with LetB would be consistent with phospholipids being in close proximity to the site of BPA incorporation. As BPA is a bulky amino acid that is somewhat larger than tryptophan, we targeted all of the sites in the tunnel that presented bulky side chains facing the lumen for individual replacements with BPA (F468, W476, Y814, F818, F833) (Figure 6A). In parallel, we designed mutations on the exterior, periplasm-facing surface of LetB where we hypothesized that phospholipids would not be present (K488, E854) (Figure 6A).
Figure 6. Substrates bind in the center of the LetB tunnel.

(A) Residues in LetB that were mutated for incorporation of photo crosslinking amino acid, BPA are shown as spheres (red, inside the tunnel; or blue, outside the tunnel).
(B) SDS-PAGE analysis of purified LetB and BPA mutants, either crosslinked or uncrosslinked and stained by Coomassie (protein) or phosphor-imaged (32P signal). All mutants and the WT control are lacking the TM helix.
See also Figure S7.
After crosslinking in E. coli lysates, we purified the LetB protein by affinity chromatography, separated samples by SDS-PAGE, and detected LetB protein and associated phospholipids by Coomassie staining and a phosphorimager, respectively. Strong 32P association with LetB was detected at all five sites of BPA incorporation inside the tunnel (Figures 6B and S7F), while minimal 32P association was detected at locations on the exterior surface of the tunnel. Thus, phospholipids or other 32P containing substrates are specifically present inside the LetB tunnel.
Discussion
Our data support a model wherein LetB serves as a tunnel to mediate lipid transport (Figure 7), providing a shielded environment for hydrophobic lipids to traverse the hydrophilic periplasm and the peptidoglycan (Figure S3C). LetB is sufficiently long to span the gap between the inner and outer membranes, and may physically interact with lipids and/or proteins in both membranes simultaneously. Consequently, the hydrophobic tunnel running the length of LetB may create a continuous pathway between the lipid environments of the IM and OM. To facilitate lipid insertion and extraction from membranes, it is likely that protein complexes in the IM and OM will also play a role. Indeed, the integral membrane protein LetA, which is encoded in the same operon as LetB, is a candidate to fulfill this role in the IM, while the existence of an OM complex remains hypothetical at this point.
Figure 7. Model for LetB function in lipid transport.

LetB forms a tunnel capable of spanning the periplasm, potentially interacting with LetA in the IM and unknown partners in the OM. Rings 1, 5, 6 and 7 are dynamic and adopt open and closed states (indicated by blurring). Lipids are transported through the tunnel, though the direction of transport remains unknown. Two other lipid transport systems in E. coli are depicted: 1) The LPS transport system, which is composed of Lpt proteins (PDB IDs: 5iv9, 2r1a and 6mit), forms a bridge between the two membranes along which LPS is transported; and 2) The Mla system, another MCE-protein family member (PDB IDs: 5nup, 5uwa and EMD 8610), which is composed of IM and OM complexes, and a soluble protein, MlaC, which “ferries” lipids across the hydrophilic periplasm. These three systems employ fundamentally different mechanisms for lipid transport, analogous to tunnels, bridges, and ferries.
This tripartite organisation (IM, periplasmic, and OM subunits) is a common feature of many transenvelope transport systems, where complexes in the IM and OM mediate the movement of substrates in, out, or across the membranes, while the periplasmic components facilitate transport in between. While in LetB, a single polypeptide is capable of spanning the periplasm, several other systems bridge the inner and outer membranes via protein-protein interactions of different subunits, and are evolutionarily unrelated to the MCE protein family. Among these are the Lpt system, which uses ATP hydrolysis to translocate the glycolipid LPS across an open, solvent exposed “bridge” of LptA proteins towards a protein complex in the OM (Botos et al., 2016; Dong et al., 2017; Konovalova and Silhavy, 2015; Luo et al., 2017; Okuda et al., 2012; Ruiz et al., 2008; Sperandeo et al., 2007, 2008; Suits et al., 2008; Tefsen et al., 2005; Wu et al., 2006) (Figure 7). In contrast, other transenvelope transport systems employ a soluble periplasmic “ferry” protein to shuttle substrates between complexes in the IM and OM, as has been proposed for the lipoprotein export system Lol (Konovalova and Silhavy, 2015), and a subset of MCE transporters, such as Mla (Ekiert et al., 2017) (Figure 7). Thus, while “bridges” of LptA are used for LPS transport, the MCE family of transporters appears to employ at least two distinct strategies - ferries and tunnels - for periplasmic transport of phospholipids.
In contrast to the Lpt system, whose function is well established as an exporter of LPS, the direction of transport mediated by MCE systems is less clear, as are the particular lipid species transported by the diverse MCE systems encoded in bacterial genomes. Whether these systems act on different substrates, under different environmental conditions, or perhaps even drive transport in different directions, remain open questions. While the membrane protein LetA may be predicted to fulfill a role similar to the ABC transporter permease MlaE, they appear to be evolutionarily unrelated, and may therefore function very differently from one another. Indeed, there is no evidence thus far that the Let system is driven by ATP hydrolysis, and we cannot rule out that other energy sources may be coupled to transport. Alternatively the Let system may allow passive equilibration of lipids between the IM and OM, in a manner conceptually similar to the sites of IM-OM hemifusion that were proposed over 50 years ago (Bayer, 1968), but could potentially be mediated by transenvelope protein complexes instead of direct interaction of the IM and OM to facilitate lipid exchange. Our studies presented here provide insights into the architecture and mechanism of LetB, which forms a dynamic tunnel poised to transport lipids across the periplasm.
STAR Methods
Lead Contact and Material Availability
Plasmids generated in this study have been deposited in Addgene (Addgene ID: 139874 – 139930). Further information and requests for resources and reagents should be directed to and will be fulfilled by the Lead Contact, Gira Bhabha (gira.bhabha@gmail.com).
Experimental Model and Subject Details
All bacteria were grown in LB medium (Difco) or on LB plates (Difco broth supplemented with 1.5% nutrient agar) and incubated at 37°C. For strains harboring a plasmid, the liquid med ium was supplemented with 100 μg/ml carbenicillin.
Method Details
Phenotypic assays for MCE mutants in E. coli
All mutants were constructed in the background of E. coli K-12 BW25113. Bacteria were grown in LB medium (Difco) or on LB plates (Difco broth supplemented with 1.5% nutrient agar) and incubated at 37°C. For strains harbouring a plasmid, the liquid me dium was supplemented with 100 μg/ml carbenicillin. Strains with deletions of pqiAB and/or letAB were constructed in a previous study (Isom et al., 2017). To test the function of various LetB mutants, the WT letAB operon from BW25113 was cloned into pET17b, and leaky uninduced expression of LetAB from this plasmid was sufficient to complement a letAB chromosomal deletion. LetB mutations of interest were introduced into this plasmid carrying both letA and letB, yielding a construct that expressed WT LetA and the desired LetB mutant (including the TM helix). To test for functional complementation, 10-fold serial dilutions of overnight cultures of the relevant strains were prepared in a microtiter plate, and a multichannel pipette was used to spot 2 μl of each dilution to LB agar plates supplemented with sodium cholate (8%, Sigma Aldrich), sodium deoxycholate (4%, Sigma Aldrich), or lauryl sulfobetaine (LSB; (1%, Sigma Aldrich). The growth phenotypes in the presence of LSB are sensitive to at least these three aspects of the media preparation: 1) the LSB was dissolved in water to form a stock of 20% (w/v) that was aliquoted and frozen until further use, 2) the LB agar was made using LB broth mix (Difco) plus the addition of bacteriological agar (Difco), as opposed to the use of an LB agar mix and 3) sufficient cooling of LB agar to approximately 60 °C prior to the additio n of LSB. Plates were incubated overnight at 37 C, then photographed using a GelDoc system (Bio-Rad). At least three independent colonies were used to perform replicates for each phenotypic assay.
Expression and purification of LetB
DNA corresponding to LetB lacking its TM region (residues 43–877) was amplified from the MG1655 genome and cloned by Gibson assembly into a custom pET vector (pBEL587) resulting in a C-terminal 6xHis tag, for cytoplasmic expression. The resulting plasmid (pBEL1324) was transformed into Rosetta 2 (DE3) cells (Novagen). For expression, overnight cultures of Rosetta 2 (DE3)/pBEL1324 were diluted 1:100 in LB (Difco) supplemented with carbenicillin (100 μg/mL) and chloramphenicol (38 μg/mL) and grown at 37 °C with shaking to an OD600 of 0.9, then induced by addition of IPTG to a final concentration of 1 mM and continued incubation overnight shaking at 15 °C. Cu ltures were harvested by centrifugation, and the pellets were resuspended in lysis buffer (50 mM Tris pH 8.0, 300 mM NaCl, 10 mM imidazole). Cells were lysed by two passes through an Emulsiflex-C3 cell disruptor (Avestin), then centrifuged at 38,000 xg to pellet cell debris. The clarified lysates were incubated with NiNTA resin (QIAGEN) at 4 °C, which was subsequentl y washed with Ni Wash Buffer (50 mM Tris pH 8.0, 300 mM NaCl, 10 mM imidazole) and bound proteins eluted with Ni Elution Buffer (50 mM Tris pH 8.0, 300 mM NaCl, 250 mM imidazole). LetB containing fractions eluted from the NiNTA column were pooled and concentrated before separation on a Superdex 200 16/60 gel filtration column (GE Healthcare) equilibrated in 20 mM Tris pH 8.0 and 150 mM NaCl.
All mutant forms of the LetB with the TM helix deleted were produced by introducing the target mutation into pBEL1324 by site-directed mutagenesis and Gibson assembly of the resulting PCR products, and purified following similar procedures.
Design of LetB length variants with varying numbers of MCE rings
In order to test the impact of tunnel length on LetB function, we set out to design shorter LetB derivatives consisting of two, three, four, five, or six MCE rings (vs seven rings in WT LetB). The challenge was to remove entire ring modules from LetB without disrupting the folding of adjacent rings, such that the variants would still fold, hexamerize, and form stable complexes with a range of tunnel lengths. For all mutant constructs, rings 1 and 7 were left intact, to preserve possible interactions with the inner and outer membranes/membrane proteins. Internal ring deletions were guided by our cryo-EM structure of LetB. First, the structure revealed that the interfaces between each ring in the stack are small and are formed by relatively flexible elements, primarily by short helical linkers that connect the MCE domains together with smaller interactions made by the tips of the PLLs (Fig. 1E). Thus, we inferred that an independently folding structural module for each ring would most likely include the core MCE domain, its PLL, and the helical linker that follows it on the C-terminal side (Fig. 1, C and D), and therefore we targeted complete structural modules for deletion. Second, the conformational states observed in our structures suggested that the internal rings formed two groups: a rigid group (rings 2, 3, and 4) and a dynamic group that samples different conformations (rings 5 and 6). Using this knowledge as a guide, we designed constructs to preserve these groups of rings where possible. In order to make a four ring protein by removing three rings, we hypothesized that removing rings 2, 3, and 4 would be most likely to result in a stable complex; similarly, in order to make a five ring protein by removing two rings, we hypothesized that removing rings 5 and 6 would be least perturbing. For other variants, it was necessary to breakup one module or the other. In order to make a six ring protein by removing a single ring, we decided to remove either ring 5 or 6, since the dynamic nature of these rings implied that the interfaces between the rings are more flexible and might better tolerate perturbation (we opted to remove ring 6). Based upon the logic regarding the flexibility of rings 5 and 6, we created a three ring protein by removing four rings: the entire rigid module (ring 2, 3, and 4) plus the adjacent ring 5. This allowed us to a) avoid breaking up the rigid module and b) create only one “new” ring-ring interface (between rings 1 and 6, preserving the native interface between rings 6 and 7.
Western blots of strains used in complementation assays
In order to test for expression of protein in the strains used for the complementation assays, 10 ml cultures of E. coli strains ΔpqiAB, ΔpqiAB ΔletAB and ΔpqiAB ΔletAB containing each complementation plasmid was grown to an OD of 0.6–0.8. The cells were pelleted at 4000 g for 10 mins and resuspended in 1 ml of freeze thaw lysis buffer (PBS, 1 mg/ml lysozyme, 0.5 mM EDTA and 1 μl/ml of benzonase (Millipore)), and incubated on ice for 1 hour. The samples underwent 8 cycles of freeze-thaw lysis by alternating between liquid nitrogen and a 37 °C heat block. After lysis, the cells were pelleted at 23,000 g for 15 minutes and the pellets were resuspended in 40 μl of 2xSDS-page loading buffer. 10 μl of each sample were separated on an SDS-PAGE gel and transferred to a nitrocellulose membrane. The membranes were blocked in PBST containing 5% milk for 1 hour. The membranes were then incubated with primary antibody in PBST + 5% milk (either rabbit polyclonal anti-LetB (YebT) at a dilution of 1:1000 or rabbit polyclonal anti-BamA at a dilution of 1:2000) overnight at 4 °C. The membranes were then washed 3 times with PBST and were incubated with anti-rabbit HRP conjugated secondary antibody (GE Healthcare) in PBST + 5% milk for 1 hour. The membranes were then washed 3 times with PBST and incubated with ECL (Thermo Fisher Scientific) substrate and developed using autoradiography film (Denville).
Negative stain electron microscopy of LetB
To prepare grids for negative stain EM, the sample was applied to a freshly glow discharged carbon coated 400 mesh copper grids and blotted off. Immediately after blotting, a 2% uranyl formate solution was applied for staining and blotted off. The stain was applied five times for each sample. Samples were allowed to air dry before imaging. Data were collected on a Talos L120C TEM (FEI) equipped with a 4K x 4K OneView camera (Gatan) at a nominal magnification of 73,000x corresponding to a pixel size of 2.00 Å /pixel on the specimen, and a defocus range of 1 – 2 uM underfocus. Data processing was carried out in Relion 3.0 (Fernandez-Leiro and Scheres, 2017). Micrographs were imported, particles were picked manually followed by automated template-based picking. Several rounds of 2D classification were carried out using default parameters, except for the offset search range and offset search step, which were adjusted to 60 and 5 pixels, respectively. At least two replicates were performed for negative stain EM of each sample, starting from expression of recombinant protein.
Cryo-EM grid preparation and data collection
After size exclusion chromatography on a Superdex 200 column (see Expression and Purification above), LetB was concentrated to 2 mg/mL. 3 μL of LetB at a final concentration of 0.5 mg/mL was applied to 400 mesh quantifoil 1.2/1.3 grids. The sample was then frozen in liquid ethane using the Vitrobot Mark III. Images were collected on a Titan Krios microscope (“Krios 2”) located at the HHMI Janelia Research Campus, operated at 300 kV and equipped with a Gatan K2 Summit direct electron detector camera. Images were recorded using SerialEM (Mastronarde, 2005) at a nominal magnification of 22,500x, corresponding to a pixel size of 1.31 Å. Further data collection parameters are shown in Table S1.
Cryo-EM data processing
Movies were drift corrected using MotionCor2 (Zheng et al., 2017) and CTF estimation was performed using GCTF (Zhang, 2016). Data were processed with Relion 2.1 (FernandezLeiro and Scheres, 2017; Kimanius et al., 2016) unless otherwise stated, and the data processing workflow is described in Figure S2. ~1,000 particles were selected manually and subjected to 2D classification. The resulting class averages were used as templates for subsequent automated particle picking. After 2D classification, 534,003 particles were selected from the 732,231 auto-picked particles and used for a first round of 3D classification. The map obtained from a reconstruction of the negatively stained sample (Ekiert et al., 2017) (EMDB ID: EMD-8611) was used as a reference for initial 3D classification into three classes named cl_1 to cl_3 (left side of Figure S2). The class cl_1 with 226,082 particles led to a reasonable map with the expected size, which was selected for further processing. Maps from the other two classes were poorly defined, especially at the two ends of LetB, and were temporarily discarded. The best map was refined to ~3.25 Å with a C6 symmetry and its local resolutions were estimated using blocres (kernel = 24 pixels) from Bsoft (Heymann and Belnap, 2007). The following strategies were used to improve resolution, and refinements were carried out in parallel with C6 symmetry imposed or no symmetry imposed (C1) for several maps. Final maps are with C6 symmetry imposed.
First, 3D classification into five classes of the whole map was performed. This resulted in classes dominated by different conformations in rings 5 to 7. In two of these classes, rings 5 to 7 adopt a closed conformation, and in two other classes, those rings adopt an open conformation where the tunnel diameter is larger. In the remaining class (cl_1.4 in Figure S2), density for ring 1 was not visible and was weak even when the map was refined with no enforced symmetry.
Second, to improve the local resolution and analyze conformational heterogeneity, we masked, refined and classified different parts of the density map. Different sizes and types of masks were explored. The regions of interest were masked out and the projection of the highresolution map subtracted from the micrographs. Iterative 3D classification and refinement was carried out as shown in Figure S2. The masking and signal subtraction of three consecutive rings was optimal, while refinement and classification of density corresponding to individual rings or of the pore-lining loops forming the central pore resulted in misalignment and poor resolution.
Finally, we investigated whether the resolution could be improved or new classes found by recovering the particles rejected by the initial 3D classification and using the maps obtained as starting references (right side of Figure S2). The whole process was repeated with the 534,003 particles originally selected after 2D classification instead of 226,082 and we thereby managed to further improve the resolution of the masked maps in the closed state.
The resolution of the best maps selected for de novo modelling varies from 2.96 Å to 3.78 Å. For each map, the overall resolution was estimated using the gold-standard Fourier Shell Correlation criterion (FSC=0.143). The FSC curves were calculated using soft masks and applying the masking-effect correction previously described (Chen et al., 2013). The 3D FSC were computed using the “Remote 3DFSC Processing Server” at https://3dfsc.salk.edu/ (Tan et al., 2017). The local resolution maps were computed using Bsoft (Heymann and Belnap, 2007).
To further analyze the relative movements of the MCE domains, we ran multi-body refinements in Relion 3.0-beta (Nakane et al., 2018) using model 1 (from map 1) of LetB. We tried non-overlapping masks of the 7 individual rings as well as masks of two consecutive rings with a one-ring overlap. Masking two consecutive rings with a one-ring overlap gave results that were interpretable. We also imported particles into CryoSparc v2.9 (Punjani et al., 2017) to compute a 3D variability analysis using the map 1 obtained after 3D classification. Results are shown in Movie S1.
Model building
The MCE domain of MlaD (PDB ID: 5UW2) (Ekiert et al., 2017), was used to assign the hand of our LetB density map, and as a starting point for model building. The MlaD coordinates were initially fit into the density of the best resolved domain of LetB, (ring 3). The sequence was mutated to match that of ring 3 and residues were manually adjusted in COOT (Emsley et al., 2010). The same process was repeated for all the other rings but using the model obtained for ring 3 as a reference. For each of the seven LetB rings, the initial model was built using the density map with the highest resolution (i.e. the masked map of the closed conformation for rings 1, 5, 6 and 7, and the wider masked density map for rings 2 to 4). The models were then subjected to the real_space_refine algorithm in PHENIX (Adams et al., 2012) using 1 to 5 cycles and 50 to 100 iterations to optimize the fit and reduce clashes. These models were iteratively rebuilt in COOT then refined in PHENIX until completion. The models refined against these first maps were then fit into all the other maps and underwent rebuilding and refinement to model the observed alternative states of LetB.
The PLL from each MCE domain emerges towards the lumen of the tunnel. As each loop roughly adopts a β-hairpin conformation, one would expect to observe two densities for each MCE domain (one corresponding to each strand of the β-hairpin), or 12 total densities for each hexameric MCE ring. However, for ring 5 in the open conformation, and for rings 2, 4, and 7, 18 densities are visible in each ring, as was observed for some of the rings of PqiB (Ekiert et al., 2017). Due to the lower resolution of this part of the map, we were unable to identify whether the extra density corresponds to a bound substrate (such as a lipid), or flexibility of the loops which may adopt multiple conformations. Since masking and 3D classification were unable to separate out different states or improve the maps, we built a single conformation of each loop through the densities that yielded the most sterically plausible final models.
We also generated composite models of LetB corresponding a fully closed (where the pores of the MCE1, 5, 6, and 7 rings are simultaneously all in their most constricted/closed state) and open state (where the pores of the MCE1, 5, 6, and 7 rings are simultaneously all in their most dilated/open state). As our classification and signal subtraction approaches generally divided LetB into three-ring modules, it is unclear if these fully open and fully closed states are well populated, or if some rings may adopt an open state at the same time others are closed. However, we find these models best illustrate the extent of the conformational changes in the transport tunnel. The composite closed model was created by combining the models built into map 5 (rings 1 and 2), 4 (rings 3 and 4), 3 (rings 5 to 7) and 1 (4 residues linking rings 4 to 5). The composite open model was created by combining the models built into map 8 (rings 1 and 2), 7 (rings 3 and 4), 6 (rings 5 to 7) and 2 (4 residues linking rings 4 to 5).
Statistics regarding the final models (Table S1) were extracted from the results of the real_space_refine algorithm as well as the the MolProbity (Chen et al., 2010) and EMRINGER (Barad et al., 2015) functions as implemented in the PHENIX package (Adams et al., 2012). To display the movements between the closed and open configuration, we modified the ColorByRMSD plugin from pymol (pymolwiki.org/index.php/ColorByRMSD). To analyze the radii of the central pores, the CHAP software (Klesse et al., 2019). Molecular graphics and analyses were performed with either the UCSF Chimera package (Pettersen et al., 2004; Smart et al., 1993) or the Pymol Molecular Graphics System (version 2.0 Schröodinger, LLC).
Re-analysis of PqiB (EMDB ID: EMD-8612)
As many new cryo-EM software versions have recently become available with new capabilities, we recovered the data used previously to obtain the EM density map and model of PqiB (PDB 5UVN) (Ekiert et al., 2017) and reanalyzed it in Relion 2.1 Iterative 3D classification with masking and signal subtraction led to the identification of distinct closed and open states. When the classification is focused on the three MCE domains, we distinguish two clearly different classes: class 1 with 40,462 particles, and class 2 with 15,811 particles. These classes were refined at 3.8 Å and 4.4 Å respectively in which we fitted the model 5UVN. After a rigidbody docking of each MCE domain, the pore-lining loops of rings 1 and 2 of class 2 were further refined in Phenix. Multi-body refinement was carried out as described above for LetB.
Expression and purification of LetB fragment for X-ray crystallography
DNA corresponding to the MCE2+MCE3 domains of LetB (residues 159–383) was amplified from the MG1655 genome and cloned by Gibson assembly into a custom pET vector (pDCE587) resulting in a C-terminal 6xHis tag. The resulting plasmid (pBEL1584) was transformed into Rosetta 2 (DE3) cells (Novagen). For expression, overnight cultures of Rosetta 2 (DE3)/pBEL1584 were diluted 1:100 in LB (Difco) supplemented with carbenicillin (100 µg/mL) and chloramphenicol (38 μg/mL) and incubated at 37 °C with shaking at 225 RPM to an OD600 of 0.9, then induced by addition of IPTG to a final concentration of 1 mM with continued shaking at 37 °C for 4 hours. Cultures were harvested by ce ntrifugation, and the pellets were resuspended in lysis buffer (20 mM Tris pH 8.0, 300 mM NaCl). Cells were lysed by two passes through an Emulsiflex-C3 cell disruptor (Avestin), then centrifuged at 38,000 xg to pellet cell debris. The clarified lysates loaded onto a cOmplete His-tag Purification column (Roche) at 4 °C on an Akta FPLC (GE Healthcare), which was subsequently washed/eluted with a gradient of increasing concentrations of imidazole. LetB containing fractions eluted from the NiNTA column were pooled and concentrated before separation on a Superdex 200 16/60 gel filtration column (GE Healthcare) equilibrated in 20 mM Tris pH 8.0 and 150 mM NaCl.
Crystal structure LetB MCE2-MCE3 domains
Size exclusion fractions containing LetB (residues 159–383, plus C-terminal His tag) were concentrated to 23 and 70 mg/mL, and sitting drop, vapor-diffusion crystallisation trials were conducted using the JCSG Core I-IV screens (QIAGEN). Crystals grew from drops consisting of 100 nL protein plus 100 nL of a reservoir solution consisting of 0.1 M Tris pH 8.5, 20% w/v PEG 1K, and were cryoprotected by supplementing the reservoir solution with 15% ethylene glycol. Native diffraction data was collected at the GM-CA/CAT beamline 23-ID-B at the Advanced Photon Source, and indexed to P65 and reduced using XDS (Table S4) (Kabsch, 2010). This dataset was phased by molecular replacement using Phaser (McCoy et al., 2007), using the MCE2 and MCE3 domains from the cryo-EM structure as search models. The resulting model was adjusted in Coot (Emsley et al., 2010) and refined using Phenix (Adams et al., 2012). This final model consists of two copies of the MCE2-MCE3 domain fragment of LetB in a monomeric state.
Crosslinking lipids in the tunnel of LetB
T7express E. coli (NEB) were co-transformed with plasmids to express LetB (either WT or mutant forms derived from pBEL1324, without the TM helix) and pEVOL-pBpF (Addgene #31190), which encodes a tRNA synthetase/tRNA pair for the in vivo incorporation p-benzoyl-lphenylalanine (BPA) in E. coli proteins at the amber stop codon, TAG (Chin et al., 2002; Isom et al., 2017). Bacterial colonies were inoculated in LB broth supplemented with carbenicillin (100 μg/mL) and chloramphenicol (38 μg/mL) and grown overnight at 37 °C. The following day, bacteria were pelleted and resuspended in 32P Labelling Medium (a low phosphate minimal media we optimized starting from LS-5052 (Studier, 2005): 1 mM Na2HP04, 1 mM KH2PO4, 50 mM NH4Cl, 5 mM Na2SO4, 2 mM MgSO4, 20 mM Na2-Succinate, 0.2x trace metals and 0.2% glucose) supplemented with carbenicillin (100 μg/mL) and chloramphenicol (38 μg/mL) and inoculated 1:50 in the 10 ml of the same medium. Bacteria were grown to OD 0.9 and a final concentration of 1 mM IPTG, 0.2% L-arabinose and 0.5 mM BPA (Bachem), alongside 500 μCi 32 P orthophosphoric acid (PerkinElmer) were added and left to induce overnight. The following day, the cultures were spun down and resuspended in 1 ml of freeze-thaw lysis buffer (50 mM Tris pH 8.0, 300 mM NaCl, 10 mM imidazole, 1 mg/ml lysozyme, 0.5 mM EDTA, 25U benzonase) and then underwent eight freeze-thaw cycles by alternating between liquid nitrogen and a 37 °C heat block. Unbroken cells were pellete d at 12,000 xg for 2 mins and the lysates were transferred to a 12 well culture plate. Samples to undergo crosslinking were treated with 365 nM UV in a Spectrolinker for 30 mins. Each sample was then mixed with 25 μl of nickel beads (Ni Sepharose 6 Fast Flow) for 30 mins. The beads were pelleted at 500 xg for 1 min and the supernatant collected. The beads were then washed four times with detergent wash buffer (50 mM Tris pH 8.0, 300 mM NaCl, 40 mM imidazole, 0.25% triton X-100) and finally resuspended in 50 μl of 2x SDS-PAGE loading buffer. The beads were boiled for 5 mins to elute protein and spun down at 12,000 xg for 2 mins. Eluted protein was analyzed by SDS-PAGE and stained using InstantBlue™ Protein Stain (Expedeon). Relative LetB loading on the gel was estimated integrating the density of the corresponding bands in the InstantBlue-stained gel in ImageJ (Rueden et al., 2017), and this was used to normalize the amount of LetB loaded on a second gel, to enable more quantitative comparisons between samples. The normalized gel was stained and 32P signal was detected using a phosphor screen and scanned on a Typhoon scanner (Amersham). Three replicates of the experiment were performed, starting with protein expression.
Quantification and Statistical Analysis
Per-residue backbone RMSD values were calculated using superposed models in UCSF Chimera (using exclusively the secondary structure score and core domain strands and MlaD as a reference, Data S1 (Meng et al., 2006)) and pairwise identity between MCE domains using ClustalO (Sievers and Higgins, 2018) (Table S2). All statistical validation performed on the deposited models was done using PHENIX (Tables S1 and S5). Relative LetB loading on InstantBlue-stained SDS-PAGE gels were estimated using ImageJ (Rueden et al., 2017),
Data and Code Availability
The cryo-EM maps have been deposited in the Electron Microscopy Data Bank with accession codes EMD-20993 (Map 1), EMD-20994 (Map 2), EMD-20995 (Map 3), EMD-20996 (Map 4), EMD-20997 (Map 5), EMD-20998 (Map 6), EMD-20999 (Map 7) and EMD-21000 (Map 8).The coordinates of the atomic models have been deposited in the Protein Data Bank under accession codes PDB: 6V0C (Model 1), 6V0D (Model 2), 6V0E (Model 3), 6V0F (Model 4), 6V0G (Model 5), 6V0H (Model 6), 6V0I (Model 7), 6V0J (Model 8) and 6VCI (coordinates and structure factors for the LetB MCE2-MCE3 crystal structure).
Cryo-EM data for LetB were deposited in EMPIAR (EMPIAR-10350). Plasmids have been deposited in Addgene, and identifiers are in the Key Resource Table.
Supplementary Material
Figure S1. Phenotypes of E. coli letAB mutants and overview of cryo-EM density map quality, Related to Figure 1.
Cellular assay for the function of LetB. 10-fold serial dilutions of the indicated cultures spotted on plates containing cholate (A) or deoxycholate (B) and incubated overnight. The letAB deletion mutant grows poorly in the presence of cholate (A) and deoxycholate (B), and can be rescued by complementation with a plasmid carrying WT letAB. (C). The pqiAB letAB double mutant plated in the presence of LSB and grown overnight. letAB deletion exacerbates the pqiAB phenotype, which can be complemented with a plasmid carrying WT letAB. The growth defect on LSB is the most robust of the letAB phenotypes, and hence is used as our primary assay for LetB function.
(D) Cellular assay for the function of LetB mutants without transmembrane region. 10-fold serial dilutions of the indicated cultures spotted on plates containing LSB and incubated overnight. The pqiAB letAB double knockout mutant grows poorly in the presence of LSB, but can be rescued by the expression of letAB constructs containing WT letB. As the first 11 codons of the letB gene overlap with the 3’ end of the letA coding region, we first designed a construct where the overlap was resolved, such that the N-terminus of LetB could be altered without changing the LetA sequence (deoverlapped). ΔTM: deoverlapped construct with LetB TM helix removed; ΔTM-PelB Leader: deoverlapped construct with LetB TM helix replaced by PelB secretion sequence.
(E) Cross-sectional views of density maps of LetB colored by local resolution, as estimated using the “blocres” program from Bsoft (Heymann and Belnap, 2007). Classes obtained prior to signal subtraction are shown on the left and improved maps of selected regions after signal subtraction are shown on the right.
(F) Fourier Shell Coefficient (FSC) and 3D FSC curves measured by the Gold-standard method (using the 3DFSC processing server (Tan et al., 2017)).
(G) Examples of density into which the model was built. Representative density for higher, intermediate and lower resolution regions are shown.
Figure S2. Cryo-EM data processing workflow, Related to Figure 1. Overall scheme for 3D classification, signal subtraction, masking and refinement. Yellow boxes indicate the maps used for model building and conformational dynamics analysis of LetB, and the blue boxes show other high resolution classes with minor differences in the open and closed states, not used for analysis. Colors corresponding to local resolution are the same as in Fig. S1. See STAR Methods for more details.
Figure S3. Comparison of LetB with AcrAB-TolC and PqiB, Related to Figures 2 and 4.
(A) Surface representations of AcrAB-TolC (PDB ID: 5o66) and LetB, colored by protein subunit. The periplasmic regions of LetB and AcrAB-TolC are of similar lengths, ~220 and ~240 Å respectively, consistent with the length of the periplasm. The periplasmic width (240 Å) is shown based on the hydrophobic regions of AcrAB-TolC (Wang et al., 2017), and is close to other reported values of 210 (Matias et al., 2003) and 230 Å (Semeraro et al., 2017). The periplasmic space is known to vary, for example in response to stress (Miller and Salama, 2018), and may not be constant in all regions of the cell envelope.
(B) Re-analysis of previously published PqiB data (Ekiert et al., 2017) shows open and closed states similar to those observed for LetB. Side and top views are shown for the open (green) and closed (magenta) states, with density maps represented as gray mesh. Distances between Cα atoms in each state are mapped in the movement analysis, with longer lines and red color representing regions of greater displacement.
(C) LetB and PqiB shown in ribbon representation in the context of the periplasm. The approximate position of the peptidoglycan is indicated. At this position, the distance between ring 4 and 5 in LetB (~37 Å) is considerably larger than the distance between other rings (28.2–32.7 Å), and at this position a poly-proline region introduces a “break” visible in the needle of PqiB. These may accommodate interactions with the peptidoglycan.
Figure S4. Negative stain EM data for naturally occurring proteins with varying number of MCE domains, and LetB truncations, Related to Figure 3.
(A) Examples of single particles of naturally occurring proteins with varying numbers of MCE domains (top) and 2D averages of top views (bottom).
(B) Example micrographs of naturally occurring proteins with varying numbers of MCE domains.
(C) Additional 2D class averages of naturally occurring proteins with varying numbers of MCE domains.
(D) Example micrographs of LetB truncation mutants.
(E) Additional 2D class averages of LetB truncation mutants
(F) Control showing growth of LetB mutants depicted in Figure 4. 10-fold serial dilutions of the indicated cultures spotted on plates containing LB only.
(G) Cellular assay for the function of four-ring LetB mutants (1–2-3–7 and 1–3-4–7). 10-fold serial dilutions of the indicated cultures spotted on plates containing LSB (left) or LB only (right) and incubated overnight. The pqiAB letAB double knockout grows poorly in the presence of LSB, but can be rescued by the expression of a letAB construct containing wild type letB. Expression of constructs with letB containing four rings fails to rescue. Expression of LetB can be detected in vivo for all constructs, and expression of BamA, as a measure of envelope stress, is consistent in all strains (see Figure S4H).
(H) In vivo expression of LetB and BamA from LetB length mutants detected by western blot. Membrane-enriched fractions were prepared from all strains used in complementation experiments and tested for expression of LetB using a rabbit polyclonal antibody against LetB, and for expression of OM marker BamA (to assess envelope homeostasis) using a rabbit polyclonal antibody against BamA.
Figure S5. Pore-lining loops (PLLs) adopt multiple conformations, Related to Figure 4.
(A) Densities for PLLs of rings 1, 5, 6 and 7, which adopt different conformations in the closed and open states. An additional density is observed in the region of PLL5 in the open state and PLL7 in both states, indicated by a black arrow in the cross sections. This likely represents an alternate conformation of the loop, but due to the low resolution, we have not modeled additional states explicitly. Additional density is similarly observed in the regions of PLL2 and PLL4 (not shown).
(B) X-ray structure of monomeric LetB MCE2-MCE3 domains. MCE2, blue; MCE3; green.
(C) Cryo-EM structure showing only LetB MCE2-MCE3 domains of one monomer. MCE2, red; MCE3; orange.
(D–F) Comparison of MCE2-MCE3 domains from X-ray and cryo-EM structures. Colors are the same as in (B) and (C).
(D–E) Superposition on the MCE2 domain, showing large-scale domain movement of MCE3 (D) and differences in PLL2 conformation (E) in the monomeric X-ray structure compared with the hexameric cryo-EM structure. The relative orientations of the MCE2 and MCE3 domains from the crystal structure are quite different from the state observed in the cryo-EM structure, likely due to the difference in oligomeric state and the flexible linker/interface between the two domains. Superposition of core domains shows excellent agreement between the X-ray and cryo EM structures (RMSD: 0.6 for MCE2 core domain and 0.7 for MCE3 core domain). In addition, the partial disorder of PLL2 in the X-ray structure (E) suggests that the PLLs are inherently flexible.
(F) Superposition on the MCE3 domain showing that PLL3 is in different conformations in the Xray and cryo-EM structures.
Figure S6. Growth and in vivo expression controls, Related to Figure 5.
(A) Control showing growth of LetB mutants depicted in Figure 5B. 10-fold serial dilutions of the indicated cultures spotted on plates containing LB only.
(B) In vivo expression of LetB and BamA from PLL mutants detected by western blot. Membrane-enriched fractions were prepared from all strains used in complementation experiments and tested for expression of LetB using a rabbit polyclonal antibody against LetB, and for expression of OM marker BamA (to assess envelope homeostasis) using a rabbit polyclonal antibody against BamA.
(C) Control showing growth of LetB mutants depicted in Figure 5E. 10-fold serial dilutions of the indicated cultures spotted on plates containing LB only.
(D) In vivo expression of LetB and BamA from hydrophobic motif mutants detected by western blot. Membrane-enriched fractions were prepared from all strains used in complementation experiments and tested for expression of LetB using a rabbit polyclonal antibody against LetB, and for expression of OM marker BamA (to assess envelope homeostasis) using a rabbit polyclonal antibody against BamA.
Figure S7. Negative stain EM data for LetB PLL mutants and hydrophobic motif mutants and uncropped gels for substrate crosslinking, Related to Figures 5 and 6.
(A) 2D class averages of PLL-deletion mutants, related to Figure 5A–C. For completeness, classes shown for ΔPLL2 and 60% particles for ΔPLL3 are duplicated from Figure 5C.
(B) Example micrographs of LetB PLL mutants
(C) Additional 2D class averages of LetB PLL mutants
(D) Example micrographs of LetB hydrophobic motif mutants
(E) Additional 2D class averages of LetB hydrophobic motif mutants
(F) Uncropped gels from in vivo crosslinking experiments. The higher molecular weight bands observed in the crosslinked samples likely correspond to oligomeric forms of LetB.
Table S1. Data collection and refinement statistics for cryo EM structure of LetB, Related to Figure 1. For access to PDB files see Data Availability.
Table S2: Pairwise percent identity between all MCE domains (from ClustalO), Related to Figure 1.
Table S3: Data collection and refinement statistics of LetB MCE2-MCE3 crystal structure, Related to Figure S5 and Figure 4.
Movie S1, Related to Figure 4. First three eigenvectors obtained from the multi-body refinement analysis of Map1 in Relion 3.0, and using the 3D variability analysis in Cryosparc 2.9. This analysis shows possible rotation of the rings relative to each other, as well as possible bending and elongation of LetB.
Movie S2, Related to Figure 4. Morph between the open and closed states of LetB. These models are generated from composite open and closed maps.
Movie S3, Related to Figure 4. Morph between the open and closed states of PqiB.
Highlights.
Cryo-EM structures of LetB reveal a tunnel that spans the bacterial cell envelope
Lipids bind inside the tunnel, supporting a role for LetB in lipid transport
Different conformations reveal tunnel dynamics, with implications for transport
Acknowledgements
We would like to thank Kristen Dancel-Manning for help with preparing Figure 7 and EM training; James Fraser, Timothy Knowles, Iris Grossman-Haham, Juliana Ilmain, Stefan Niekamp and Rachel Redler for critical reading and feedback on our manuscript; Ruslan Sanishvili and the staff of GM/CA-CAT for beam line support; and members of the Bhabha/Ekiert labs for helpful discussions. We would like to thank Ian Henderson, (The University of Queensland), for providing antibodies against BamA and LetB (YebT). We gratefully acknowledge the following funding sources: R00GM112982 (NIH / NIGMS, to G.B.), DFS‐20‐16 (Damon Runyon Cancer Research Foundation, to G.B.), R35GM128777 (NIH / NIGMS, to D.C.E), 20POST35210202 (American Heart Association, to G.I.) and Summer Undergraduate Research Program at the NYU School of Medicine (to C.T.M.). We thank Chuan Hong and Zhiheng Yu at the HHMI Janelia Research Campus for assistance in microscope operation and data collection of cryo EM samples. GM/CA@APS has been funded in whole or in part with Federal funds from the National Cancer Institute (ACB-12002) and the National Institute of General Medical Sciences (AGM-12006). This research used resources of the Advanced Photon Source, a U.S. Department of Energy (DOE) Office of Science User Facility operated for the DOE Office of Science by Argonne National Laboratory under Contract No. DEAC02–06CH11357. The Eiger 16M detector was funded by an NIH–Office of Research Infrastructure Programs, High-End Instrumentation Grant (1S10OD012289–01A1). We thank Fengxia Lang for overseeing use of the TalosL120C microscope; the Microscopy Core in which the TalosL120C is housed is partially supported by NYU Cancer Center Support Grant NIH/NCI P30CA016087. We thank the Central Lab Services team at the Skirball Institute supervised by Michael Mirabile for preparation of media and buffers in large quantities. EM data processing has utilized computing resources at the HPC Facility at NYU, and we thank the HPC team including Martin Ossowski, Ali Siavosh-Haghighi, Michael Costantino, Paul Glick, Loren Koenig, Nam Pho as well as Joe Katsnelson and John Speakman for high performance computing support.
Footnotes
Materials and correspondence
Correspondence and material requests should be addressed to Gira Bhabha or Damian C. Ekiert.
Declaration of interests
The authors declare that they have no conflict of interest.
Publisher's Disclaimer: This is a PDF file of an unedited manuscript that has been accepted for publication. As a service to our customers we are providing this early version of the manuscript. The manuscript will undergo copyediting, typesetting, and review of the resulting proof before it is published in its final form. Please note that during the production process errors may be discovered which could affect the content, and all legal disclaimers that apply to the journal pertain.
References
- Abellón-Ruiz J, Kaptan SS, Baslé A, Claudi B, Bumann D, Kleinekathöfer U, and van den Berg B. (2017). Structural basis for maintenance of bacterial outer membrane lipid asymmetry. Nat Microbiol 2, 1616–1623. [DOI] [PubMed] [Google Scholar]
- Adams PD, Afonine PV, Bunkóczi G, Chen VB, Davis IW, Echols N, Headd JJ, Hung L-W, Kapral GJ, Grosse-Kunstleve RW, et al. (2012). PHENIX: a comprehensive Python-based system for macromolecular structure solution. In International Tables for Crystallography, pp. 539–547. [DOI] [PMC free article] [PubMed] [Google Scholar]
- Awai K, Xu C, Tamot B, and Benning C. (2006). A phosphatidic acid-binding protein of the chloroplast inner envelope membrane involved in lipid trafficking. Proc. Natl. Acad. Sci. U. S. A. 103, 10817–10822. [DOI] [PMC free article] [PubMed] [Google Scholar]
- Barad BA, Echols N, Wang RY-R, Cheng Y, DiMaio F, Adams PD, and Fraser JS (2015). EMRinger: side chain-directed model and map validation for 3D cryo-electron microscopy. Nat. Methods 12, 943–946. [DOI] [PMC free article] [PubMed] [Google Scholar]
- Bayer ME (1968). Areas of adhesion between wall and membrane of Escherichia coli. J. Gen. Microbiol. 53, 395–404. [DOI] [PubMed] [Google Scholar]
- Botos I, Majdalani N, Mayclin SJ, McCarthy JG, Lundquist K, Wojtowicz D, Barnard TJ, Gumbart JC, and Buchanan SK (2016). Structural and Functional Characterization of the LPS Transporter LptDE from Gram-Negative Pathogens. Structure 24, 965–976. [DOI] [PMC free article] [PubMed] [Google Scholar]
- Casali N, and Riley LW (2007). A phylogenomic analysis of the Actinomycetales mce operons. BMC Genomics 8, 60. [DOI] [PMC free article] [PubMed] [Google Scholar]
- Chen S, McMullan G, Faruqi AR, Murshudov GN, Short JM, Scheres SHW, and Henderson R. (2013). High-resolution noise substitution to measure overfitting and validate resolution in 3D structure determination by single particle electron cryomicroscopy. Ultramicroscopy 135, 24–35. [DOI] [PMC free article] [PubMed] [Google Scholar]
- Chen VB, Arendall WB 3rd, Headd JJ, Keedy DA, Immormino RM, Kapral GJ, Murray LW, Richardson JS, and Richardson DC (2010). MolProbity: all-atom structure validation for macromolecular crystallography. Acta Crystallogr. D Biol. Crystallogr. 66, 12–21. [DOI] [PMC free article] [PubMed] [Google Scholar]
- Chin JW, Martin AB, King DS, Wang L, and Schultz PG (2002). Addition of a photocrosslinking amino acid to the genetic code of Escherichia coli. Proceedings of the National Academy of Sciences 99, 11020–11024. [DOI] [PMC free article] [PubMed] [Google Scholar]
- Cohen EJ, Ferreira JL, Ladinsky MS, Beeby M, and Hughes KT (2017). Nanoscalelength control of the flagellar driveshaft requires hitting the tethered outer membrane. Science 356, 197–200. [DOI] [PMC free article] [PubMed] [Google Scholar]
- Dong H, Zhang Z, Tang X, Paterson NG, and Dong C. (2017). Structural and functional insights into the lipopolysaccharide ABC transporter LptBFG. Nat. Commun. 8, 222. [DOI] [PMC free article] [PubMed] [Google Scholar]
- Douglas AE, and Raven JA (2003). Genomes at the interface between bacteria and organelles. Philosophical Transactions of the Royal Society of London. Series B: Biological Sciences 358, 5–18. [DOI] [PMC free article] [PubMed] [Google Scholar]
- Dowhan W. (1997). Molecular basis for membrane phospholipid diversity: why are there so many lipids? Annu. Rev. Biochem. 66, 199–232. [DOI] [PubMed] [Google Scholar]
- Du D, Wang Z, James NR, Voss JE, Klimont E, Ohene-Agyei T, Venter H, Chiu W, and Luisi BF (2014). Structure of the AcrAB-TolC multidrug efflux pump. Nature 509, 512–515. [DOI] [PMC free article] [PubMed] [Google Scholar]
- Ekiert DC, Bhabha G, Isom GL, Greenan G, Ovchinnikov S, Henderson IR, Cox JS, and Vale RD (2017). Architectures of Lipid Transport Systems for the Bacterial Outer Membrane. Cell 169, 273–285.e17. [DOI] [PMC free article] [PubMed] [Google Scholar]
- Emsley P, Lohkamp B, Scott WG, and Cowtan K. (2010). Features and development of Coot. Acta Crystallogr. D Biol. Crystallogr. 66, 486–501. [DOI] [PMC free article] [PubMed] [Google Scholar]
- Fernandez-Leiro R, and Scheres SHW (2017). A pipeline approach to single-particle processing in RELION. Acta Crystallogr D Struct Biol 73, 496–502. [DOI] [PMC free article] [PubMed] [Google Scholar]
- Gidden J, Denson J, Liyanage R, Ivey DM, and Lay JO (2009). Lipid Compositions in Escherichia coli and Bacillus subtilis During Growth as Determined by MALDI-TOF and TOF/TOF Mass Spectrometry. Int. J. Mass Spectrom. 283, 178–184. [DOI] [PMC free article] [PubMed] [Google Scholar]
- Gioffré A, Infante E, Aguilar D, Santangelo MD la P, Klepp L, Amadio A, Meikle V, Etchechoury I, Romano MI, Cataldi A, et al. (2005). Mutation in mce operons attenuates Mycobacterium tuberculosis virulence. Microbes Infect. 7, 325–334. [DOI] [PubMed] [Google Scholar]
- Graham LL, Beveridge TJ, and Nanninga N. (1991). Periplasmic space and the concept of the periplasm. Trends Biochem. Sci. 16, 328–329. [DOI] [PubMed] [Google Scholar]
- Heymann JB, and Belnap DM (2007). Bsoft: image processing and molecular modeling for electron microscopy. J. Struct. Biol. 157, 3–18. [DOI] [PubMed] [Google Scholar]
- Hughes GW, Hall SCL, Laxton CS, Sridhar P, Mahadi AH, Hatton C, Piggot TJ, Jamshad M, Spana V, Ian CT, et al. (2018). Evidence for phospholipid export from the gram-negative inner membrane: time to rethink the Mla pathway? BioRxiv. [Google Scholar]
- Isom G, Rooke J, Antunes C, Sheehan E, Wells T, Icke C, Cunningham A, Cole J, Henderson I, and Rossiter A. (2018). Mammalian Cell Entry domains are required for bile resistance and virulence in Salmonella. BioRxiv. [Google Scholar]
- Isom G, Coudray N, MacRae MR, McManus CT, Ekiert DC, and Bhabha G. (2019a). Structure of LetB Reveals a Tunnel for Lipid Transport Across the Bacterial Envelope. SSRN Electronic Journal. [DOI] [PMC free article] [PubMed] [Google Scholar]
- Isom G, Coudray N, MacRae MR, McManus CT, Ekiert DC, and Bhabha G. (2019b). Structure of LetB reveals a tunnel for lipid transport across the bacterial envelope. bioRxiv. [DOI] [PMC free article] [PubMed] [Google Scholar]
- Isom GL, Davies NJ, Chong Z-S, Bryant JA, Jamshad M, Sharif M, Cunningham AF, Knowles TJ, Chng S-S, Cole JA, et al. (2017). MCE domain proteins: conserved inner membrane lipid-binding proteins required for outer membrane homeostasis. Sci. Rep. 7, 8608. [DOI] [PMC free article] [PubMed] [Google Scholar]
- Kamischke C, Fan J, Bergeron J, Kulasekara HD, Dalebroux ZD, Burrell A, Kollman JM, and Miller SI (2019). The Acinetobacter baumannii Mla system and glycerophospholipid transport to the outer membrane. eLife 8. [DOI] [PMC free article] [PubMed] [Google Scholar]
- Kimanius D, Forsberg BO, Scheres SH, and Lindahl E. (2016). Accelerated cryo-EM structure determination with parallelisation using GPUs in RELION-2. Elife 5. [DOI] [PMC free article] [PubMed] [Google Scholar]
- Klepp LI, Forrellad MA, Osella AV, Blanco FC, Stella EJ, Bianco MV, Santangelo M de la P, Sassetti C, Jackson M, Cataldi AA, et al. (2012). Impact of the deletion of the six mce operons in Mycobacterium smegmatis. Microbes Infect. 14, 590–599. [DOI] [PMC free article] [PubMed] [Google Scholar]
- Klesse G, Rao S, Sansom MSP, and Tucker SJ (2019). CHAP: A Versatile Tool for the Structural and Functional Annotation of Ion Channel Pores. J. Mol. Biol. [DOI] [PMC free article] [PubMed] [Google Scholar]
- Konovalova A, and Silhavy TJ (2015). Outer membrane lipoprotein biogenesis: Lol is not the end. Philosophical Transactions of the Royal Society B: Biological Sciences 370, 20150030. [DOI] [PMC free article] [PubMed] [Google Scholar]
- Krachler AM, Ham H, and Orth K. (2011). Outer membrane adhesion factor multivalent adhesion molecule 7 initiates host cell binding during infection by gram-negative pathogens. Proc. Natl. Acad. Sci. U. S. A. 108, 11614–11619. [DOI] [PMC free article] [PubMed] [Google Scholar]
- Li Y, Orlando BJ, and Liao M. (2019). Structural basis of lipopolysaccharide extraction by the LptBFGC complex. Nature 567, 486–490. [DOI] [PMC free article] [PubMed] [Google Scholar]
- Liu C, Ma J, Wang J, Wang H, and Zhang L. (2019). Cryo-EM Structure of a Bacterial Lipid Transporter YebT. J. Mol. Biol. [DOI] [PubMed] [Google Scholar]
- Luo Q, Yang X, Yu S, Shi H, Wang K, Xiao L, Zhu G, Sun C, Li T, Li D, et al. (2017). Structural basis for lipopolysaccharide extraction by ABC transporter LptB2FG. Nature Structural & Molecular Biology 24, 469–474. [DOI] [PubMed] [Google Scholar]
- Malinverni JC, and Silhavy TJ (2009). An ABC transport system that maintains lipid asymmetry in the gram-negative outer membrane. Proc. Natl. Acad. Sci. U. S. A. 106, 8009–8014. [DOI] [PMC free article] [PubMed] [Google Scholar]
- Mastronarde DN (2005). Automated electron microscope tomography using robust prediction of specimen movements. J. Struct. Biol. 152, 36–51. [DOI] [PubMed] [Google Scholar]
- Matias VRF, Al-Amoudi A, Dubochet J, and Beveridge TJ (2003). Cryo-transmission electron microscopy of frozen-hydrated sections of Escherichia coli and Pseudomonas aeruginosa. J. Bacteriol. 185, 6112–6118. [DOI] [PMC free article] [PubMed] [Google Scholar]
- May JM, Sherman DJ, Simpson BW, Ruiz N, and Kahne D. (2015). Lipopolysaccharide transport to the cell surface: periplasmic transport and assembly into the outer membrane. Philosophical Transactions of the Royal Society B: Biological Sciences 370, 20150027. [DOI] [PMC free article] [PubMed] [Google Scholar]
- Meng EC, Pettersen EF, Couch GS, Huang CC, and Ferrin TE (2006). Tools for integrated sequence-structure analysis with UCSF Chimera. BMC Bioinformatics 7, 339. [DOI] [PMC free article] [PubMed] [Google Scholar]
- Miller SI, and Salama NR (2018). The gram-negative bacterial periplasm: Size matters. PLoS Biol. 16, e2004935. [DOI] [PMC free article] [PubMed] [Google Scholar]
- Murzyn K, Róg T, and Pasenkiewicz-Gierula M. (2005). Phosphatidylethanolaminephosphatidylglycerol bilayer as a model of the inner bacterial membrane. Biophys. J. 88, 1091–1103. [DOI] [PMC free article] [PubMed] [Google Scholar]
- Nakane T, Kimanius D, Lindahl E, and Scheres SH (2018). Characterisation of molecular motions in cryo-EM single-particle data by multi-body refinement in RELION. Elife 7. [DOI] [PMC free article] [PubMed] [Google Scholar]
- Okuda S, Freinkman E, and Kahne D. (2012). Cytoplasmic ATP Hydrolysis Powers Transport of Lipopolysaccharide Across the Periplasm in E. coli. Science 338, 1214–1217. [DOI] [PMC free article] [PubMed] [Google Scholar]
- Okuda S, Sherman DJ, Silhavy TJ, Ruiz N, and Kahne D. (2016). Lipopolysaccharide transport and assembly at the outer membrane: the PEZ model. Nat. Rev. Microbiol. 14, 337–345. [DOI] [PMC free article] [PubMed] [Google Scholar]
- Owens TW, Taylor RJ, Pahil KS, Bertani BR, Ruiz N, Kruse AC, and Kahne D. (2019). Structural basis of unidirectional export of lipopolysaccharide to the cell surface. Nature 567, 550–553. [DOI] [PMC free article] [PubMed] [Google Scholar]
- Pettersen EF, Goddard TD, Huang CC, Couch GS, Greenblatt DM, Meng EC, and Ferrin TE (2004). UCSF Chimera--a visualization system for exploratory research and analysis. J. Comput. Chem. 25, 1605–1612. [DOI] [PubMed] [Google Scholar]
- Punjani A, Rubinstein JL, Fleet DJ, and Brubaker MA (2017). cryoSPARC: algorithms for rapid unsupervised cryo-EM structure determination. Nat. Methods 14, 290–296. [DOI] [PubMed] [Google Scholar]
- Roston R, Gao J, Xu C, and Benning C. (2011). Arabidopsis chloroplast lipid transport protein TGD2 disrupts membranes and is part of a large complex. Plant J. 66, 759–769. [DOI] [PubMed] [Google Scholar]
- Rueden CT, Schindelin J, Hiner MC, DeZonia BE, Walter AE, Arena ET, and Eliceiri KW (2017). ImageJ2: ImageJ for the next generation of scientific image data. BMC Bioinformatics 18, 529. [DOI] [PMC free article] [PubMed] [Google Scholar]
- Ruiz N, Gronenberg LS, Kahne D, and Silhavy TJ (2008). Identification of two innermembrane proteins required for the transport of lipopolysaccharide to the outer membrane of Escherichia coli. Proc. Natl. Acad. Sci. U. S. A. 105, 5537–5542. [DOI] [PMC free article] [PubMed] [Google Scholar]
- Ruiz N, Kahne D, and Silhavy TJ (2009). Transport of lipopolysaccharide across the cell envelope: the long road of discovery. Nature Reviews Microbiology 7, 677–683. [DOI] [PMC free article] [PubMed] [Google Scholar]
- Semeraro EF, Devos JM, Porcar L, Forsyth VT, and Narayanan T. (2017). In vivo analysis of the Escherichia coli ultrastructure by small-angle scattering. IUCrJ 4, 751–757. [DOI] [PMC free article] [PubMed] [Google Scholar]
- Sherman DJ, Xie R, Taylor RJ, George AH, Okuda S, Foster PJ, Needleman DJ, and Kahne D. (2018). Lipopolysaccharide is transported to the cell surface by a membrane-tomembrane protein bridge. Science 359, 798–801. [DOI] [PMC free article] [PubMed] [Google Scholar]
- Shi X, Chen M, Yu Z, Bell JM, Wang H, Forrester I, Villarreal H, Jakana J, Du D, Luisi BF, et al. (2019). In situ structure and assembly of the multidrug efflux pump AcrABTolC. Nat. Commun. 10, 2635. [DOI] [PMC free article] [PubMed] [Google Scholar]
- Sievers F, and Higgins DG (2018). Clustal Omega for making accurate alignments of many protein sequences. Protein Sci. 27, 135–145. [DOI] [PMC free article] [PubMed] [Google Scholar]
- Smart OS, Goodfellow JM, and Wallace BA (1993). The pore dimensions of gramicidin A. Biophys. J. 65, 2455–2460. [DOI] [PMC free article] [PubMed] [Google Scholar]
- Sperandeo P, Cescutti R, Villa R, Di Benedetto C, Candia D, Dehò G, and Polissi A. (2007). Characterization of lptA and lptB, two essential genes implicated in lipopolysaccharide transport to the outer membrane of Escherichia coli. J. Bacteriol. 189, 244–253. [DOI] [PMC free article] [PubMed] [Google Scholar]
- Sperandeo P, Lau FK, Carpentieri A, De Castro C, Molinaro A, Dehò G, Silhavy TJ, and Polissi A. (2008). Functional analysis of the protein machinery required for transport of lipopolysaccharide to the outer membrane of Escherichia coli. J. Bacteriol. 190, 4460–4469. [DOI] [PMC free article] [PubMed] [Google Scholar]
- Studier FW (2005). Protein production by auto-induction in high density shaking cultures. Protein Expr. Purif. 41, 207–234. [DOI] [PubMed] [Google Scholar]
- Suits MDL, Sperandeo P, Dehò G, Polissi A, and Jia Z. (2008). Novel structure of the conserved gram-negative lipopolysaccharide transport protein A and mutagenesis analysis. J. Mol. Biol. 380, 476–488. [DOI] [PubMed] [Google Scholar]
- Tan YZ, Baldwin PR, Davis JH, Williamson JR, Potter CS, Carragher B, and Lyumkis D. (2017). Addressing preferred specimen orientation in single-particle cryo-EM through tilting. Nat. Methods 14, 793–796. [DOI] [PMC free article] [PubMed] [Google Scholar]
- Tefsen B, Geurtsen J, Beckers F, Tommassen J, and de Cock H. (2005). Lipopolysaccharide transport to the bacterial outer membrane in spheroplasts. J. Biol. Chem. 280, 4504–4509. [DOI] [PubMed] [Google Scholar]
- Thong S, Ercan B, Torta F, Fong ZY, Wong HYA, Wenk MR, and Chng S-S (2016). Defining key roles for auxiliary proteins in an ABC transporter that maintains bacterial outer membrane lipid asymmetry. Elife 5. [DOI] [PMC free article] [PubMed] [Google Scholar]
- Wang Z, Fan G, Hryc CF, Blaza JN, Serysheva II, Schmid MF, Chiu W, Luisi BF, and Du D. (2017). An allosteric transport mechanism for the AcrAB-TolC multidrug efflux pump. Elife 6. [DOI] [PMC free article] [PubMed] [Google Scholar]
- Wong LH, Gatta AT, and Levine TP (2019). Lipid transfer proteins: the lipid commute via shuttles, bridges and tubes. Nat. Rev. Mol. Cell Biol. 20, 85–101. [DOI] [PubMed] [Google Scholar]
- Wu T, McCandlish AC, Gronenberg LS, Chng S-S, Silhavy TJ, and Kahne D. (2006). Identification of a protein complex that assembles lipopolysaccharide in the outer membrane of Escherichia coli. Proc. Natl. Acad. Sci. U. S. A. 103, 11754–11759. [DOI] [PMC free article] [PubMed] [Google Scholar]
- Zhang K. (2016). Gctf: Real-time CTF determination and correction. J. Struct. Biol. 193, 1–12. [DOI] [PMC free article] [PubMed] [Google Scholar]
- Zheng SQ, Palovcak E, Armache J-P, Verba KA, Cheng Y, and Agard DA (2017). MotionCor2: anisotropic correction of beam-induced motion for improved cryo-electron microscopy. Nat. Methods 14, 331–332. [DOI] [PMC free article] [PubMed] [Google Scholar]
Associated Data
This section collects any data citations, data availability statements, or supplementary materials included in this article.
Supplementary Materials
Figure S1. Phenotypes of E. coli letAB mutants and overview of cryo-EM density map quality, Related to Figure 1.
Cellular assay for the function of LetB. 10-fold serial dilutions of the indicated cultures spotted on plates containing cholate (A) or deoxycholate (B) and incubated overnight. The letAB deletion mutant grows poorly in the presence of cholate (A) and deoxycholate (B), and can be rescued by complementation with a plasmid carrying WT letAB. (C). The pqiAB letAB double mutant plated in the presence of LSB and grown overnight. letAB deletion exacerbates the pqiAB phenotype, which can be complemented with a plasmid carrying WT letAB. The growth defect on LSB is the most robust of the letAB phenotypes, and hence is used as our primary assay for LetB function.
(D) Cellular assay for the function of LetB mutants without transmembrane region. 10-fold serial dilutions of the indicated cultures spotted on plates containing LSB and incubated overnight. The pqiAB letAB double knockout mutant grows poorly in the presence of LSB, but can be rescued by the expression of letAB constructs containing WT letB. As the first 11 codons of the letB gene overlap with the 3’ end of the letA coding region, we first designed a construct where the overlap was resolved, such that the N-terminus of LetB could be altered without changing the LetA sequence (deoverlapped). ΔTM: deoverlapped construct with LetB TM helix removed; ΔTM-PelB Leader: deoverlapped construct with LetB TM helix replaced by PelB secretion sequence.
(E) Cross-sectional views of density maps of LetB colored by local resolution, as estimated using the “blocres” program from Bsoft (Heymann and Belnap, 2007). Classes obtained prior to signal subtraction are shown on the left and improved maps of selected regions after signal subtraction are shown on the right.
(F) Fourier Shell Coefficient (FSC) and 3D FSC curves measured by the Gold-standard method (using the 3DFSC processing server (Tan et al., 2017)).
(G) Examples of density into which the model was built. Representative density for higher, intermediate and lower resolution regions are shown.
Figure S2. Cryo-EM data processing workflow, Related to Figure 1. Overall scheme for 3D classification, signal subtraction, masking and refinement. Yellow boxes indicate the maps used for model building and conformational dynamics analysis of LetB, and the blue boxes show other high resolution classes with minor differences in the open and closed states, not used for analysis. Colors corresponding to local resolution are the same as in Fig. S1. See STAR Methods for more details.
Figure S3. Comparison of LetB with AcrAB-TolC and PqiB, Related to Figures 2 and 4.
(A) Surface representations of AcrAB-TolC (PDB ID: 5o66) and LetB, colored by protein subunit. The periplasmic regions of LetB and AcrAB-TolC are of similar lengths, ~220 and ~240 Å respectively, consistent with the length of the periplasm. The periplasmic width (240 Å) is shown based on the hydrophobic regions of AcrAB-TolC (Wang et al., 2017), and is close to other reported values of 210 (Matias et al., 2003) and 230 Å (Semeraro et al., 2017). The periplasmic space is known to vary, for example in response to stress (Miller and Salama, 2018), and may not be constant in all regions of the cell envelope.
(B) Re-analysis of previously published PqiB data (Ekiert et al., 2017) shows open and closed states similar to those observed for LetB. Side and top views are shown for the open (green) and closed (magenta) states, with density maps represented as gray mesh. Distances between Cα atoms in each state are mapped in the movement analysis, with longer lines and red color representing regions of greater displacement.
(C) LetB and PqiB shown in ribbon representation in the context of the periplasm. The approximate position of the peptidoglycan is indicated. At this position, the distance between ring 4 and 5 in LetB (~37 Å) is considerably larger than the distance between other rings (28.2–32.7 Å), and at this position a poly-proline region introduces a “break” visible in the needle of PqiB. These may accommodate interactions with the peptidoglycan.
Figure S4. Negative stain EM data for naturally occurring proteins with varying number of MCE domains, and LetB truncations, Related to Figure 3.
(A) Examples of single particles of naturally occurring proteins with varying numbers of MCE domains (top) and 2D averages of top views (bottom).
(B) Example micrographs of naturally occurring proteins with varying numbers of MCE domains.
(C) Additional 2D class averages of naturally occurring proteins with varying numbers of MCE domains.
(D) Example micrographs of LetB truncation mutants.
(E) Additional 2D class averages of LetB truncation mutants
(F) Control showing growth of LetB mutants depicted in Figure 4. 10-fold serial dilutions of the indicated cultures spotted on plates containing LB only.
(G) Cellular assay for the function of four-ring LetB mutants (1–2-3–7 and 1–3-4–7). 10-fold serial dilutions of the indicated cultures spotted on plates containing LSB (left) or LB only (right) and incubated overnight. The pqiAB letAB double knockout grows poorly in the presence of LSB, but can be rescued by the expression of a letAB construct containing wild type letB. Expression of constructs with letB containing four rings fails to rescue. Expression of LetB can be detected in vivo for all constructs, and expression of BamA, as a measure of envelope stress, is consistent in all strains (see Figure S4H).
(H) In vivo expression of LetB and BamA from LetB length mutants detected by western blot. Membrane-enriched fractions were prepared from all strains used in complementation experiments and tested for expression of LetB using a rabbit polyclonal antibody against LetB, and for expression of OM marker BamA (to assess envelope homeostasis) using a rabbit polyclonal antibody against BamA.
Figure S5. Pore-lining loops (PLLs) adopt multiple conformations, Related to Figure 4.
(A) Densities for PLLs of rings 1, 5, 6 and 7, which adopt different conformations in the closed and open states. An additional density is observed in the region of PLL5 in the open state and PLL7 in both states, indicated by a black arrow in the cross sections. This likely represents an alternate conformation of the loop, but due to the low resolution, we have not modeled additional states explicitly. Additional density is similarly observed in the regions of PLL2 and PLL4 (not shown).
(B) X-ray structure of monomeric LetB MCE2-MCE3 domains. MCE2, blue; MCE3; green.
(C) Cryo-EM structure showing only LetB MCE2-MCE3 domains of one monomer. MCE2, red; MCE3; orange.
(D–F) Comparison of MCE2-MCE3 domains from X-ray and cryo-EM structures. Colors are the same as in (B) and (C).
(D–E) Superposition on the MCE2 domain, showing large-scale domain movement of MCE3 (D) and differences in PLL2 conformation (E) in the monomeric X-ray structure compared with the hexameric cryo-EM structure. The relative orientations of the MCE2 and MCE3 domains from the crystal structure are quite different from the state observed in the cryo-EM structure, likely due to the difference in oligomeric state and the flexible linker/interface between the two domains. Superposition of core domains shows excellent agreement between the X-ray and cryo EM structures (RMSD: 0.6 for MCE2 core domain and 0.7 for MCE3 core domain). In addition, the partial disorder of PLL2 in the X-ray structure (E) suggests that the PLLs are inherently flexible.
(F) Superposition on the MCE3 domain showing that PLL3 is in different conformations in the Xray and cryo-EM structures.
Figure S6. Growth and in vivo expression controls, Related to Figure 5.
(A) Control showing growth of LetB mutants depicted in Figure 5B. 10-fold serial dilutions of the indicated cultures spotted on plates containing LB only.
(B) In vivo expression of LetB and BamA from PLL mutants detected by western blot. Membrane-enriched fractions were prepared from all strains used in complementation experiments and tested for expression of LetB using a rabbit polyclonal antibody against LetB, and for expression of OM marker BamA (to assess envelope homeostasis) using a rabbit polyclonal antibody against BamA.
(C) Control showing growth of LetB mutants depicted in Figure 5E. 10-fold serial dilutions of the indicated cultures spotted on plates containing LB only.
(D) In vivo expression of LetB and BamA from hydrophobic motif mutants detected by western blot. Membrane-enriched fractions were prepared from all strains used in complementation experiments and tested for expression of LetB using a rabbit polyclonal antibody against LetB, and for expression of OM marker BamA (to assess envelope homeostasis) using a rabbit polyclonal antibody against BamA.
Figure S7. Negative stain EM data for LetB PLL mutants and hydrophobic motif mutants and uncropped gels for substrate crosslinking, Related to Figures 5 and 6.
(A) 2D class averages of PLL-deletion mutants, related to Figure 5A–C. For completeness, classes shown for ΔPLL2 and 60% particles for ΔPLL3 are duplicated from Figure 5C.
(B) Example micrographs of LetB PLL mutants
(C) Additional 2D class averages of LetB PLL mutants
(D) Example micrographs of LetB hydrophobic motif mutants
(E) Additional 2D class averages of LetB hydrophobic motif mutants
(F) Uncropped gels from in vivo crosslinking experiments. The higher molecular weight bands observed in the crosslinked samples likely correspond to oligomeric forms of LetB.
Table S1. Data collection and refinement statistics for cryo EM structure of LetB, Related to Figure 1. For access to PDB files see Data Availability.
Table S2: Pairwise percent identity between all MCE domains (from ClustalO), Related to Figure 1.
Table S3: Data collection and refinement statistics of LetB MCE2-MCE3 crystal structure, Related to Figure S5 and Figure 4.
Movie S1, Related to Figure 4. First three eigenvectors obtained from the multi-body refinement analysis of Map1 in Relion 3.0, and using the 3D variability analysis in Cryosparc 2.9. This analysis shows possible rotation of the rings relative to each other, as well as possible bending and elongation of LetB.
Movie S2, Related to Figure 4. Morph between the open and closed states of LetB. These models are generated from composite open and closed maps.
Movie S3, Related to Figure 4. Morph between the open and closed states of PqiB.
Data Availability Statement
The cryo-EM maps have been deposited in the Electron Microscopy Data Bank with accession codes EMD-20993 (Map 1), EMD-20994 (Map 2), EMD-20995 (Map 3), EMD-20996 (Map 4), EMD-20997 (Map 5), EMD-20998 (Map 6), EMD-20999 (Map 7) and EMD-21000 (Map 8).The coordinates of the atomic models have been deposited in the Protein Data Bank under accession codes PDB: 6V0C (Model 1), 6V0D (Model 2), 6V0E (Model 3), 6V0F (Model 4), 6V0G (Model 5), 6V0H (Model 6), 6V0I (Model 7), 6V0J (Model 8) and 6VCI (coordinates and structure factors for the LetB MCE2-MCE3 crystal structure).
Cryo-EM data for LetB were deposited in EMPIAR (EMPIAR-10350). Plasmids have been deposited in Addgene, and identifiers are in the Key Resource Table.