

Abstract
Hepatitis C (HCV) is a leading cause of chronic liver disease and mortality worldwide and persons who inject drugs (PWID) are at the highest risk for acquiring and transmitting HCV infection. We developed an agent-based model (ABM) to identify and optimize direct-acting antiviral (DAA) therapy scale-up and treatment strategies for achieving the World Health Organization (WHO) goals of HCV elimination by the year 2030. While DAA is highly efficacious, it is also expensive, and therefore intervention strategies should balance the goals of elimination and the cost of the intervention. Here we present and compare two methods for finding PWID treatment enrollment strategies by conducting a standard model parameter sweep and compare the results to an evolutionary multi-objective optimization algorithm. The evolutionary approach provides a pareto-optimal set of solutions that minimizes treatment costs and incidence rates.
1. INTRODUCTION
Persons who inject drugs (PWID) are at the highest risk for acquiring and transmitting hepatitis C virus (HCV) infection (Bruggmann 2013), which is a leading cause of liver disease in the US (El-Serag 2012). Approximately 32,000 PWID reside in metropolitan Chicago, Illinois (Tempalski et al. 2013) with an estimated HCV-RNA prevalence of 47% (Gutfraind et al. 2015). Given the public health burden of hepatitis C, there is a growing need to provide model-based forecasting of current (prevalence) and new (incidence) infections in the population that accounts for the complex interplay of demographic factors, social networks, geographic location, and behaviors (Dahari and Boodram 2018). Additionally, the ability to predict the effectiveness of treatment programs on reducing new infections may be of crucial importance, as the effects of disease treatment cannot be known a priori and can take several years to a decade to fully appreciate.
We previously developed the Agent-based Pathogen Kinetics (APK) model to simulate the PWID population in metropolitan Chicago including the social interactions that result in HCV infection, and applied the model to study and predict changes in HCV prevalence in this population in the absence of treatment (Gutfraind et al. 2015). In APK, each PWID performs drug-related daily activities and has a state of HCV infection, a location of residency, and maintains a drug sharing network with other PWID. APK was designed using highly detailed empirical networks and geospatial Chicago-based data from large epidemiological empirical datasets to model the PWID population in each neighborhood; capturing associations between demographic characteristics (e.g. age, race/ethnicity) and drug injection behaviors (e.g. sharing syringes). The main novelty of APK is the detailed simulation of four aspects of the drug lifestyle: demographic, behavioral, social and geospatial.
In our present study we have ported the APK model to our Hepatitis C Elimination in PWID (HepCEP) model to identify and optimize direct-acting antiviral (DAA) therapy scale-up and treatment strategies for achieving the World Health Organization (WHO) goals of reducing new chronic HCV infections by 90% by 2030. HepCEP includes novel PWID behaviors for DAA therapy enrollment and response to treatment. DAA treatment is highly efficacious, however the cost of treatment can exceed $25,000 per patient (Bethea et al. 2018). Therefore, reducing the number of treatments in a population is desirable. This presents an opportunity to investigate DAA treatment enrollment strategies that can simultaneously minimize treatment costs and the rate of new chronic infections.
Recruitment of PWID into DAA treatment programs for HCV can be conducted using various methods. In this paper, we present and compare random to non-random recruitment strategies. To do this, we first conducted a standard model parameter sweep exploration with an a priori-defined set of parameter values, then compared the results to an evolutionary genetic algorithm approach that can provide a pareto-optimal set of solutions that minimizes DAA treatment costs and HCV incidence rates.
2. HEPCEP MODEL
To perform the proposed analyses, we extended the capabilities of our previous APK model (Gutfraind et al. 2015) to include DAA therapy and to better enable large-scale simulated parameter sweeps over DAA scale-up rates with the Repast HPC-based (Colllier and North 2013) HepCEP model. The primary behavior enhancements in HepCEP are the treatment enrollment strategies, which are examined specifically in the context of achieving significant reductions in HCV incidence. All other PWID behaviors in the APK model were ported to HepCEP unchanged. The Repast HPC implementation of the model is written entirely in C++, which provides a nominal performance improvement over the Java APK model; however, it provides a substantial improvement in the memory footprint. A typical simulation of 32,000 PWID for a 20-year time duration on a single CPU core requires approximately one hour of computation (wall) time and 600MB of memory. For single runs on individual workstations, the efficiency improvements observed in HepCEP are nominal; however, the roughly 7-fold memory footprint reduction compared to APK has a large impact on cluster-based simulations in which a single compute node may contain 36 cores, but with a shared memory that can be used across multiple concurrently running simulations.
We used an updated method in HepCEP for creating PWID agents in-memory by sampling from a pre-generated database of individuals. The APK model generated the PWID population as needed from multiple surveys of demographic and behavioral information for Chicago area PWIDs (Gutfraind et al. 2015). The HepCEP PWID input data set, in contrast, contained only the following pre-computed data for each individual: age, age started injecting drugs, gender, race, zip code, syringe source (harm reduction), HCV infection status, drug sharing network degree, and parameters for daily injection rates and syringe sharing.
The population demographic and behavioral properties were statistically identical between APK and HepCEP. The primary benefits of this PWID sampling method are reduced computational complexity since the sample population is completely file-based, and, more importantly, the elimination of personally identifiable information (PII) medical data, enabling the use of any open-science high-performance computing resource without data protection concerns. The HepCEP PWID input data set contains approximately 100,000 unique entries which are randomly sampled throughout the simulation to create new PWID agents. The initial model population is a model parameter, and this study uses a population size of 32,000 individuals. PWID agents may die according to an age-related random process, and are replaced with new PWIDs sampled from the input data set to maintain a nearly constant population size for the entire course of the simulation.
2.1. Syringe Sharing Networks
Syringe-sharing is the primary mode of HCV transmission among PWID (Alter 2007) and therefore PWIDs in HepCEP are connected via syringe sharing networks. Network formation is determined by the probability of two persons encountering each other in their neighborhood of residence, in outdoor drug purchasing market areas in Chicago, or random interaction with any other individual. The methods used to calculate network encounter rates, establishment processes, and removal of networks are detailed in (Gutfraind et al. 2015). The initial PWID population members are placed as nodes in the network, and edges are probabilistically created based on the above criteria. Each individual has a predetermined number of in-network PWID partners who provide syringes to the individual and out-network PWID partners who receive syringes from the individual. The network edge direction determines the flow of HCV-contaminated syringes between individuals, and thus the direction of HCV transmission. Network connections have an average lifespan after which they are destroyed, and new connections are formed probabilistically.
2.2. DAA Treatment Enrollment
Treatment enrollment is modelled by selecting HCV RNA positive PWIDs such that infected individuals are sampled at random from the total PWID population or from syringe-sharing network connections, depending on the enrollment method type. The annual target enrollment rate is a model parameter that determines the total annual treatment enrollment as a fraction of the total population, and in this study we examine annual enrollment rates in the range of 1–10% of the total population. We chose a conservative treatment duration of 12 weeks. Treatment success probability is a function of treatment non-adherence and sustained virologic response (SVR) parameters. We used a treatment failure rate of 10% and treatment SVR of 90%. In this study, treatment re-enrollment is allowed such that PWID who have completed a successful treatment and become re-infected are eligible for additional re-treatments. DAA cost is assumed $25,000 (USD) per treatment, consistent with recent wholesale prices (Bethea et al. 2018).
The process of treatment enrollment of the PWID population may be scheduled to begin at any time during a simulation relative to the simulation start date, which is specified via a model parameter, and repeats every tick interval of 1 day. The total PWID target enrollment for a single day is determined by the daily mean treatment enrollment, which is the total PWID population multiplied by the annual treatment enrollment parameter / 365. The daily enrollment target is sampled from a Poisson distribution using the daily mean treatment enrollment. Multiple treatment enrollment methods are available, and are described in detail below. Each treatment method has a model parameter enrollment probability of 0–1, and the sum of all enrollment probabilities must equal 1.0. The total PWID daily recruitment target for each enrollment type is calculated as the product of the enrollment probability for the enrollment type and the daily enrollment target. A PWID is only eligible for enrollment in DAA treatment if s/he has a positive HCV RNA test result (clinical diagnosis of HCV) and is not currently in treatment.
2.3. DAA Treatment Enrollment Methods
2.3.1. Random Recruitment
Random recruitment selects HCV-infected individuals from the PWID population. The list of available PWID candidates is shuffled and random individuals are selected until the daily enrollment target for the recruitment is met or no eligible PWID remain for recruitment that day. This sampling process does not consider demographics or social network connections.
2.3.2. Harm Reduction Program (HRP)
Similar to random recruitment, but individuals must be registered in a harm reduction program, such as syringe service program (SSP) that provides sterile syringe injection equipment along with risk reduction counseling to enrollees. PWID enrolled in these programs are considered a lower risk for HCV transmission than those with similar injection behaviors who are not enrolled. The list of available PWID candidates is shuffled and random individuals in HRP are selected until the daily enrollment target for the HRP recruitment is met or no eligible PWID remain for recruitment that day.
2.3.3. Full Network Recruitment
The network recruitment methods begin by selecting a PWID via the random recruitment method, then enrolling all other PWID who share syringes with the selected individual (personal injection network). These include individuals who give and receive syringes from the selected PWID. The list of available PWID candidates is shuffled and random individuals are selected until the daily enrollment target for the full network recruitment is met or no eligible PWID remain for recruitment that day. Individuals who are enrolled as part of the network recruitment are counted toward the daily target. All individuals, whether the originally selected, or selected through the network, must meet the eligibility criteria outlined above.
2.3.4. In-Partner and Out-Partner Network Recruitment
Similar to the full network recruitment, the in-partner enrollment method only recruits a single social network “in” edge, or another PWID who provides syringes to the originally selected individual. Alternately, the out-partner recruitment only recruits a single social network “out” edges, or another PWID who receives syringes from the originally selected individual.
2.4. Simulation Schedule
HepCEP uses a simulation step size of one day in which multiple model behaviors are scheduled in the following sequence. First, the main model step is executed that iterates over each PWID agent and executes the individual’s step method, which probabilistically determines the number of drug sharing episodes between the individual and other PWID in the individual’s drug sharing network. After each individual has executed its step, any individuals that have died are removed from the population and new PWID agents are generated to maintain the population size. Next, a PWID network linking is conducted to update PWID network connections due to losses or gains from deaths or arriving PWID agents, or from network edges that have expired. Finally, the treatment enrollment is conducted by creating a candidate pool of all PWID eligible for enrollment and entering candidates in each of the enrollment methods.
2.5. Exploration of Treatment Enrollment Methods
HepCEP provides the ability to independently specify the total annual target treatment enrollment percentage of the population and the distribution for each treatment enrollment method. Individual treatment method enrollment fractions range from 0 (indicating no individuals will be enrolled in treatment via this method) to 1 (indicating all individuals will be enrolled via this method) and are constrained such that the sum of all enrollment method fractions must sum to 1. The primary model outcome is the annual HCV incidence rate (per 1000 person-years) for a given year, which is defined as:
The denominator represents the total number of individuals that are eligible to become infected, while the numerator is simply the number of new daily infections. This formulation assumes that treated individuals can be re-infected after cure and that re-infected individuals are treated as new infections, which is included in the numerator of infected daily.
To examine the effects of enrollment rate scale up and the distribution of enrollment method fractions, a series of simulation experiments were conducted using high-performance computing workflows implemented with the EMEWS framework (Ozik et al. 2016). EMEWS is built on the general-purpose parallel scripting language Swift/T (Wozniak et al. 2013), which provides the capability of running multi-language software tasks on anywhere from desktops to peta-scale plus computing resources. While EMEWS enables running very large, a priori defined parameter sweeps, it also utilizes high-level queue-like interfaces to integrate more sophisticated and dynamic parameter sampling methods. Here we exploit this capability by plugging in a Python-based multi-objective optimization algorithm via EQ/Py (EMEWS Queues for Python). The simulation experiments were conducted on the Bebop cluster run by the Laboratory Computing Resource Center at Argonne National Laboratory.
3. SIMULATION RESULTS
3.1. Effect of Enrollment Rate on HCV Incidence
To first understand the effect of the enrollment rate parameter on the incidence with random recruitment, four annual target enrollment rate scenarios were simulated (2.5%, 5%, 7.5%, 10%) with 20 stochastic replicates each for DAA scale-up. The stochastic elements of the model include those already described, and additional model parameters described in detail previously (Gutfraind et al. 2015). Each simulation required approximately one hour of wall time to complete. Using the EMEWS workflow on the Bebop cluster, the actual compute time was close to one hour since all runs can execute in parallel.
The simulation start date of 2010 was selected based on the PWID demographic data from multiple surveys in previous years (Gutfraind et al. 2015). The model time step is one day, and treatment enrollment is started in year 2020 and run until year 2030, with detailed model data collected at daily intervals. We report the mean incidence per 1000 person-years relative to the mean baseline incidence rate in year 2020 with no treatment (enrollment rate of 0%). The mean relative incidence rate and 95% confidence interval of the mean incidence rate is determined from the 20 stochastic runs.
The time-series relative incidence rate for the four enrollment rate percentages for random recruitment are shown in Figure 1. Annual target treatment enrollment rates of 2.5% did not reduce the incidence rate relative to the year 2020 incidence rate before enrollment started. Enrollment rates ≥ 5% reduced the incidence rate to near zero percent at year 2029 (5% enrollment), 2026 (7.5% enrollment), and 2025 (10% enrollment). The initial increase in incidence during the first few years after treatment begins in 2020 is due to re-infections of treated individuals.
Figure 1:

Projected relative HCV mean incidence among PWID relative to the predicted 2020 incidence during DAA scale-up for random recruitment and annual target enrollment rates from 2.5–10%. The ribbons represent the 95% confidence interval around the mean, based on 20 stochastic simulation runs.
3.2. Large-Scale Parameter Sweep for Enrollment Rate and Treatment Methods
The effect of enrollment rate on HCV incidence for random recruitment provides some insight into how the total number of randomly selected and treated PWID impacts the incidence over time. This relatively small parameter space exploration consisting of 80 simulation runs is feasible even on small workstations given enough time. However, the inclusion of additional simulation parameters led to a rapidly expanding parameter space requiring a truly large-scale model exploration approach.
We next investigated the effects of all treatment enrollment recruitment methods described in section 2.3, as a function of the annual target enrollment rate and as a function of the probability of PWIDs being selected into a specific enrollment method. The treatment method fractions were determined by distributing 5 units of 20% across the five different treatment methods, resulting in 126 possible treatment method combinations. The annual target enrollment rate has four discrete states: 0.025 (2.5%), 0.05 (5%), 0.075 (7.5%), and 0.1 (10%). The total parameter space contained 126 × 4 = 504 unique combinations of the enrollment rate and individual treatment probabilities. For these parameter combinations, we generated 10 random runs, each with a unique random seed, for a total of 5040 simulation runs. The same 10 random seeds were used for each parameter combination. The mean incidence at year 2030 was calculated for each parameter combination.
Of the 504 experiment combinations, 150 had incidence rates at year 2030 greater than zero, while the remaining 354 had final incidence rates at or very close to zero. Table 1 shows the treatment count and costs, and enrollment rate and method percentages for 15 model runs with the lowest treatment counts and a zero incidence rate in year 2030. The incidence is fully minimized since the rate must be ≥ 0. The treatment counts across all 504 experiments with zero incidence in year 2030 range from the fewest number of treatments (11,949) and cost ($298,725,000) to the most number of treatments (13,039) and cost ($325,975,000) (not shown). The cost different between the model runs with zero incidence in year 2030 is $27,250,000 due to the large difference in the number of treatments that result in the same incidence.
Table 1:
Total treatment counts and costs, and enrollment rate and enrollment method percentages for the 15 model runs with the lowest treatment counts and an incidence of zero in year 2030 for the parameter sweep. Each row is a unique model run.
| Treatment Count | Treatment Cost (1K $) | Enrollment Rate (%) | HRP (%) | Network Full (%) | Network In-Partner (%) | Network Out-Partner (%) | Random (%) |
|---|---|---|---|---|---|---|---|
| 11,949 | 298,725 | 5 | 0 | 80 | 20 | 0 | 0 |
| 11,968 | 299,210 | 5 | 0 | 0 | 100 | 0 | 0 |
| 12,012 | 300,310 | 10 | 0 | 20 | 80 | 0 | 0 |
| 12,044 | 301,095 | 5 | 0 | 0 | 80 | 20 | 0 |
| 12,047 | 301,175 | 10 | 0 | 0 | 100 | 0 | 0 |
| 12,049 | 301,233 | 7.5 | 0 | 0 | 80 | 0 | 20 |
| 12,054 | 301,338 | 10 | 20 | 40 | 40 | 0 | 0 |
| 12,058 | 301,438 | 10 | 20 | 20 | 60 | 0 | 0 |
| 12,058 | 301,440 | 5 | 20 | 0 | 60 | 20 | 0 |
| 12,068 | 301,695 | 5 | 0 | 20 | 60 | 0 | 20 |
| 12,068 | 301,708 | 5 | 0 | 40 | 40 | 0 | 20 |
| 12,072 | 301,798 | 10 | 0 | 40 | 60 | 0 | 0 |
| 12,083 | 302,063 | 7.5 | 0 | 40 | 40 | 20 | 0 |
| 12,087 | 302,180 | 5 | 20 | 40 | 20 | 0 | 20 |
| 12,093 | 302,330 | 10 | 20 | 60 | 0 | 20 | 0 |
Considering the large number of parameter combinations that result in near-zero relative incidence at year 2030, selecting the “best” set of treatment enrollment strategies can be challenging. Along with minimizing HCV incidence, minimization of the number of treatments, and thus total cost of treatments, should be considered. Finally, it’s possible that the desired optimal set of treatment enrollment parameters was missed entirely due to the fact that the parameter space was discretized on a coarse grid, yet still required 5,000 core-hours of computation on a High Performance Computing (HPC) resource.
3.3. Model Exploration with a Multi-Objective Evolutionary Genetic Algorithm
The discretized parameter space partitioning produces a large set of model output solutions from which to select the most desirable, depending on the selection criteria. One approach to more strategically navigate the model parameter is through the use of sequential optimization techniques that optimize model outputs. For an ABM like HepCEP in which it is desired to minimize both the number of treatments (cost) and the HCV incidence, there is not a convenient single objective function evaluation since both objectives need to be minimized independently. Therefore, a multi-objective optimization approach is needed.
Evolutionary model exploration (ME) approaches can be used to find a set of model solutions that satisfy a multi-objective optimization problem. Genetic algorithms (GA) are especially suited for evolutionary exploration. In a typical GA, each individual in a population represents a specific set of model parameters, consisting of a set of intrinsic properties (genotype), that manifest as a set of apparent characteristics (phenotype) which are evaluated via a fitness function of model outputs that is optimized (Holland 1992). Individuals with the best fitness are selected and their properties are combined in a crossover operation producing offspring individuals that contain the combined characteristics of their parents. Through successive generations of parents and offspring, only the individuals with the best fitness are selected, resulting in a population of individuals with a higher fitness than the initial population
A GA can be used to discover the best combination of model parameters based on the fitness of the model outputs. In the ME context, an individual in a GA population consists of a single set of input parameters to be explored, e.g. a single model run. All other model input parameters that are constant are not included in a GA individual. Unlike the parameter sweep, the model parameter space does not need to be discretized and, instead, model parameters are constrained between minimum and maximum values, from which the GA selects the parameters randomly when creating the initial population. For each GA individual, a complete model simulation is run, and the model outputs are evaluated to determine the individual’s fitness. At each generation, higher-fitness individuals are more likely to be picked to create new offspring parameter sets which are subsequently used to run new simulations.
We use EMEWS EQ/Py to explore treatment enrollment combinations in HepCEP with a multi-objective GA approach. We use the DEAP evolutionary computation framework (Fortin et al. 2012) Python library to provide the GA components of the workflow. The NSGA-II algorithm (Deb et al. 2002) was selected based on its ability to provide a set of Pareto-optimal solutions using multi-objective optimization, and is included in the DEAP library. The NSGA-II algorithm maintains a constant population size over successive generations by selecting only non-dominated individuals at each generation and discarding lower fitness individuals. The set of non-dominated individuals comprises the Pareto front in the objective space and are optimal in the sense that neither objective value can be further improved without worsening the other, and represents the boundary between optimal and sub-optimal solutions in the parameter space.
3.4. Optimal HepCEP Treatment Parameters with Evolutionary GA
As described above, the initial population of model parameters is randomly sampled based on the minimum and maximum values for each treatment parameter, and we use the same parameter ranges for the enrollment rate and treatment method combinations as in the parameter sweep. We use a GA population size of 100 individuals, and each individual is repeated four times using a different random seed to account for the noise in the model outputs. The objective function uses the mean values of the four stochastic runs to assess each GA individual. The GA population is evaluated for 20 generations, where each generation consists of 400 simulation runs. Thus the complete GA workflow results in 8,000 HepCEP simulation runs. We note here that the GA parameters and resulting number of runs were selected based on the available computational budget.
For each GA generation, we record the objective functions of the non-dominated GA individuals, which include the number of treatments and HCV incidence at year 2030. Figure 2 shows the Pareto-optimal solutions for each of the 20 GA generations, with each point representing a single model run that resulted in the objective values for year 2030 incidence (along the y-axis) and total number of treatments (along the x-axis). Initially the Pareto curve appears to smoothly span the parameter space, however later generations have a discontinuous set of solutions, with a local cluster forming around treatment counts of around 3,000. The remaining solutions on the Pareto front continue to vary for HCV incidence of 0 to 0.6, and treatment counts of around 8,000 to 12,000 treated individuals.
Figure 2:

Pareto-optimal solutions for each of the 20 GA generations. Each point represents a single model run in the 2D parameter space for the year 2030 relative incidence rate and the total treatment count.
The Pareto curve and treatment enrollment parameter values are combined in Figure 3 for selected GA generations. As with Figure 2, each point is a Pareto-optimal solution, but we have now visualized the treatment enrollment combinations as a pie chart for each solution. The fraction of each enrollment method is displayed as a slice of the pie charts, and the enrollment rate is shown as a numerical annotation (in units of %) on each solution. The first GA generation contains what appears to be an equal distribution of enrollment types and enrollment rate parameter values. We also observe an expected relationship between the enrollment rate parameter and the treatment count and HCV incidence, with larger enrollment rate values resulting in more treatments, and lower incidence.
Figure 3:
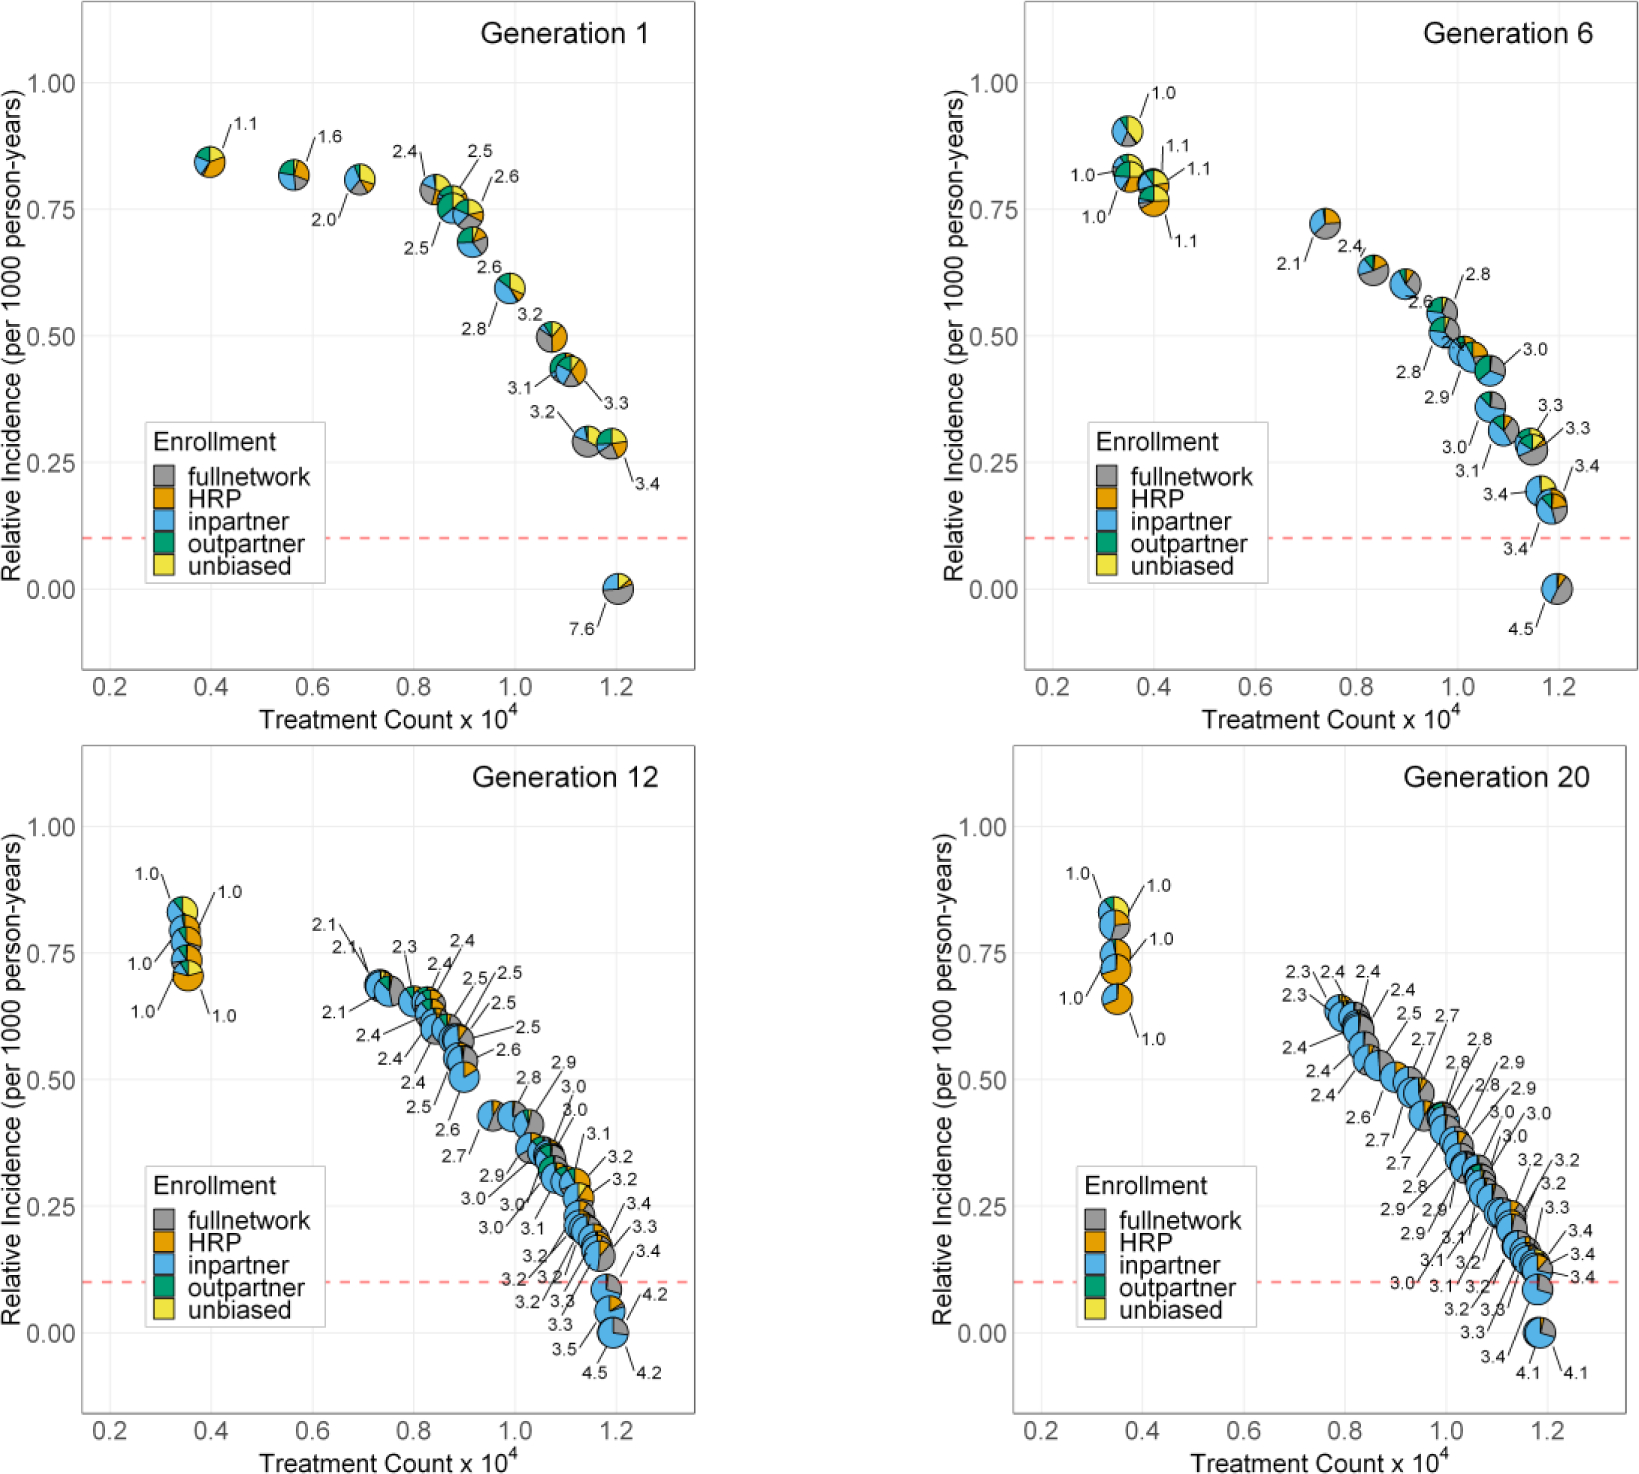
Pareto-optimal solutions for GA generations 1, 6, 12, and 20. Each pie-point represents a single model run in the 2D parameter space for the year 2030 relative incidence rate and the total treatment count. The treatment enrollment percentage for each solution is shown as an individual pie chart at each solution point. The numeric labels on each point refer to the treatment enrollment percentage for the solution. The red dashed horizontal line represents the threshold for 90% reduction in incidence in year 2030.
Successive generations produce more non-dominated GA individuals as evidenced by the increased number of solutions in Figure 3. The enrollment rate parameter value is reduced significantly for the later GA generations, while the total treatment count and incidence rates are maintained. The solution clustering around treatment counts of 3,000 all use an enrollment rate of 1% which is the lower limit for this parameter. The GA finds these pareto-optimal solutions, however from a practical point of view the incidence rates for these solutions are too high to meet the year 2030 reduction targets. Additionally, we observe that for the pareto-optimal solutions, the dominant treatment enrollment method is the in-partner network method, in which a PWID who provides syringes to the randomly recruited individual is also enrolled for treatment. The second most common enrollment methods are the full network and HRP enrollments.
3.5. Comparison of Parameter Sweep and GA Optimization Results
The GA pareto-optimal solutions in generation 20 (Figure 3) provide a well-defined boundary in the multi-objective space that separates the optimal and sub-optimal solutions. The simpler parameter sweep exploration shown in Table 1 provides a more limited view of the model objective space, so we directly compare all of the solutions from the parameter sweep and GA optimization in Figure 4.
Figure 4:

Multi-objective parameter space for all of the parameter sweep solutions (black circles) and GA generation 20 Pareto front solutions (blue circles). The GA solutions provides a discontinuous Pareto-optimal front of solutions. Solutions falling above and to the right of the Pareto front are sub-optimal with respect to the objectives for incidence and treatment count. The red dashed horizontal line represents the threshold for 90% reduction in incidence in year 2030.
Again in Figure 4 we observe the same front of Pareto-optimal solutions produced by the GA shown as blue circles, along with the parameter sweep solutions shown by black circles. The contrast between the two model exploration approaches is significant; the parameter sweep results are more spread out over the multi-objective space, and all of the simple sweep results fall entirely within the region of sub-optimal solutions located above and to the right of the Pareto front solutions. Furthermore, the sub-optimal sweep solutions tend to cluster around two locations in the objective space. First, there is a large cluster of solutions located around a treatment count of approximately 9,000. These solutions have a markedly lower treatment count that the results shown in Table 1, however the objective for year 2030 incidence for these solutions is poor, ranging from 0.6 to 1.0, indicating these combinations of enrollment parameters do not result in the desired 90% reduction in incidence by year 2030.
The second notable clustering of solutions in Figure 4. for the parameter sweep are for solutions with a year 2030 incidence rate at, or near, zero. These solutions are reflected in the results shown in Table 1. The sweep solution results with a year 2030 zero incidence rate certainly meet the incidence reduction goals, though there is considerable variance in the number of treatment counts for these solutions. The GA pareto-optimal solutions, in contrast to the sweep solutions, result in only optimal solutions for the treatment counts with year 2030 incidence rates of zero. The best GA optimal solution with zero incidence in year 2030 has 11,818 total treatments, compared to the best parameter sweep solution of 11,949 treatments, representing a cost savings of $3,275,000 between the two solution approaches.
4. CONCLUSIONS
The HepCEP model provides meaningful insight into the effect of DAA treatment administration on HCV incidence among PWID over time. Brute-force parameter sweeps with HepCEP were shown to partly characterize the model parameter space. An evolutionary GA model approach to parameter space exploration was shown to strategically produce a model solution set of desired characteristics, with results that are easier to interpret. Moreover, the GA-based Pareto-optimal solution curves do not provide a single best solution for reaching the WHO goal, but rather a range of treatment enrollment solutions that could inform the development of public health policy and strategies that would most effectively promote HCV elimination among PWID. Although we selected the WHO goal of 90% reduction in incidence by year 2030 as the criterion for treatment enrollments, the GA approach does provide other potentially useful solutions that allow approaching this goal. In practice, where additional outcome constraints exist, such as the unavailability of certain treatment methods, the GA approach could be used to select available treatment methods that result in the lowest possible incidence. The GA approach was also shown to elucidate enrollment solutions that achieved the target goal at substantially lower cost than the parameter sweep.
The treatment enrollment methods that achieve a 90% reduction in incidence by year 2030 are those that largely combine in-network, full-network recruitment, and harm reduction programs, i.e., policies that are targeted to specific sub-populations of PWID (e.g., individual with an injection network). Interestingly, (Zelenev et al. 2018) showed that random strategies were the most effective approach to reduce HCV prevalence, which is in agreement with a network-based analysis done outside the USA (Hellard et al. 2014). In contrast, HepCEP showed that, in the Chicago context, exploiting PWID network structures by targeting individuals who may have transmitted the infection to the primary PWID resulted in the lowest number of treatments and incidence.
The current multi-objective GA exploration only considers the HCV incidence at year 2030, and the total number of treatments. However, based on the existing simulation results, it’s clear that the relative incidence rate in PWID can be reduced to approximately zero before year 2030 depending on the combination of treatment enrollment methods and enrollment rates. Future studies should include more multi-objective criteria that account for incidence rates at each year, so that treatment combinations and enrollment rates that result in earlier reduction of incidence are preferred to those that only reduce incidence by the last year of treatment. A more complex evaluation of cost may also consider the length of time that treatment enrollment programs are operating versus an increased initial enrollment rate, along with variable enrollment rates per year and incorporate estimates of operating costs associated with specific recruitment strategy activities such as outreach approaches and testing.
ACKNOWLEDGMENTS
This research is supported by NIH grant R01GM121600 and is based upon work supported by the U.S. Department of Energy, Office of Science, under contract DE-AC02-06CH11357, and was completed with resources provided by the Research Computing Center at the University of Chicago (Midway2 cluster) and the Laboratory Computing Resource Center at Argonne National Laboratory (Bebop cluster).
AUTHOR BIOGRAPHIES
ERIC TATARA, PhD, PE, is a member of the Consortium for Advanced Science and Engineering of the University of Chicago and a software engineer in the Decision and Infrastructure Sciences Division of Argonne National Laboratory. His email address is tatara@anl.gov.
NICHOLSON T. COLLIER, PhD, is a member of the Consortium for Advanced Science and Engineering of the University of Chicago and a software engineer in the Decision and Infrastructure Sciences Division of Argonne National Laboratory. His email address is ncollier@anl.gov.
JONATHAN OZIK, PhD, is a Senior Scientist in the Consortium for Advanced Science and Engineering of the University of Chicago and a computational scientist in the Decision and Infrastructure Sciences Division of Argonne National Laboratory, and Lecturer at the Harris School of Public Policy, University of Chicago. His email address is jozik@anl.gov.
ALEXANDER GUTFRAIND, PhD, is a Lecturer at the Division of Hepatology, Department of Medicine, Loyola University Chicago, Chicago, IL. His email address is agutfraind.research@gmail.com.
SCOTT J. COTLER, MD, is the Director of the Division of Hepatology at Loyola University Medical Center. His email address is scott.cotler@luhs.org.
HAREL DAHARI, PhD, is an Associate Professor and co-direct a cross-disciplinary Program for Experimental & Theoretical Modeling (PETM) in the Division of Hepatology at Loyola University Medical Center. His email address is hdahari@luc.edu.
MARIAN MAJOR, PhD, is currently Chief of the Laboratory of Hepatitis Viruses in the Center for Biologics Research and Evaluation, US Food and Drug Administration. Her email address is marian.major@fda.hhs.gov.
BASMATTEE BOODRAM, PhD, is an Associate Professor in the Division of Community Health Sciences, School of Public Health, University of Illinois at Chicago. Her email address is bboodram@uic.edu.
Contributor Information
Jonathan Ozik, Decision and Infrastructure Sciences Division, Argonne National Laboratory, 5735 S Ellis Ave, Chicago, IL 60637, USA.
Harel Dahari, Division of Hepatology, Dept of Medicine, Loyola University Medical Center, 2160 S 1st Ave, Maywood, IL 60153, USA.
Marian Major, Division of Viral Products, US Food and Drug Administration, 10903 New Hampshire Ave, Silver Spring, MD 20993, USA.
Basmattee Boodram, School of Public Health, University of Illinois at Chicago, 1603 W Taylor St, Chicago, IL 60612, USA.
REFERENCES
- Alter MJ 2007. “Epidemiology of Hepatitis C Virus Infection”. World Journal of Gastroenterology 13 (17):2436–2441. [DOI] [PMC free article] [PubMed] [Google Scholar]
- Bethea ED, Chen Q, Hur C, Chung RT, and Chhatwal J. 2018. “Should We Treat Acute Hepatitis C? A Decision and Cost-Effectiveness Analysis”. Hepatology 67 (3):837–846. [DOI] [PMC free article] [PubMed] [Google Scholar]
- Bruggmann P 2013. “Treatment as Prevention: The Breaking of Taboos Is Required in the Fight against Hepatitis C among People Who Inject Drugs”. Hepatology 58 (5):1523–1525. [DOI] [PubMed] [Google Scholar]
- Colllier N, and North M. 2013. “Parallel Agent-Based Simulation with Repast for High Performance Computing”. Simuation 89 (10):1215–1235. [Google Scholar]
- Dahari H, and Boodram B. 2018. “How to Eliminate Hcv in People Who Inject Drugs in the USA”. The Lancet Infectious Diseases 18 (2):134–135. [DOI] [PMC free article] [PubMed] [Google Scholar]
- Deb K, Pratap A, Agarwal S, and Meyarivan T. 2002. “A Fast and Elitist Multiobjective Genetic Algorithm: Nsga-Ii”. IEEE Transactions on Evolutionary Computation 6 (2):182–197. [Google Scholar]
- El-Serag HB 2012. “Epidemiology of Viral Hepatitis and Hepatocellular Carcinoma”. Gastroenterology 142 (6):1264–1273. [DOI] [PMC free article] [PubMed] [Google Scholar]
- Fortin F-A, De Rainville F-M, Gardner M-A, Parizeau M, and Gagné C. 2012. “Deap: Evolutionary Algorithms Made Easy”. Journal of Machine Learning Research 13 (1):2171–2175. [Google Scholar]
- Gutfraind A, Boodram B, Prachand N, Hailegiorgis A, Dahari H, and Major ME. 2015. “Agent-Based Model Forecasts Aging of the Population of People Who Inject Drugs in Metropolitan Chicago and Changing Prevalence of Hepatitis C Infections”. PLOS ONE 10 (9):e0137993. [DOI] [PMC free article] [PubMed] [Google Scholar]
- Hellard M, Rolls DA, Sacks-Davis R, Robins G, Pattison P, Higgs P, Aitken C, and McBryde E. 2014. “The Impact of Injecting Networks on Hepatitis C Transmission and Treatment in People Who Inject Drugs”. Hepatology 60 (6):1861–1870. [DOI] [PubMed] [Google Scholar]
- Holland JH 1992. Adaptation in Natural and Artificial Systems: An Introductory Analysis with Applications to Biology, Control, and Artificial Intelligence, Adaptation in Natural and Artificial Systems: An Introductory Analysis with Applications to Biology, Control, and Artificial Intelligence. Cambridge, MA: MIT Press [Google Scholar]
- Ozik J, Collier NT, Wozniak JM, and Spagnuolo C. 2016. From Desktop to Large-Scale Model Exploration with Swift/T. 2016 Winter Simulation Conference (WSC), 11–14 Dec. 2016, Washington, DC. [DOI] [PMC free article] [PubMed] [Google Scholar]
- Tempalski B, Pouget ER, Cleland CM, Brady JE, Cooper HL, Hall HI, Lansky A, West BS, and Friedman SR. 2013. “Trends in the Population Prevalence of People Who Inject Drugs in Us Metropolitan Areas 1992–2007”. PLoS One 8 (6):e64789. [DOI] [PMC free article] [PubMed] [Google Scholar]
- Wozniak JM, Armstrong TG, Wilde M, Katz DS, Lusk E, and Foster IT. 2013. Swift/T: Large-Scale Application Composition Via Distributed-Memory Dataflow Processing. 2013 13th IEEE/ACM International Symposium on Cluster, Cloud, and Grid Computing, 13–16 May 2013. [Google Scholar]
- Zelenev A, Li J, Mazhnaya A, Basu S, and Altice FL. 2018. “Hepatitis C Virus Treatment as Prevention in an Extended Network of People Who Inject Drugs in the USA: A Modelling Study”. Lancet Infectious Diseases 18 (2):215–224. [DOI] [PMC free article] [PubMed] [Google Scholar]