

Abstract
Background
Environmental health risks for individuals with heart failure (HF) have been inadequately studied, as these individuals are not well represented in traditional cohort studies. To address this we studied associations between long‐term air pollution exposure and mortality in HF patients.
Methods and Results
The study population was a hospital‐based cohort of individuals diagnosed with HF between July 1, 2004 and December 31, 2016 compiled using electronic health records. Individuals were followed from 1 year after initial diagnosis until death or the end of the observation period (December 31, 2016). We used Cox proportional hazards models to evaluate the association of annual average fine particulate matter (PM 2.5) exposure at the time of initial HF diagnosis with all‐cause mortality, adjusted for age, race, sex, distance to the nearest air pollution monitor, and socioeconomic status indicators. Among 23 302 HF patients, a 1 μg/m3 increase in annual average PM 2.5 was associated with an elevated risk of all‐cause mortality (hazard ratio 1.13; 95% CI, 1.10–1.15). As compared with people with exposures below the current national PM 2.5 exposure standard (12 μg/m3), those with elevated exposures experienced 0.84 (95% CI, 0.73–0.95) years of life lost over a 5‐year period, an observation that persisted even for those residing in areas with PM 2.5 concentrations below current standards.
Conclusions
Residential exposure to elevated concentrations of PM 2.5 is a significant mortality risk factor for HF patients. Elevated PM 2.5 exposures result in substantial years of life lost even at concentrations below current national standards.
Keywords: air pollution, electronic health record, heart failure, mortality, PM2.5
Subject Categories: Epidemiology, Risk Factors, Heart Failure
Clinical Perspective
What Is New?
The environmental health risks of heart failure have been understudied despite evidence that these patients are at increased risk relative to the general population.
We observe that among individuals with heart failure, long‐term exposure to particulate matter air pollution at their primary residence conferred a significant mortality risk and is associated with substantial years of life lost.
Mortality risk differed slightly by heart failure subtype (systolic versus diastolic) in some models.
What Are the Clinical Implications?
The robust association between increasing mortality and increasing concentrations of ambient particulate matter raises the question of whether clinical interventions to lower residential exposures to particulate matter would result in improved clinical outcomes.
Long‐term air pollution exposure remains one of the most significant risk factors for mortality worldwide, a trend that may be increasing despite improvements in air quality in many nations.1 Reasons for this increasing mortality burden from poor air quality include advancing age and the increasing prevalence of chronic disease conditions, both of which can increase sensitivity to poor air quality. Heart failure (HF) is one of the most severe forms of cardiovascular disease, with HF patients having a median life expectancy <5 years.2, 3 Improvements in care, combined with an aging population and stable incidence, result in an increasing prevalence of HF in the United States, with a projected 8 million adults to have HF in 2030 (46% increase over 2012).4 Still, recent gains in survival rates for HF patients lag behind those for many other common chronic diseases.5
Individuals with HF have substantial environmental health risks,6, 7, 8, 9, 10 which are generally elevated as compared with the general population or with individuals with less severe heart disease.10, 11, 12 HF‐related deaths may account for nearly 1 out of every 3 deaths due to airborne particulate matter exposure,11 and elevated particulate matter air pollution (primarily particles <2.5 μm in diameter [PM2.5]) contributes to hundreds of millions of dollars in HF‐related morbidity and mortality costs and several thousand HF‐related hospital admissions.9
Most environmental health studies of individuals with HF have focused on short‐term exposures, and, to date, no study has examined associations with long‐term air pollution exposures exclusively in the HF patient community.13 Existing knowledge on the long‐term exposure effects is currently extrapolated from studies of the general population that conduct secondary stratified (ie, subgroup) analyses on HF deaths.12 This results in a lack of knowledge of health risks based on exposures at the time of HF diagnosis and on the modification of these health risks by factors such as systolic versus diastolic HF, preexisting conditions such as type 2 diabetes mellitus or hypertension, and demographic factors such as age and sex. The Environmental Protection Agency Clinical and Archived Records Research for Environmental Studies (EPA CARES) research program is a collaborative effort between the EPA and the North Carolina Translational and Clinical Sciences Institute at the University of North Carolina at Chapel Hill (UNC) to utilize electronic health records (EHRs) to examine health effects in the hospital‐going population of North Carolina. Using EPA CARES, we have examined the relationship between long‐term exposure to PM2.5 and mortality among individuals with HF.
Methods
The data that support the findings of this study are available from the corresponding author on reasonable request and appropriate approval from the UNC–Chapel Hill Institutional Review Board.
Study Cohort
All participants in this study were sourced from the Carolina Data Warehouse for Health, the enterprise data warehouse for the UNC Health Care System. The Carolina Data Warehouse for Health contains clinical and administrative data from both UNC Health Care System's Epic EHR (2014–present) and its homegrown legacy EHR, WebCIS (2004–2014). This study was approved by UNC–Chapel Hill Institutional Review Board (IRB 17‐0150). As a secondary analysis of already collected data, written, informed consent was waived.
The study cohort was composed of individuals with a recorded diagnosis of HF between July 1, 2004 and December 31, 2016. HF was defined according to the International Classification of Diseases, Ninth Revision (ICD‐9) codes 428.x and the International Classification of Diseases, Tenth Revision (ICD‐10) codes I50.x. We also identified whether individuals were diagnosed with diastolic HF (ICD‐10 I50.3, I50.81; ICD‐9 428.3) versus systolic HF (ICD‐10 I50.1, I50.2; ICD‐9 428.1, 428.2). Individuals were then linked to demographics, address history, hospital and state death records, and disease diagnosis history. Records with inconsistent birth, death, or visit dates were removed. Addresses were cleaned for spelling mistakes as well as addresses that could not be geocoded. We considered an address to be successfully geocoded at the zip code level or better and successfully geocoded 99.9% of all addresses. The full geocoding procedure is given in Data S1 (Expanded Methods—Geocoding Procedure). We assigned annual average PM2.5 values based on the nearest ground‐based monitor to the listed primary residential address at the time of the heart failure diagnosis, defined as the first visit where heart failure was listed in the medical history, as well as based on an ensemble model of daily PM2.5 concentrations at a 1×1‐km resolution, which were then averaged to create an annual average.14 We restricted the study to participants who resided in North Carolina. To remove HF cases likely to be due to congenital disease, we removed any participants diagnosed with HF at age 20 or younger.
Air Pollution Data
Daily PM2.5 values were obtained from the EPA National Ambient Air Quality Standards (NAAQS) ground‐based monitoring network. Data were obtained for the period July 1, 2003 through December 31, 2016. After geocoding the study cohort and determining the nearest monitor, the annual average was defined as the average daily PM2.5 exposure over the 365 days preceding the examination based on the date and primary address at the time of initial heart failure, based on the patient's EHR. Monitors were required to have a minimum of 100 days measured for analysis. We also obtained daily air quality data from an ensemble model incorporating satellite measurements, land use regression variables, and several other predictors. The model uses 3 machine learning algorithms to integrate predictors and estimate daily PM2.5 exposure at 1×1‐km grids for the continental United States. The model had an r 2 of 0.89 for the Middle Atlantic region of the United States (which would include North Carolina) for the years 2000‐2015.14 Data were obtained for the years 2003‐2016 for the state of North Carolina.
In addition to the annual average air pollution, we also examined associations with an indicator variable for residence within areas with annual averages below the current NAAQS for annual average PM2.5 of (12 μg/m3). Because the implementation of national regulations has caused air quality to trend downwards over the study period in a roughly linear fashion, air quality data were detrended before analyses to remove the linear time trend and potential confounding from non–air quality–related variables that also trended over time.
Statistical Analysis
We used a Cox proportional hazards model to model the association between annual average PM2.5 exposure at the time of HF diagnosis and all‐cause mortality. We used a nested confounder adjustment strategy composed of a basic model, which adjusted for age, sex, race, and distance to the nearest monitor, and a full model that adjusted for age, sex, race, distance to the nearest monitor, and neighborhood level socioeconomic variables assessed at the census block group based on the 2000 Census. The socioeconomic variables included were median income, median house value, percentage of individuals on public assistance, urbanicity, and percentage of households below the federal poverty line. Confounders were chosen a priori. In visualizing the follow‐up time for participants, an excess of participants had a recorded death with a follow‐up time <1 year. This excess does not follow typical mortality patterns for HF patients5 and is likely due either to late diagnosis of HF in patients who had had the disease for years, a failure of the EHR to properly capture earlier diagnoses, or patients diagnosed at other hospital systems and coming to the UNC Health Care System only as their condition worsened. When models were compared with all patients, excluding deaths (and associated person‐time) within 1 year, it was seen that the proportional hazards assumption was better met in models where the year after diagnosis was excluded as an at‐risk time and was consistently violated in models with all person‐time included. Thus, we excluded the year after diagnosis as time at risk for all individuals. This had the effect of potentially making estimates applicable only to medium‐ to long‐term mortality as opposed to potential mortality immediately after diagnosis.
Our primary outcome was all‐cause mortality. We used stratified (ie, subgroup) analyses to examine potential effect modification by age at HF diagnosis (20‐50, 50‐65, and 65+), sex, race, and previous diagnosis of chronic obstructive pulmonary disorder, type 2 diabetes mellitus, ischemic heart disease, lipid disorders, pulmonary disease, primary essential hypertension, and peripheral arterial disease. Definitions of the disease outcomes by ICD‐9 and ICD‐10 codes appear in Data S1 (Expanded Methods, comorbid disease ICD‐9 and ICD‐10 codes). We also stratified individuals on diagnosis of systolic versus diastolic HF to determine if associations differed by HF subtype. Because the 1×1‐km grids had complete representation across the state, whereas the monitors were typically placed in urban centers, we used the modeled PM2.5 data to examine associations in urban versus rural areas, defining urban areas as year 2000 census block groups that were 100% urban (which captured slightly more than the top third of the distribution), and rural areas as those in the bottom third of the urbanicity distribution (<37% urban).
To examine the sensitivity of our results to individuals residing far from a ground‐based monitor, we considered 2 levels of monitor radius restriction, individuals within 30 km of a monitor versus individuals within 8 km. Results were equivalent for the primary analyses, so we present results for the 30‐km restriction. We also used the 1×1‐km modeled PM2.5 data as a robustness check for this, as the modeled data cover all participants. Potential geographic heterogeneity was evaluated via a mixed‐effects Cox regression model that included a random intercept for county of residence. This type of mixed‐effects Cox regression model is also called a shared frailty model. To evaluate effects below the current PM2.5 annual average NAAQS, we performed an analysis restricted to those individuals with annual average PM2.5 exposure <12 μg/m3.
We estimated years of life lost by first estimating the baseline hazard for the participants. We then model associations using a binary indicator for annual average PM2.5 <12 μg/m3 to estimate the mortality risk conferred by residing in areas above this cutoff. The years of life lost were determined by the excess number of deaths seen from 2 to 5 years (excluding year 1, as this was not counted in person‐time at risk in models) based on a mortality hazard proportionally increased by the amount estimated from the aforementioned model. We evaluated sensitivity to diagnoses near the December 31, 2016 study end date by examining a subcohort of those with a HF diagnosis before January 1, 2014. Failing to observe a death can result in “immortal person time,” which could bias analyses. To examine this potential bias, we performed 1 sensitivity analysis that removed individuals who were outliers (+3SD) for age at the end of observation (death or December 31, 2016) and 1 in which we removed individuals with an age at end of observation >100 years. Results are reported as the hazard ratio (HR) and associated 95% CI.
Software
All analyses were run in R (R Foundation, Vienna, Austria) version 3.5.3.15 A relational database constructed in part using FDTool (https://github.com/USEPA/FDTool)16 and implemented in Microsoft SQL Server was used to manage the data, with database documentation managed using Dataedo (Gdansk, Poland). Maps were created using ArcGIS version 10.7 (Esri, Redlands, CA), and geocoding was performed using SAS version 9.4 (SAS Institute, Cary, NC).
Results
Figure 1 shows the distribution of study participants in North Carolina. A total of 35 084 HF patients had sufficient data for analyses; however, after the restriction of observing events 1 year after HF diagnosis had been applied, only 23 302 individuals contributed person‐time at risk and to the analysis. The clinical covariates of these individuals are given in Table 1. The distribution of PM2.5 in North Carolina using the 1×1‐km resolution modeled values for 2004 and 2016 is given in Figure S1.
Figure 1.
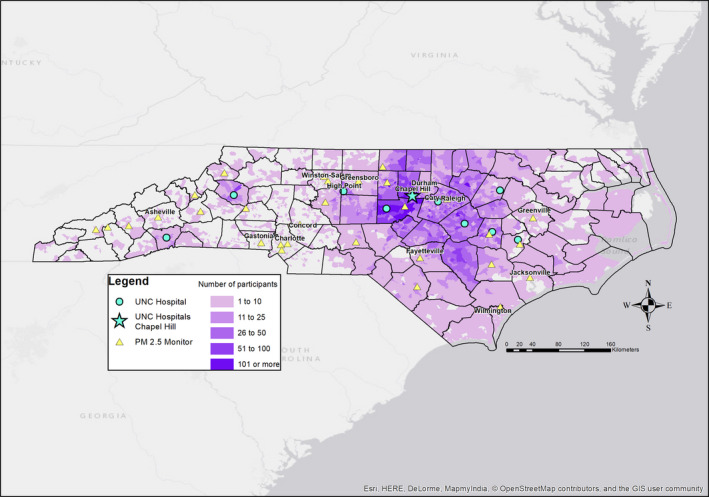
Map of HF patients. A map of the density of HF patients in CARES by census block group. Darker shading indicates a higher density of observed HF patients. Also indicated are the UNC‐affiliated hospitals (blue circles) with the flagship hospital, located in Chapel Hill, NC, given as a blue star. EPA PM 2.5 monitors are represented as yellow triangles. CARES indicates Clinical and Archived Records Research for Environmental Studies; EPA, Environmental Protection Agency; HF, heart failure; PM 2.5, particulate matter <2.5 μm in diameter; UNC, University of North Carolina.
Table 1.
Clinical Covariates
| Clinical Covariates (N=23 302) | Mean | SD | IQR |
|---|---|---|---|
| Age (y) | 66.9 | 15.2 | 22.2 |
| Follow‐up time (y) | 4.23 | 3.14 | 4.05 |
| Distance to monitor (km) | 21.6 | 18.3 | 21.9 |
| PM2.5 (Monitor) (μg/m3) | 10.2 | 2.11 | 3.36 |
| PM2.5 (1×1‐km model) (μg/m3) | 10.3 | 1.70 | 2.45 |
| Households below federal poverty line (%) | 18.6 | 15.0 | 19.4 |
| Median home value ($) | 177 041 | 106 435 | 114 100 |
| Median household income ($) | 51 881 | 25 924 | 29 962 |
| Urbanicity (%) | 62.7 | 42.2 | 89.9 |
| Households receiving public assistance (%) | 2.00 | 3.01 | 2.94 |
| N | % | ||
| Black | 7063 | 30.3 | |
| White | 14 216 | 61.0 | |
| Other race | 2023 | 8.7 | |
| Male | 11 224 | 48.2 | |
| Within 30 km of monitor | 17 212 | 73.9 | |
| Within 8 km of monitor | 4849 | 20.8 | |
| Death (all cause) | 4496 | 19.3 | |
| Type 2 diabetes mellitus | 7853 | 33.7 | |
| IHD | 13 260 | 56.9 | |
| COPD | 8293 | 35.6 | |
| PAD | 8195 | 35.2 | |
| Hypertension | 17 027 | 73.1 | |
| Dyslipidemia | 17 215 | 73.9 | |
| Systolic HF | 7120 | 30.6 | |
| Diastolic HF | 6385 | 29.3 |
Clinical covariates for the HF patients. Units of measurement for continuous variables given in parentheses. Households below federal poverty line, median home value, median household income, urbanicity, and households receiving public assistance assessed at the block‐group level based on the 2000 US Census. Numbers of systolic and diastolic HF patients do not sum to the total because many had an unspecified HF subtype in their medical record. COPD indicates chronic obstructive pulmonary disorder; HF, heart failure; IHD, ischemic heart disease; IQR, interquartile range; PAD, peripheral arterial disease; PM2.5, particulate matter <2.5 μm in diameter.
We report results for the full model here, with results for the basic and full model appearing in Table S1. Results were concordant for the basic and full models, indicating little evidence of confounding by the additional covariates in the full model. A 1 μg/m3 higher annual average PM2.5 exposure was associated with a HR of 1.13 (95% CI, 1.10–1.15) for all‐cause mortality (Figure 2; Table 2; Table S1). Although there was a slight trend for increasing mortality risk with increasing age at diagnosis, there was no substantial difference in risks when data were stratified on sex, race, or preexisting comorbidities including ischemic heart disease.
Figure 2.
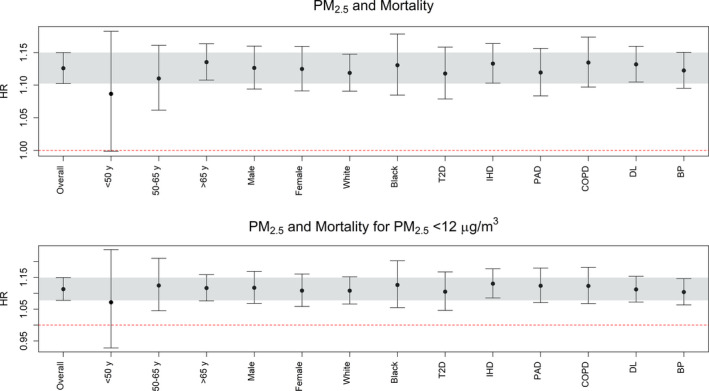
Associations between annual average PM 2.5 exposure and all‐cause mortality among HF patients. The top graph gives the association for all exposure levels, and the bottom graph is restricted to residences with exposure below the 12 μg/m3 NAAQS for annual average PM 2.5. The full‐adjustment model was used, and the association in the entire population is given on the far left (“Overall”). The gray bar indicates the 95% CI for the “overall” association, and stratified analyses are listed based on age, sex, race, and existing comorbidities. Tabular results are given in Table S3. BP indicates hypertension; COPD, chronic obstructive pulmonary disorder; DL, dyslipidemia; HF, heart failure; HR, hazard ratio; IHD, ischemic heart disease; NAAQS, National Ambient Air Quality Standard; PAD, peripheral arterial disease; PM 2.5, particulate matter <2.5 μm in diameter; T2D, type 2 diabetes mellitus.
Table 2.
Sensitivity Analyses for Association Between PM2.5 Exposure Estimated From Regulatory Monitoring Network and All‐Cause Mortality Stratified by HF Subtype
| All Individuals | Diastolic HF | Systolic HF | ||||
|---|---|---|---|---|---|---|
| HR (95% CI) | N (Deaths) | HR (95% CI) | N (Deaths) | HR (95% CI) | N (Deaths) | |
| Primary analysis | 1.13 (1.10–1.15) | 23 012 (4445) | 1.09 (1.05–1.13) | 6315 (1449) | 1.07 (1.03–1.11) | 7041 (1055) |
| Restricted to exposures with PM2.5 <12 μg/m3 | 1.11 (1.08–1.15) | 18 055 (2151) | 1.08 (1.02–1.15) | 4853 (687) | 1.08 (1.02–1.15) | 6228 (696) |
| Restricted to participants <30 km from monitor | 1.12 (1.09–1.15) | 16 787 (3460) | 1.07 (1.03–1.12) | 4883 (1224) | 1.08 (1.03–1.13) | 5113 (836) |
| Primary analysis with random intercept for county | 1.16 (1.13–1.19) | 23 012 (4445) | 1.12 (1.07–1.16) | 6315 (1449) | 1.07 (1.03–1.11) | 7041 (1055) |
We conducted a series of sensitivity analyses to understand the robustness of our primary analysis for all individuals, those with diastolic HF, and those with systolic HF. All results are from the full model adjusted for age, sex, race, distance to the nearest monitor, median income, median house value, percentage of individuals on public assistance, urbanicity, and percentage of households below the federal poverty line. HF indicates heart failure; HR, hazard ratio; PM2.5, particulate matter <2.5 μm in diameter.
When we examined associations using the modeled air pollution data at 1×1‐km resolution, we observed similar, often stronger, associations than when we used the monitor data (Table S2). Use of the 1×1‐km model allowed us to assess if associations differed by urban versus rural areas. As compared with 2000 Census block groups in the bottom third of the urbanicity distribution (urbanicity <37%), individuals in block groups that were 100% urban (39% of data) had slightly stronger associations with mortality, but the 95% CIs overlapped substantially. Rural residents had an HR of 1.19 (95% CI, 1.14–1.24), whereas urban residents had a HR of 1.22 (95% CI, 1.17–1.27) (Table S2).
Using the regulatory, ground‐based monitor data, we observed no differences in the associations for the sensitivity analyses restricted by HF diagnosis date or age at end of observation or when restricted to individuals with at least 1 prior visit (Table S3). Associations for patients diagnosed with systolic versus diastolic HF were generally similar except in the mixed‐effects model (Table 2), where associations were stronger for those with diastolic HF. This indicates that after accounting for differences in baseline hazard by county, individuals with diastolic HF might be more sensitive to long‐term PM2.5 exposure. Clinical covariates for systolic versus diastolic HF patients are in Table S4.
When the study was restricted to individuals residing in areas with annual average PM2.5 <12 μg/m3, we still observed significant associations equivalent to those seen in the full PM2.5 distribution (Figure 2 bottom; Table 2). HF patients residing in areas with annual average PM2.5 ≥12 μg/m3 had an almost 2‐fold higher mortality risk than HF patients with lower exposures (HR 1.77; 95% CI, 1.66–1.89; Table S5).
Use of a mixed‐effects model with a random intercept for county to adjust for heterogeneity between counties revealed no evidence of confounding by county‐level geographic heterogeneity (Table 2). A concentration‐response curve using either the modeled 1×1‐km PM2.5 data (Figure 3) or the monitor data (Figure S2) for all‐cause mortality indicated an approximately linear concentration‐response function for annual average PM2.5, particularly in the 8‐ to 12‐μg/m3 range. There was some thresholding outside this range, but whether this indicates a leveling off of risk or is more driven by a relative lack of observations will need to be evaluated in cohorts with broader ranges of observed concentrations. We used the data from the regulatory PM2.5 monitoring network in a mixed effects model with county‐specific intercepts to estimate the years of life lost for someone residing in an area with PM2.5 >12 μg/m3 as compared with someone living below this level to be 0.84 years (95% CI, 0.73–0.95) over a 5‐year period. This effect persisted even when exposures were restricted to below 12 μg/m3. Stratifying the median exposure (10.1 μg/m3) for individuals with PM2.5 concentrations <12 μg/m3, we observed 0.54 (95% CI, 0.40–0.69) years of life lost for above‐median exposures as compared with below‐median exposures.
Figure 3.
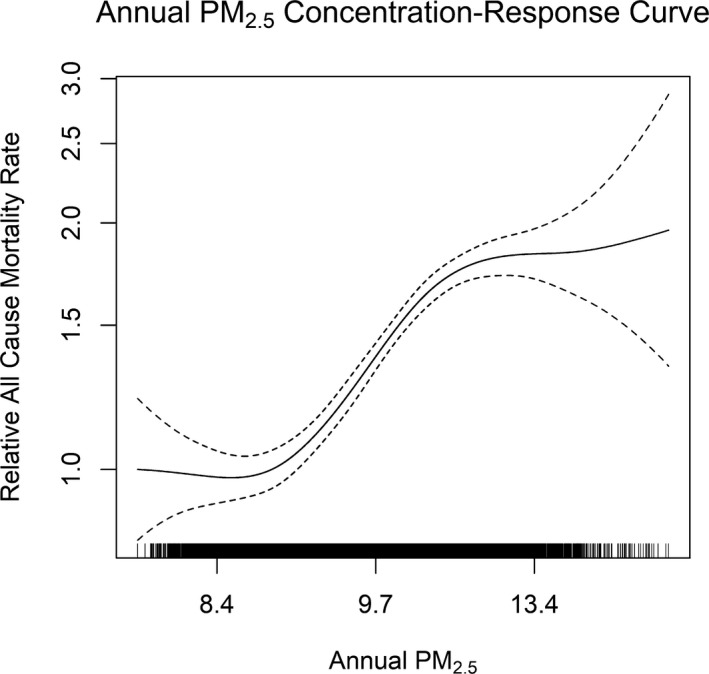
Concentration‐response curve for all‐cause mortality for annual average PM 2.5 exposure based on modeled PM 2.5 concentrations at 1×1‐km resolution.14 Concentration‐response curve limited to PM 2.5 concentrations within the inner 95% of the distribution (values >8.0 μg/m3 and <14 μg/m3) as the confidence intervals widened considerably beyond this range. The curve is broadly similar to that seen when using the monitors (particularly for concentrations from 9 to 12 μg/m3; Figure S2) with perhaps better behavior toward the upper end of the concentration distribution. PM 2.5 indicates particulate matter <2.5 μm in diameter.
Discussion
The increasing prevalence of HF in the United States,4 its high risk of mortality, and its societal burden create an imperative to identify its modifiable risk factors. The observation of a significant association between annual average PM2.5 exposure and mortality in HF patients implicates long‐term exposure to poor air quality as a risk factor for poor clinical outcomes among HF patients. These data provide further evidence that long‐term exposure to ambient air particle pollution contributes to heart disease and mortality17, 18 and underscore the need to better understand environmental exposures as potentially modifiable risk factors in highly vulnerable populations. To date, most manuscripts in air pollution epidemiology have focused on atherosclerotic disease such as coronary heart disease. Here we focus on heart failure, an understudied patient group. Patients with both heart failure and atherosclerotic disease did not differ in their associations from the overall analysis, and adjusting for ischemic heart disease did not substantially alter models (data not shown). Associations observed here are similar in magnitude to associations between PM2.5 and myocardial infarction in patients with atherosclerotic disease,19 suggesting that both HF and atherosclerotic disease patients may have high sensitivity to air pollution exposure.
Although air quality has improved substantially over the past 4 decades in the United States, millions of people live, work, and play in areas where the annual PM2.5 concentration is near or exceeds EPA's NAAQS for PM2.5. The need to understand that the effects of air quality on health are compounded by recent wildland fire–driven trends in air pollution that have seen annual average PM2.5 increases in the United States.20 Because wildland fire–generated PM2.5 increases HF emergency department visits,21 more frequent and larger wildland fires may exacerbate health effects from rising HF prevalence. Previous studies of short‐term exposures have indicated that associations between air pollution and mortality are higher for HF deaths than other causes.11, 12 To date, few studies have specifically examined air pollution exposure impacts within a HF cohort. Existing studies have focused on daily mortality with short‐term exposures,7, 9 leaving questions on the relationship between long‐term exposure and mortality unanswered.
In this study an increase of 1 μg/m3 in annual average PM2.5 at the patient's residence was associated with a 13% higher mortality risk (95% CI, 10–15). Residential exposure to annual average PM2.5 above 12 μg/m3, the current PM2.5 NAAQS, was associated with 0.84 years (95% CI, 0.73–0.95) of life lost as compared with exposures below this level. Even when we restricted data collection to HF patients with residential exposures below the current PM2.5 standard, we observed substantial years of life lost for those with elevated exposures (above the median; 10.1 μg/m3) as compared with patients with lower exposure. This suggests that the protective effect of lower residential PM2.5 exposure persists at levels well below current PM2.5 standards.
Diastolic and systolic HF differ substantially in clinical presentation. Diastolic HF is characterized by improper filling of the left ventricle during diastole, typically due to a stiffening and abnormal relaxation of the left ventricle, which result in ventricular pressure overload despite the ejection fraction being largely preserved. In contrast, systolic HF is characterized by inefficient contraction during systole due to decreased contractility (typically with enlargement) of the left ventricle. In models accounting for differential baseline mortality rates by county, we observed differences in PM2.5‐related mortality risks by systolic versus diastolic HF diagnosis with PM2.5 potentially more strongly associated with all‐cause mortality among those with diastolic HF than among those with systolic HF. Several mechanisms may account for links between PM2.5 exposure and mortality among those with HF, and in particular diastolic HF. One such mechanism goes through the differential role of reactive oxygen species (ROS) in each HF subtype. ROS dysfunction is typical in HF, and individuals with diastolic HF may have ROS dysfunction primarily linked to endothelial cells, which can then lead to prohypertrophic signaling and sarcomere stiffness. In systolic HF, ROS dysfunction may more closely be tied to myocyte function/dysfunction.22 PM2.5 exposure is strongly linked to oxidative stress and ROS production23, 24, 25, 26 and may exacerbate ROS dysfunction in HF patients. Autonomic dysfunction may be an additional mechanism linking PM2.5 exposure and mortality among HF patients. In a study of 31 HF patients, higher PM2.5 exposure was associated with lower oxygen saturation (measured by pulse oximetry) and higher heart rate,27 both of which would be impacted by autonomic dysfunction. Other mechanisms linking PM2.5 exposure and mortality in individuals with HF are dysfunction in vasoconstriction and blood pressure regulation. Long‐term air pollution exposure is associated with elevated systolic and diastolic blood pressure.28, 29, 30 HF, particularly diastolic HF, is marked by blood pressure regulation dysfunction and is often accompanied by hypertension, and PM2.5 exposure may worsen this dysfunction. We also cannot ignore the possibility of metabolic dysfunction. Type 2 diabetes mellitus is a risk factor for HF,31 and PM2.5 exposure is associated with metabolic dysfunction,32, 33, 34 providing another means by which exposure may exacerbate existing organ system dysfunction, thereby increasing mortality risk. Both hypertension and type 2 diabetes mellitus were more prevalent in diastolic HF patients, offering another potential means by which associations may differ by HF subtypes. Because much of our population resided in urban areas, combustion‐related exposures may also have played a large role. Combustion‐related PM2.5, typically derived from traffic in urban areas, is strongly associated with cardiovascular disease35 and many of the risk factors related to HF.
Strengths
This large study of over 23 000 patients is the largest environmental health study to focus exclusively on HF patients. As far as the authors are aware, this is the first study to estimate mortality risks for HF patients stratified on demographic and clinical characteristics. The use of EHRs makes extensive information available on disease diagnosis history, which has allowed us to examine differences by HF subtype and to estimate mortality risks based on residential exposure at initial indication of HF in the medical record. Much of North Carolina is exposed to PM2.5 near or below the EPA‐mandated annual average standard, which gives us the ability to explore associations at and below the mandated ambient concentrations.
Limitations
A primary limitation of this study is the incomplete capture of individual‐level confounders in EHR systems. This means that potentially important confounders such as smoking were not included in the models. This is an unfortunate but common limitation of studies such as these. However, previous studies of air quality and mortality, using similar resources, have indicated that associations are robust to the omission of such confounders.36 Another limitation of this study is that patients may use multiple hospital systems, resulting in uncertainty in the determination of the initial HF diagnosis. This date of diagnosis uncertainty is unlikely to be related to air quality and thus would not be expected to bias our associations, although it would still increase the standard error of the estimated HRs. Bias introduced by misclassification of initial HF diagnosis date would be expected to be larger for those diagnosed later in life, where there is a greater chance of previous diagnosis in a different hospital system. Additionally, sensitivity analyses restricted to individuals with a visit before their HF diagnosis, which should limit the potential for date‐of‐diagnosis misclassification, showed similar association as the primary model (Table S3). Still, analyses would be improved by expanding existing EHR resources to incorporate medical records over the complete life course.
As a hospital‐based cohort, this population may not generalize to the entire population of North Carolina; however, as most people with HF are likely to visit the hospital, this cohort is largely reflective of the HF population, particularly for more urban areas where much of the study cohort resides (Figure 1). Limited individual‐level information on socioeconomic status is available in the medical record; however, publicly available data on the socioeconomic condition of the census block group of participants were used as proxy for individual‐level socioeconomic status and thus supplemented the information available in the medical record. A final limitation was our use of ground‐based monitors for air quality assessments. Although monitor data are widely utilized for air pollution studies, they offer incomplete geographic coverage. Both the monitors and hospitals are often located near urban areas, and most of our population lived within 30 km of a monitor. However, we overcame this limitation by examining associations using modeled air quality at 1‐km resolution for the entire study period. Associations were similar and often even stronger using the modeled air quality data, something that has been observed in other studies.37
Conclusions
Long‐term residential exposure to PM2.5 is associated with all‐cause mortality in HF patients, even for exposures below the current PM2.5 NAAQS. Mortality risks may be elevated for patients with diastolic HF as compared with systolic HF. Given the magnitude of the associations and associated estimated years of life lost, understanding environmental risks and mitigating harmful exposures may provide substantial benefits to the HF patient population. With current nationwide efforts to reduce cardiovascular disease burden through education of patients and clinicians, as with Million Hearts, it is imperative that we continue to improve our understanding of the contribution of environmental exposures to cardiovascular mortality.
Sources of Funding
All funding for this study was provided by the US Environmental Protection Agency. The funder had no role in the study design, data collection, analysis, interpretation, or manuscript writing.
Disclosures
None.
Supporting information
Data S1: Expanded Methods
Table S1: Associations Between All‐Cause Mortality and PM2.5
Table S2: Associations Between All‐Cause Mortality and PM2.5 Assessed Using Modeled PM2.5 Data at 1×1‐km Resolution
Table S3: Sensitivity Analyses Based on Visit and Age at End of Observation
Table S4: Clinical Covariates for Individuals With Diastolic and Systolic Heart Failure
Table S5: Associations Between All‐Cause Mortality and Binary PM2.5 Cutoff
Figure S1: PM2.5 annual average concentration in 2004 and 2016 using modeled estimates at 1×1‐km resolution.
Figure S2: PM2.5 concentration‐response curve generated using ground‐based PM2.5 monitoring network.
Acknowledgments
This work does not necessarily represent the views or policy of the US EPA. Any mention of trade names does not constitute endorsement.
(J Am Heart Assoc. 2020;9:e012517 DOI: 10.1161/JAHA.119.012517.)
References
- 1. Cohen AJ, Brauer M, Burnett R, Anderson HR, Frostad J, Estep K, Balakrishnan K, Brunekreef B, Dandona L, Dandona R, Feigin V, Freedman G, Hubbell B, Jobling A, Kan H, Knibbs L, Liu Y, Martin R, Morawska L, Pope CA, Shin H, Straif K, Shaddick G, Thomas M, van Dingenen R, van Donkelaar A, Vos T, Murray CJL, Forouzanfar MH. Estimates and 25‐year trends of the global burden of disease attributable to ambient air pollution: an analysis of data from the Global Burden of Diseases Study 2015. Lancet. 2017;389:1907–1918. [DOI] [PMC free article] [PubMed] [Google Scholar]
- 2. Ko DT, Alter DA, Austin PC, You JJ, Lee DS, Qiu F, Stukel TA, Tu JV. Life expectancy after an index hospitalization for patients with heart failure: a population‐based study. Am Heart J. 2008;155:324–331. [DOI] [PubMed] [Google Scholar]
- 3. MacIntyre K, Capewell S, Stewart S, Chalmers J, Boyd J, Finlayson A, Redpath A, Pell J, McMurray J. Evidence of improving prognosis in heart failure: trends in case fatality in 66 547 patients hospitalized between 1986 and 1995. Circulation. 2000;102:1126–1131. [DOI] [PubMed] [Google Scholar]
- 4. Heidenreich PA, Albert NM, Allen LA, Bluemke DA, Butler J, Fonarow GC, Ikonomidis JS, Khavjou O, Konstam MA, Maddox TM, Nichol G, Pham M, Pina IL, Trogdon JG. Forecasting the impact of heart failure in the United States: a policy statement from the American Heart Association. Circ Heart Fail. 2013;6:606–619. [DOI] [PMC free article] [PubMed] [Google Scholar]
- 5. Taylor CJ, Ordóñez‐Mena JM, Roalfe AK, Lay‐Flurrie S, Jones NR, Marshall T, Hobbs FDR. Trends in survival after a diagnosis of heart failure in the United Kingdom 2000–2017: population based cohort study. BMJ. 2019;364:l223. [DOI] [PMC free article] [PubMed] [Google Scholar]
- 6. Wellenius GA, Yeh GY, Coull BA, Suh HH, Phillips RS, Mittleman MA. Effects of ambient air pollution on functional status in patients with chronic congestive heart failure: a repeated‐measures study. Environ Health. 2007;6:26. [DOI] [PMC free article] [PubMed] [Google Scholar]
- 7. Goldberg MS, Burnett RT, Valois M‐F, Flegel K, Bailar Iii JC, Brook J, Vincent R, Radon K. Associations between ambient air pollution and daily mortality among persons with congestive heart failure. Environ Res. 2003;91:8–20. [DOI] [PubMed] [Google Scholar]
- 8. Wellenius GA, Schwartz J, Mittleman MA. Particulate air pollution and hospital admissions for congestive heart failure in seven United States cities. Am J Cardiol. 2006;97:404–408. [DOI] [PubMed] [Google Scholar]
- 9. Shah ASV, Langrish JP, Nair H, McAllister DA, Hunter AL, Donaldson K, Newby DE, Mills NL. Global association of air pollution and heart failure: a systematic review and meta‐analysis. Lancet. 2013;382:1039–1048. [DOI] [PMC free article] [PubMed] [Google Scholar]
- 10. Goldberg MS, Burnett RT, Bailar JC, Tamblyn R, Ernst P, Flegel K, Brook J, Bonvalot Y, Singh R, Valois MF, Vincent R. Identification of persons with cardiorespiratory conditions who are at risk of dying from the acute effects of ambient air particles. Environ Health Perspect. 2001;109:487–494. [DOI] [PMC free article] [PubMed] [Google Scholar]
- 11. Hoek G, Brunekreef B, Fischer P, van Wijnen J. The association between air pollution and heart failure, arrhythmia, embolism, thrombosis, and other cardiovascular causes of death in a time series study. Epidemiology. 2001;12:355–357. [DOI] [PubMed] [Google Scholar]
- 12. Pope CA III, Burnett RT, Thurston GD, Thun MJ, Calle EE, Krewski D, Godleski JJ. Cardiovascular mortality and long‐term exposure to particulate air pollution: epidemiological evidence of general pathophysiological pathways of disease. Circulation. 2004;109:71–77. [DOI] [PubMed] [Google Scholar]
- 13. U.S. Environmental Protection Agency . U.S. EPA. Integrated Science Assessment (ISA) for Particulate Matter (Final Report, Dec 2009). Washington, DC, EPA/600/R‐08/139F, 2009.
- 14. Di Q, Amini H, Shi L, Kloog I, Silvern R, Kelly J, Sabath MB, Choirat C, Koutrakis P, Lyapustin A, Wang Y, Mickley LJ, Schwartz J. An ensemble‐based model of PM2.5 concentration across the contiguous United States with high spatiotemporal resolution. Environ Int. 2019;130:104909. [DOI] [PMC free article] [PubMed] [Google Scholar]
- 15. R Core Team; R: A language and environment for statistical computing. 2018. [Google Scholar]
- 16. Buranosky M, Stellnberger E, Pfaff E, Diaz‐Sanchez D, Ward‐Caviness C. FDTool: a Python application to mine for functional dependencies and candidate keys in tabular data [version 2; peer review: 2 approved]. F1000Research. 2019;7. [DOI] [PMC free article] [PubMed] [Google Scholar]
- 17. Kaufman JD, Adar SD, Barr RG, Budoff M, Burke GL, Curl CL, Daviglus ML, Roux AVD, Gassett AJ, Jacobs DR, Kronmal R, Larson TV, Navas‐Acien A, Olives C, Sampson PD, Sheppard L, Siscovick DS, Stein JH, Szpiro AA, Watson KE. Association between air pollution and coronary artery calcification within six metropolitan areas in the USA (the Multi‐Ethnic Study of Atherosclerosis and Air Pollution): a longitudinal cohort study. Lancet. 2016;388:696–704. [DOI] [PMC free article] [PubMed] [Google Scholar]
- 18. Brook RD, Rajagopalan S, Pope CA 3rd, Brook JR, Bhatnagar A, Diez‐Roux AV, Holguin F, Hong Y, Luepker RV, Mittleman MA, Peters A, Siscovick D, Smith SC Jr, Whitsel L, Kaufman JD. Particulate matter air pollution and cardiovascular disease: an update to the scientific statement from the American Heart Association. Circulation. 2010;121:2331–2378. [DOI] [PubMed] [Google Scholar]
- 19. McGuinn LA, Ward‐Caviness C, Neas LM, Schneider A, Di Q, Chudnovsky A, Schwartz J, Koutrakis P, Russell AG, Garcia V, Kraus WE, Hauser ER, Cascio W, Diaz‐Sanchez D, Devlin RB. Fine particulate matter and cardiovascular disease: comparison of assessment methods for long‐term exposure. Environ Res. 2017;159:16–23. [DOI] [PMC free article] [PubMed] [Google Scholar]
- 20. McClure CD, Jaffe DA. US particulate matter air quality improves except in wildfire‐prone areas. Proc Natl Acad Sci USA. 2018;115:7901–7906. [DOI] [PMC free article] [PubMed] [Google Scholar]
- 21. Wettstein ZS, Hoshiko S, Fahimi J, Harrison RJ, Cascio WE, Rappold AG. Cardiovascular and cerebrovascular emergency department visits associated with wildfire smoke exposure in California in 2015. J Am Heart Assoc. 2018;7:e007492 DOI: 10.1161/JAHA.117.007492. [DOI] [PMC free article] [PubMed] [Google Scholar]
- 22. Münzel T, Gori T, Keaney JJF, Maack C, Daiber A. Pathophysiological role of oxidative stress in systolic and diastolic heart failure and its therapeutic implications. Eur Heart J. 2015;36:2555–2564. [DOI] [PMC free article] [PubMed] [Google Scholar]
- 23. Riva DR, Magalhães CB, Lopes AA, Lanças T, Mauad T, Malm O, Valença SS, Saldiva PH, Faffe DS and Zin WA. Low dose of fine particulate matter (PM2.5) can induce acute oxidative stress, inflammation and pulmonary impairment in healthy mice. Inhalation Toxicol. 2011;23:257–267. [DOI] [PubMed] [Google Scholar]
- 24. Rui W, Guan L, Zhang F, Zhang W and Ding W. PM2.5‐induced oxidative stress increases adhesion molecules expression in human endothelial cells through the ERK/AKT/NF‐κB‐dependent pathway. J Appl Toxicol. 2016;36:48–59. [DOI] [PubMed] [Google Scholar]
- 25. Araujo JA, Barajas B, Kleinman M, Wang X, Bennett BJ, Gong KW, Navab M, Harkema J, Sioutas C, Lusis AJ, Nel AE. Ambient particulate pollutants in the ultrafine range promote early atherosclerosis and systemic oxidative stress. Circ Res. 2008;102:589–596. [DOI] [PMC free article] [PubMed] [Google Scholar]
- 26. Miller MR, Shaw CA, Langrish JP. From particles to patients: oxidative stress and the cardiovascular effects of air pollution. Future Cardiol. 2012;8:577–602. [DOI] [PubMed] [Google Scholar]
- 27. Goldberg MS, Giannetti N, Burnett RT, Mayo NE, Valois M‐F, Brophy JM. Shortness of breath at night and health status in congestive heart failure: effects of environmental conditions and health‐related and dietary factors. Environ Res. 2009;109:166–174. [DOI] [PubMed] [Google Scholar]
- 28. Chan SH, Hee VCV, Bergen S, Szpiro AA, DeRoo LA, London SJ, Marshall JD, Kaufman JD, Sandler DP. Long‐term air pollution exposure and blood pressure in the sister study. Environ Health Perspect. 2015;123:951–958. [DOI] [PMC free article] [PubMed] [Google Scholar]
- 29. Chuang K‐J, Yan Y‐H, Cheng T‐J. Effect of air pollution on blood pressure, blood lipids, and blood sugar: a population‐based approach. J Occup Environ Med. 2010;52:258–262. [DOI] [PubMed] [Google Scholar]
- 30. Fuks K, Moebus S, Hertel S, Viehmann A, Nonnemacher M, Dragano N, Möhlenkamp S, Jakobs H, Kessler C, Erbel R, Hoffmann B. Long‐term urban particulate air pollution, traffic noise, and arterial blood pressure. Environ Health Perspect. 2011;119:1706–1711. [DOI] [PMC free article] [PubMed] [Google Scholar]
- 31. Nichols GA, Gullion CM, Koro CE, Ephross SA, Brown JB. The incidence of congestive heart failure in type 2 diabetes: an update. Diabetes Care. 2004;27:1879–1884. [DOI] [PubMed] [Google Scholar]
- 32. Ward‐Caviness CK, Kraus WE, Blach C, Haynes CS, Dowdy E, Miranda ML, Devlin RB, Diaz‐Sanchez D, Cascio WE, Mukerjee S, Stallings C, Smith LA, Gregory SG, Shah SH, Hauser ER, Neas LM. Association of roadway proximity with fasting plasma glucose and metabolic risk factors for cardiovascular disease in a cross‐sectional study of cardiac catheterization patients. Environ Health Perspect. 2015;123:1007–1014. [DOI] [PMC free article] [PubMed] [Google Scholar]
- 33. Rajagopalan S, Brook RD. Air pollution and type 2 diabetes. Mechanistic Insights. 2012;61:3037–3045. [DOI] [PMC free article] [PubMed] [Google Scholar]
- 34. Krämer U, Herder C, Sugiri D, Strassburger K, Schikowski T, Ranft U, Rathmann W. Traffic‐related air pollution and incident type 2 diabetes: results from the SALIA Cohort study. Environ Health Perspect. 2010;118:1273–1279. [DOI] [PMC free article] [PubMed] [Google Scholar]
- 35. Bourdrel T, Bind M‐A, Béjot Y, Morel O, Argacha J‐F. Cardiovascular effects of air pollution. Arch Cardiovasc Dis. 2017;110:634–642. [DOI] [PMC free article] [PubMed] [Google Scholar]
- 36. Di Q, Wang Y, Zanobetti A, Wang Y, Koutrakis P, Choirat C, Dominici F, Schwartz JD. Air pollution and mortality in the Medicare population. N Engl J Med. 2017;376:2513–2522. [DOI] [PMC free article] [PubMed] [Google Scholar]
- 37. Di Q, Dai L, Wang Y, Zanobetti A, Choirat C, Schwartz JD, Dominici F. Association of short‐term exposure to air pollution with mortality in older adults. JAMA. 2017;318:2446–2456. DOI: 10.1001/jama.2017.17923. [DOI] [PMC free article] [PubMed] [Google Scholar]
Associated Data
This section collects any data citations, data availability statements, or supplementary materials included in this article.
Supplementary Materials
Data S1: Expanded Methods
Table S1: Associations Between All‐Cause Mortality and PM2.5
Table S2: Associations Between All‐Cause Mortality and PM2.5 Assessed Using Modeled PM2.5 Data at 1×1‐km Resolution
Table S3: Sensitivity Analyses Based on Visit and Age at End of Observation
Table S4: Clinical Covariates for Individuals With Diastolic and Systolic Heart Failure
Table S5: Associations Between All‐Cause Mortality and Binary PM2.5 Cutoff
Figure S1: PM2.5 annual average concentration in 2004 and 2016 using modeled estimates at 1×1‐km resolution.
Figure S2: PM2.5 concentration‐response curve generated using ground‐based PM2.5 monitoring network.