

Abstract
Background
Electronic medical records (EMRs) allow identification of disease‐specific patient populations, but varying electronic cohort definitions could result in different populations. We compared the characteristics of an electronic medical record–derived atrial fibrillation (AF) patient population using 5 different electronic cohort definitions.
Methods and Results
Adult patients with at least 1 AF billing code from January 1, 2010, to December 31, 2017, were included. Based on different electronic cohort definitions, we trained 5 different logistic regression models using a labeled training data set (n=786). Each model yielded a predicted probability; patients were classified as having AF if the probability was higher than a specified cut point. Test characteristics were calculated for each model. These models were then applied to the full cohort and resulting characteristics were compared. In the training set, the comprehensive model (including demographics, billing codes, and natural language processing results) performed best, with an area under the curve of 0.89, sensitivity of 0.90, and specificity of 0.87. Among a candidate population (n=22 000), the proportion of patients identified as having AF varied from 61% in the model using diagnosis or procedure International Classification of Diseases (ICD) billing codes to 83% in the model using natural language processing of clinical notes. Among identified AF patients, the proportion of patients with a CHA 2 DS 2‐VASc score ≥2 varied from 69% to 85%; oral anticoagulant treatment rates varied from 50% to 66% depending on the model.
Conclusions
Different electronic cohort definitions result in substantially different AF study samples. This difference threatens the quality and reproducibility of electronic medical record–based research and quality initiatives.
Keywords: atrial fibrillation, electronic health records, health services research, informatics, quality of care
Subject Categories: Quality and Outcomes, Health Services, Atrial Fibrillation
Clinical Perspective
What Is New?
We evaluated 5 different electronic definitions for identifying atrial fibrillation patients from the medical record.
The characteristics and outcomes of the population differ substantially between different definitions.
Of 22 000 possible patients, the number of included atrial fibrillation patients varied by up 6690 patients, and the apparent oral anticoagulant treatment rate in patients with CHA2DS2‐VASc ≥2 varied from half (49.6%) to two‐thirds (66.3%) of the population, depending on the electronic cohort definition.
What Are the Clinical Implications?
Quality improvement, learning healthcare systems, and real‐world evidence require electronic cohort definitions to identify disease‐specific patient populations.
Different definitions will result in different populations and different apparent outcome rates.
Validated, consistent electronic definitions are needed to ensure reproducibility and accuracy of studies that rely on electronic medical records.
Introduction
Electronic medical records (EMR) are increasingly prevalent, resulting in an explosion of electronic health data available for research and quality initiatives. These data allow healthcare systems to capture large patient populations in order to study diagnoses, treatments, and outcomes. Specifically, atrial fibrillation (AF) is a common condition, and large patient cohort studies may allow health systems and researchers to monitor quality and outcomes. Using the EMR, a health system could monitor the number of AF patients treated with an oral anticoagulant (OAC) for quality improvement efforts, such as increasing appropriate treatment rates among eligible patients. However, no common method exists to identify patients for inclusion in EMR‐based initiatives. Different approaches could result in different patient cohorts with respect to characteristics and apparent outcomes, and this would limit the potential of EMR‐based initiatives.
Prior studies used varying methods to identify AF patients.1, 2, 3, 4 Medicare studies, for example, include patients who have at least 1 inpatient or 2 outpatient International Classification of Diseases (ICD) codes for AF.2 Reports from Kaiser Permanente also include ECG results in the patient‐selection process.4 Other studies have included EMR data such as ablation codes or antiarrhythmic medication treatment, but these studies report only positive predictive value and include outcomes (eg, anticoagulation use) in the prediction model.3 Although data collected for billing purposes, including ICD codes, follow a controlled vocabulary, this approach may be inaccurate5, 6 and does not exploit other types of data, such as demographic information and non‐AF diagnoses.
As an alternative to structured data, clinical notes are an untapped resource for detailed clinical information. Notes often include narrative references to patient conditions, such as “Patient was diagnosed with afib last year.” Text mining with natural language processing (NLP) leverages the unstructured narrative from routine care and is another option for identifying patient cohorts. An advantage of NLP is that the clinical narrative may be less prone to some types of variation seen with billing codes,6, 7 which could support more precise patient selection and portability between institutions. The overall goal of this study was (1) to develop and train various models using different electronic‐cohort definitions to identify AF patients from the EMR, incorporating structured and unstructured data; (2) to compare the resulting patient samples and characteristics from each model; and (3) to compare apparent OAC treatment rates in each sample.
Methods
We developed and compared the performance of 5 cohort definitions to identify AF patients from the EMR:
Outpatient and inpatient ICD AF diagnosis billing codes (Medicare methodology)2: ≥1 inpatient billing code or ≥2 outpatient billing codes within 365 days
Outpatient AF diagnosis billing codes and ECG (Kaiser methodology)4: >1 outpatient diagnosis billing code, 1 outpatient diagnosis billing code and ECG consistent with AF
Demographics and ICD AF diagnosis billing codes: logistic regression model using patient demographics, presence of an inpatient AF diagnosis billing code, presence of an AF diagnosis billing code in the first position (primary), number of outpatient AF diagnoses billing codes, comorbid conditions and procedures from ICD codes, year‐of‐index‐AF diagnosis billing code
NLP: at least 1 nonnegated mention of AF in the clinical text (negated AF mentions use phrases such as “patient denies AF,” whereas nonnegated references use phrases such as “Holter monitor showed AF”)
Comprehensive: comprehensive logistic regression model combining patient demographics, presence of an inpatient AF diagnosis billing code, presence of a primary AF diagnosis billing code, number of outpatient AF diagnoses billing codes, comorbid conditions and procedures from ICD codes, year of index AF diagnosis billing code, at least 1 nonnegated mention of AF in clinical text, ECG with reference to AF, Current Procedural Terminology (CPT) codes for ablation or cardioversion
ICD‐9 codes were used through September, 2015 and ICD‐10 codes were used from October, 2015 onward.
Population and Reference Standard
We used data from the Enterprise Data Warehouse (EDW) from University of Utah Health for this study. Enterprise data warehouses are storage systems that integrate numerous data sources within an organization (eg, inpatient and outpatient facilities, radiology reporting, or laboratory result systems) into a central repository.8 Our health system uses an internally developed EDW (as opposed to a third‐party data warehousing solution). The candidate population included patients with at least 1 ICD‐9 or ICD‐10 code for AF between 2010 and 2017 (427.31, I48.0, I48.1, I48.2, I48.9, I48.91), and without an AF diagnosis from January 1, 2007, to December 31, 2009. For model development and training, 786 patients were randomly selected from the candidate population. Chart review by a team of 5 clinicians was used to classify each patient as AF present or AF absent, which served as the reference standard. This reference standard served as the outcome for all 5 models. Each patient was classified as having AF (1) if AF was referenced in a problem list or past medical history, (2) if AF was documented but appeared only as a transient event, as part of other acute conditions (eg, cardiac surgery or sepsis), or (3) if clinic notes described active AF management. Examples of active management include procedures or medications (eg, cardioversion, anticoagulation), outside records or procedures, or listing in the assessment and plan. Otherwise, the patient was classified as not having AF. At least 2 clinicians reviewed each patient. In case of disagreement, a third reviewer adjudicated the classification. If uncertainty was still present, the team discussed the case to arrive at consensus.
Feature Specification
The feature specifications for the different models are provided in Table S1. Model features included demographics, comorbid conditions, procedures, ECG findings, and text‐derived features. Each of the 5 models included some combination of these features, and all features were extracted from structured data fields in the EDW (except for the text‐derived features). Table S1 specifies which features were included in which models. Briefly, demographic features included age, sex, race, Hispanic ethnicity, and primary insurance at the time of the index AF diagnosis. Comorbid conditions and procedures were identified based on the presence of an ICD diagnostic or procedure billing code any time during the study period. Codes were grouped into clinically meaningful groups according to the Clinical Classification Software (CCS) for the US Agency for Healthcare Research and Quality.9 We used CPT codes to identify patients who had cardioversions (92960) or ablations (93651, 93655, 93656, 93657) at any time during the study period. For ECGs, we used the text interpretations and a simple regular‐expression matching approach. If “atrial fibrillation,” “afib,” or “a fib” were present, the ECG was classified as positive.
Model Training
In the 786‐patient training set, we trained 5 different logistic regression models using the definitions predict the presence of AF. The models yielded predicted probabilities of AF for each training case, and the optimal cut point for each model was identified using Liu's10 method, which maximizes the product of the sensitivity and specificity. In other words, each model had its own cut point. If the predicted probability was higher than the cut point, the case was classified as AF present. Accuracy, sensitivity, specificity, positive predictive value, and negative predictive value were calculated for each model, compared with the reference standard. Accuracy was defined as the number of correctly classified patients over the total number of patients. We generated and compared the area under the receiver operating characteristic curve for each model to the reference standard using Stata's “roccomp” command.
We used a rules‐based NLP approach based on the pyConText algorithm, a freely available Python software package.11, 12, 13 Using the training data and clinical expertise, we identified AF‐specific target terms and relevant modifiers that allow classification of each AF mention as present or absent (Table S2).14 For each patient, each note was analyzed for AF‐specific mentions, and each mention was classified as AF present or absent based on the modifiers surrounding the AF target term. If 1 nonnegated mention was present in any note (eg, “Patient has had long standing AF for the past 10 years”), that patient was classified as AF present. In addition, we created a summary variable for each patient, counting the total number of times an AF‐specific target term appeared in the notes, regardless of negation.
Application to Full Candidate Population
The candidate population included patients with at least 1 ICD billing diagnosis code for AF, seen between 2010 and 2017, excluding those with an AF diagnosis code going back to 2007. In other words, patients with an AF billing code in 2008 and again in 2011 would be excluded. Model training resulted in coefficients for each term in the models, which were then applied to the full candidate population. Patients with a predicted probability of AF higher than the cut point specified during training were classified as having AF. We evaluated the number of patients identified as AF per model and the apparent OAC treatment rates according to model. Patients were classified as treated with an OAC if they had an order for an OAC, including warfarin, dabigatran, apixaban, rivaroxaban, and edoxaban, in the EMR. The OAC treatment rate was calculated for patients with a CHA2DS2‐VASc score ≥2.15, 16 The CHA2DS2‐VASc score is automatically calculated in our EDW using all available prior diagnosis codes as well as ejection fraction from echocardiogram for classifying heart failure (R.U.S., unpublished data, 2019).
To compare patient characteristics between the different models, we created regression models with each characteristic as the outcome and each model as the predictor variables. In addition, we added a predictor variable that indicates whether all models agreed on whether a patient was included in the final cohort. In other words, the indicator variable equals 1 if all 5 models resulted in patients being included or excluded from the AF cohort. When the indicator variable was 1, all other predictors were reassigned to 0. Therefore, the indicator variable serves as a reference variable, or dummy variable. The likelihood ratio test was used to compare this model with a nested reduced model limited to the y‐intercept. Thus, a significant P value with the likelihood ratio test indicates that at least 1 model differed in terms of inclusion of patients with a given outcome (eg, characteristic, in this case).
This study was approved by the institutional review board at the University of Utah, with a waiver of consent for patient participation. Data set cleaning and analyses were completed using Stata v14.2, and the NLP was executed using Python. The Stata output for the model training is included in Table S3, along with the cut points and regression coefficients. The data that support the findings of this study are available from the corresponding author upon reasonable request. To protect patient information, sharing will be limited to Python scripts, in most cases.
Results
A total of 786 patients were included in the training set, with an AF prevalence of 80.4% per our reference standard. The mean age of the training population was 67.5 years (SD: 15.3), and 42.0% of participants were female. Comorbid conditions varied between patients with and without AF, including higher rates of coronary artery disease, congestive heart failure, thyroid disease, and cancer among AF patients. Aside from cardioversion, cardiac procedures did not differ significantly between patients with and without AF (Table 1).
Table 1.
Characteristics of the Model Training Population (n=786), According to the Presence or Absence of AF
| Characteristic | AF Present (n=632) | AF Absent (n=154) | P Value |
|---|---|---|---|
| Age, y, mean (SD) | 69.0 (14.2) | 61.3 (17.9) | <0.01 |
| Female sex | 249 (39.4) | 81 (52.6) | <0.01 |
| White race | 563 (89.1) | 132 (85.7) | 0.24 |
| Medicare insured | 411 (65.0) | 81 (52.6) | <0.01 |
| No. of outpatient AF diagnoses, mean (SD) | 10.1 (21.6) | 1.2 (1.7) | <0.01 |
| Primary AF diagnosisa | 404 (63.9) | 99 (64.3) | 0.93 |
| Comorbid conditionsb | |||
| Acute myocardial infarction | 80 (12.7) | 13 (8.4) | 0.15 |
| Coronary artery disease | 302 (47.8) | 53 (34.4) | <0.01 |
| Valvular heart disease | 216 (34.3) | 47 (30.5) | 0.39 |
| Congestive heart failure | 222 (35.1) | 32 (20.8) | <0.01 |
| Cerebrovascular disease | 156 (24.7) | 60 (39.0) | <0.01 |
| Dementia | 183 (29.0) | 39 (25.3) | 0.37 |
| Liver disease | 132 (20.9) | 36 (23.4) | 0.50 |
| Diabetes mellitus | 289 (45.7) | 62 (40.3) | 0.22 |
| Acute renal failure | 161 (25.5) | 25 (16.2) | 0.02 |
| Chronic kidney disease | 165 (26.1) | 19 (12.3) | <0.01 |
| Pulmonary heart disease | 158 (25.0) | 25 (16.2) | 0.02 |
| Hypertension | 465 (73.6) | 103 (66.9) | 0.10 |
| Thyroid disease | 190 (30.1) | 29 (18.8) | <0.01 |
| Anemia | 219 (34.7) | 36 (23.4) | <0.01 |
| Cancer | 235 (37.2) | 33 (21.4) | <0.01 |
| Procedures, ICD codes | |||
| Heart valve surgery | 27 (4.3) | 5 (3.3) | 0.56 |
| Coronary artery bypass grafting | 21 (3.3) | 4 (2.6) | 0.65 |
| Percutaneous coronary intervention | 17 (2.7) | 3 (1.8) | 0.60 |
| Angioplasty | 56 (8.9) | 8 (5.2) | 0.14 |
| Pacemaker/defibrillator | 23 (3.6) | 5 (3.3) | 0.81 |
| Cardioversion | 65 (10.3) | 2 (1.3) | <0.01 |
| Procedures, CPT codes | |||
| Ablation | 19 (3.0) | 2 (1.3) | 0.24 |
| Cardioversion | 234 (37.0) | 7 (4.6) | <0.01 |
| Natural language processing | |||
| At least 1 nonnegated mention | 614 (97.2) | 57 (37.0) | <0.01 |
| No. of AF mentionsc | |||
| None | 16 (2.5) | 76 (49.3) | <0.01 |
| First quartile | 123 (19.5) | 57 (37.0) | |
| Second quartile | 159 (25.2) | 15 (9.7) | |
| Third quartile | 162 (25.6) | 6 (3.9) | |
| Fourth quartile | 172 (27.2) | 0 (0) | |
| ECG with reference to AF | 234 (37.0) | 7 (4.6) | <0.01 |
Values are shown as n (%), unless otherwise specified. AF indicates atrial fibrillation; CPT, Current Procedural Terminology; ICD, International Classification of Diseases.
Primary diagnosis refers to position 1 in the order of the billed codes.
Comorbid conditions were identified from ICD billing codes present in the patient medical record.
Refers to the number of times a target term for AF was present in the clinical notes. The ranges are as follows: none, no mentions; first, 1–6; second, 7–19; third, 20–46; fourth, 48–670.
The test characteristics for the training models are seen in Figures 1 and 2. Compared with the reference standard, accuracy, sensitivity, and negative predictive value were highest using the NLP model, whereas specificity and positive predictive value were highest using the comprehensive model. Figure 1 shows the receiver operating characteristic curves for each model compared with the reference standard. The areas under the receiver operating characteristic curve were highest for the comprehensive and NLP models, at 0.887 and 0.801, respectively (P<0.01). The ICD and NLP models did not differ significantly regarding discrimination (area under the receiver operating characteristic curve: 0.801 versus 0.798, respectively; P=0.91); the ICD model had higher specificity at the cost of lower sensitivity. The previously published models using AF‐specific diagnosis codes and ECGs resulted in high false‐negative rates (Figure 2).
Figure 1.
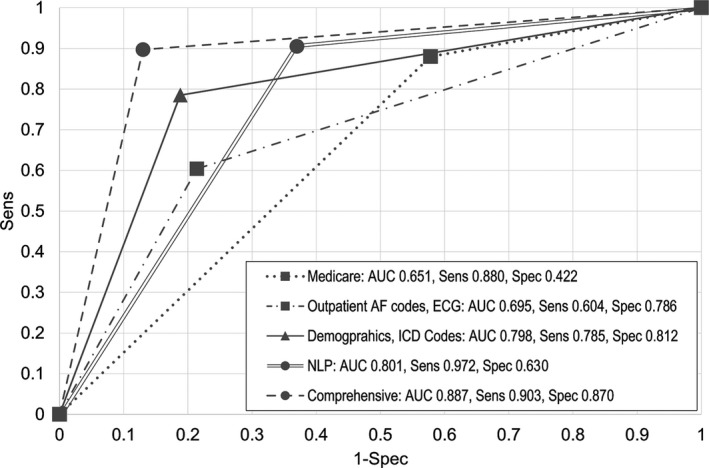
Receiver operating characteristic curves for different models to identify atrial fibrillation patients using the electronic medical record. In the training set (n=786), the AUC was highest for the comprehensive model and lowest for the Medicare model. AUC indicates area under the receiver operating characteristic curve; ICD, International Classification of Diseases; NLP, natural language processing; Sens, sensitivity; Spec, specificity.
Figure 2.
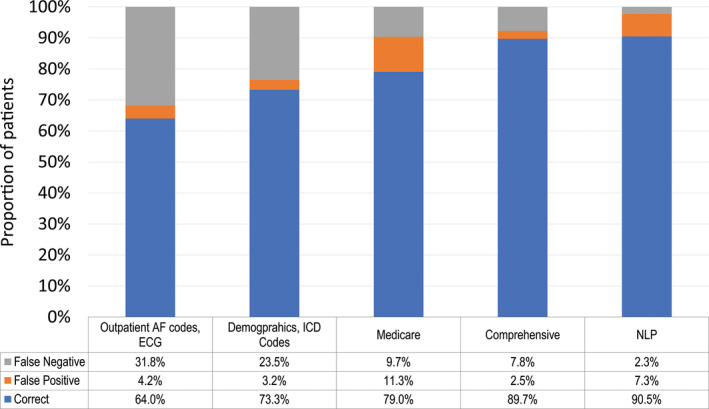
Proportion of correct, false‐positive, and false‐negative classifications for each model in the training set. In the training set (n=786), the NLP model resulted in the highest number of correctly classified patients, at the expense of a high false‐positive rate. The outpatient billing codes and ECG method had the lowest number of correctly classified patients and the highest number of false negatives. AF indicates atrial fibrillation; ICD, International Classification of Diseases; NLP, natural language processing.
The full candidate population included 22 000 patients, with a mean age of 67.1 years (SD: 15.1); 42.3% were female. The number of patients, patient characteristics, and OAC treatment rates varied substantially when the models were applied to the candidate population (Table 2, Figure 3). The number of patients who could be included in an AF sample varied by up to 6690 patients. The model using outpatient AF codes and ECG resulted in the smallest AF sample, including 11 512 patients, or 52.3% of the candidate population. Comparatively, the NLP model resulted in the largest AF sample, including 18 202 patients, or 82.7% of the candidate population. The mean age of patients identified as AF was lowest using the outpatient AF/ECG model (68.1 years) and highest using the demographics/ICD codes model (70.1 years), with additional variation in comorbid conditions (Table 2). Finally, the proportion of AF patients with a CHA2DS2‐VASc score ≥2 ranged from 78.5% to 85.3%. The OAC treatment rates for patients with a score ≥2 also varied, from 49.6% in the NLP model to 66.3% in the outpatient AF/ECG model.
Table 2.
Population Characteristics Based on the Patient‐Selection Model
| Selected Characteristics | Medicare | Outpatient AF Codes, ECG | Demographics, ICD Codes | NLP | Comprehensive | P Value |
|---|---|---|---|---|---|---|
| Proportion identified as AF, % | 18 030 (82.0) | 11 512 (52.3) | 13 427 (61.0) | 18 202 (82.7) | 15 962 (72.6) | <0.01 |
| Age, y, mean (SD) | 67.8 (14.3) | 68.1 (14.1) | 70.8 (12.4) | 68.7 (13.8) | 69.8 (13.1) | <0.01 |
| Female sex | 7434 (41.2) | 4846 (42.1) | 5113 (38.1) | 7538 (41.4) | 6528 (40.9) | <0.01 |
| White race | 15 707 (87.2) | 10 143 (88.1) | 11 980 (89.2) | 15 957 (87.7) | 14 110 (88.4) | <0.01 |
| Medicare | 11 092 (61.5) | 7116 (61.8) | 8874 (66.1) | 11 481 (63.1) | 10 389 (65.1) | <0.01 |
| CHA2DS2‐VASc ≥2 | 14 920 (82.8) | 9156 (79.5) | 11 450 (85.3) | 15 110 (83.0) | 13 286 (83.2) | <0.01 |
| OAC prescribeda | 7838 (52.5) | 6074 (66.3) | 6572 (57.4) | 7502 (49.6) | 8127 (61.2) | <0.01 |
| Comorbid conditions | ||||||
| Acute myocardial infarction | 2690 (14.9) | 1493 (13.0) | 2198 (16.4) | 2567 (14.2) | 2356 (14.8) | <0.01 |
| Coronary artery disease | 8463 (46.9) | 5365 (46.6) | 6809 (50.7) | 8431 (46.3) | 7496 (47.0) | <0.01 |
| Valvular heart disease | 6801 (37.7) | 4001 (34.7) | 5024 (37.4) | 6604 (36.3) | 5665 (35.5) | <0.01 |
| Congestive heart failure | 6859 (38.0) | 4352 (37.8) | 5766 (42.9) | 3828 (37.5) | 6173 (38.7) | <0.01 |
| Cerebrovascular disease | 5914 (32.8) | 3077 (26.7) | 3132 (23.3) | 5506 (30.3) | 4265 (27.7) | <0.01 |
| Dementia | 2488 (13.8) | 1340 (11.6) | 1776 (13.2) | 2386 (13.1) | 2092 (13.1) | <0.01 |
| Diabetes mellitus | 8283 (45.9) | 4779 (41.5) | 6219 (46.3) | 8106 (44.5) | 7080 (44.4) | <0.01 |
| Chronic kidney disease | 4487 (24.9) | 2610 (26.7) | 4082 (30.4) | 4504 (24.7) | 4306 (27.0) | <0.01 |
| Hypertension | 14 109 (78.3) | 8729 (75.8) | 10 797 (80.4) | 14 068 (77.3) | 12 261 (76.8) | <0.01 |
| Cancer | 6116 (33.9) | 3886 (33.8) | 5387 (40.1) | 6257 (34.4) | 5631 (35.3) | <0.01 |
| Procedures | ||||||
| Heart valve surgery | 867 (4.8) | 502 (4.4) | 627 (4.7) | 844 (4.6) | 672 (4.2) | <0.01 |
| Coronary artery bypass grafting | 644 (3.6) | 325 (2.8) | 457 (3.4) | 615 (3.4) | 583 (3.7) | <0.01 |
| Percutaneous coronary intervention | 608 (3.4) | 333 (2.9) | 553 (4.1) | 558 (3.1) | 481 (3.0) | <0.01 |
| Pacemaker/defibrillator | 812 (4.5) | 563 (4.9) | 582 (4.3) | 783 (4.3) | 706 (4.4) | <0.01 |
Values shown as n (%), unless otherwise specified. AF indicates atrial fibrillation; ICD, International Classification of Diseases; NLP, natural language processing; OAC, oral anticoagulant.
Including only patients with CHA2DS2‐VASc ≥2.
Figure 3.
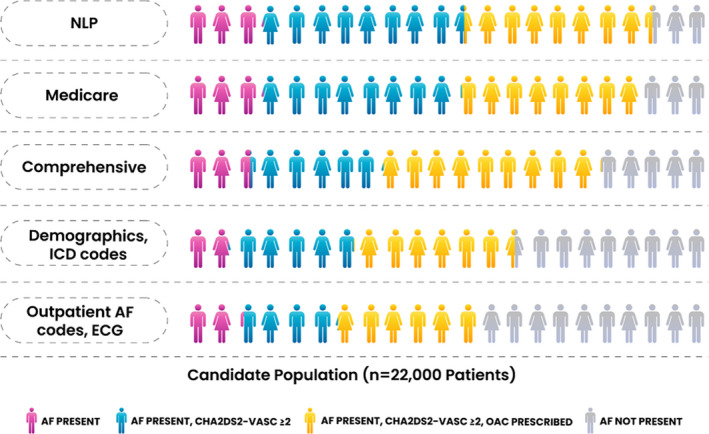
Proportion of patients included with CHA2DS2‐VASc score ≥2 and treated with an OAC for each model. When applied to the candidate population, different patient‐selection models resulted in populations with different sizes, stroke risks, and OAC treatment rates. The corresponding values are found in Table 2. “Outpatient AF codes, ECG” refers to the method used in prior publications from Kaiser Permanente. AF indicates atrial fibrillation; ICD, International Classification of Diseases; NLP, natural language processing; OAC, oral anticoagulant.
Discussion
Accurate identification of patient populations is critical for effective quality‐improvement efforts. The EMR provides important opportunities to identify patient populations, but standard, electronic cohort definitions do not exist. We found that the number of AF patients included in a cohort varies by an absolute range of up to 30%, depending on which electronic cohort definition is used. In large health systems, this translates into cohorts that differ by thousands of patients. In addition, quality measures such as OAC treatment rates varied by 16.7%, between 49.6% and 66.3%, depending on the cohort definition. These findings have important implications for quality‐improvement initiatives, research endeavors, and case‐mix analyses.
From a quality perspective, health systems use EMR‐based tools to characterize patient populations and find opportunities for improvement.17 In addition, OAC treatment rate in AF is a quality measure in the federal government's Merit‐Based Incentive Payment System (MIPS)18; accurate estimation of the denominator—the number of patients with AF, in this case—is critical to its success. The AF quality measure for MIPS relies on AF billing codes and outpatient CPT codes for evaluation and management.18 Based on our findings, this type of cohort selection could result in underestimating the true AF population; some electronic cohort definitions are biased and can omit a substantial number of patients, affecting the impact of the quality measure. Less sensitive AF cohort definitions would omit a large proportion of patients from any assessment of the quality of their care or related interventions. Conversely, false positives are also problematic for quality reporting because patients who do not truly have AF are unlikely to receive (or benefit from) guideline‐recommended treatment.
Just as clinical trials and disease registries have specific inclusion and exclusion criteria, the same is needed for EMR‐based research and initiatives. Trials and registries use “human‐readable” definitions; for example, persistent AF is defined as “sustained for ≥7 days.”19 These definitions should have corresponding “machine‐readable” definitions to increase uniformity and reproducibility in EMR‐based initiatives. The challenge is creating machine‐readable definitions that are portable across institutions. In this study, for example, the outpatient AF/ECG model had suboptimal performance, whereas it may perform well in the system for which it was designed. We showed it cannot easily be applied to a system in which patients receive fragmented care from different institutions using different EMRs.
Furthermore, many administrative data sets and definitions are used to calculate observed‐to‐expected event ratios in efforts to understand quality of care (and, on occasion, payment, scoring, etc). Underlying these calculations is a case mix, to account for severity of illness, on which to base expected outcomes. Once again, such case‐mix analyses could vary dramatically with the definition of the underlying disease‐based cohort, leading to wide variability in expected outcomes, observed outcomes, and downstream effects. With more precise, portable, cohort‐definition methods, precision and utility of such analyses could improve dramatically.
NLP may have some advantages over billing data models because the clinical narrative may be less prone to certain types of variation, given that there are relatively few ways that clinicians state that a patient has AF. However, we were limited by low specificity with our rules‐based approach. Machine learning, as opposed to rules‐based approaches, can also be used for NLP but often requires large sets of labeled training data. Our future efforts will focus on improving NLP specificity by using the comprehensive model to automatically label patients and create a large training set for a machine learning approach. Still, whatever methods result in the ideal performing model (text or structured data, eg, ICD codes), we will need to ensure that the model is calibrated and portable. Efforts are underway using common data models such as the Observational Medical Outcomes Partnership (OMOP) common data model,20 but standardization of the data that go into the common data model must also be a part of the process. For example, 2 different NLP systems can extract AF patients and map the concept to OMOP, but the systems are different; the common data model alone does not solve the portability issue. In the future, if EMRs become more similar, an option is for guidelines and regulations to include validated algorithms along with recommendations.
Limitations
We used diverse approaches to patient electronic cohort definitions in this study, and this is only 1 factor that can skew outcome results. CHA2DS2‐VASc score calculations and OAC treatment classification methods can also vary and yield different apparent treatment rates. In addition, we used only a small fraction of the variables available in the EMR. We chose features based on widespread availability (eg, demographics) and controlled vocabularies (eg, ICD and CPT) for this demonstration project. Additional features, such as ejection fraction, have varying capture and format across institutions; adding features and increasing model complexity could decrease bias but would probably increase model overfitting and result in site‐specific, nonportable models. Our candidate population, including patients with at least 1 AF billing code, was enriched with a high prevalence of “AF present” patients. Generation of models that accurately identify low‐prevalence conditions, such as AF patients in an entire health system, is limited by challenges in creating a reference standard; manual chart review to identify 1% of the population is cumbersome, if not impossible. Our reference standard definition of AF was broad, and the results would differ with narrower definitions. From this larger group, health systems could apply criteria to select patient subsets, such as patients who have at least 2 outpatient encounters, a designated primary care physician within the health system, or a first AF encounter during admission for cardiac surgery. Finally, both billing codes and text‐based terms vary between institutions. We did not include internal and external validation populations for each model because the purpose of this study was not to identify the optimal model to select AF patients but rather to compare population characteristics and outcomes from different approaches.
Conclusions
EMRs provide an opportunity to identify large patient cohorts for research and quality initiatives. Cohort selection is a critical step to realizing the potential of EMRs for quality improvement and research and a prerequisite to developing learning healthcare systems. Cohort definitions should be based on validated portable definitions to maximize comparability. In the case of AF, number of patients, characteristics, and outcomes vary depending on the patient‐selection method. To optimize the impact of EMR‐driven research and quality improvement, we need an unbiased, portable approach to identify patient populations. Combining multiple types of data from EMRs may serve this goal. Nevertheless, regardless of the data sources—structured data like ICD codes or unstructured data like text—we will ultimately require a common AF definition for use in research and quality improvement.
Sources of Funding
This work and R.U.S. are supported by a grant from the National Heart, Lung, and Blood Institute of the National Institutes of Health (K08HL136850). B.A.S. is supported by the National Heart, Lung, and Blood Institute of the National Institutes of Health (K23HL143156).
Disclosures
B.A.S. receives research support from Boston Scientific and Janssen; provides consulting to Janssen, Bayer, and Merit Medical; and speaks for North American Center for Continuing Medical Education (funded by Sanofi). The remaining authors have no disclosures to report.
Supporting information
Table S1. Model Specifications
Table S2. Target Terms Used in the Natural Language Processing Task to Identify Patients With Atrial Fibrillation From Clinical Notes
Table S3. Training Model Regression Results
(J Am Heart Assoc. 2020;9:e014527 DOI: 10.1161/JAHA.119.014527.)
References
- 1. Jensen PN, Johnson K, Floyd J, Heckbert SR, Carnahan R, Dublin S. A systematic review of validated methods for identifying atrial fibrillation using administrative data. Pharmacoepidemiol Drug Saf. 2012;21(suppl 1):141–147. [DOI] [PMC free article] [PubMed] [Google Scholar]
- 2. Piccini JP, Hammill BG, Sinner MF, Jensen PN, Hernandez AF, Heckbert SR, Benjamin EJ, Curtis LH. Incidence and prevalence of atrial fibrillation and associated mortality among Medicare beneficiaries, 1993–2007. Circ Cardiovasc Qual Outcomes. 2012;5:85–93. [DOI] [PMC free article] [PubMed] [Google Scholar]
- 3. Khurshid S, Keaney J, Ellinor PT, Lubitz SA. A simple and portable algorithm for identifying atrial fibrillation in the electronic medical record. Am J Cardiol. 2016;117:221–225. [DOI] [PMC free article] [PubMed] [Google Scholar]
- 4. Go AS, Hylek EM, Borowsky LH, Phillips KA, Selby JV, Singer DE. Warfarin use among ambulatory patients with nonvalvular atrial fibrillation: the anticoagulation and risk factors in atrial fibrillation (ATRIA) study. Ann Intern Med. 1999;131:927. [DOI] [PubMed] [Google Scholar]
- 5. Molnar AO, van Walraven C, McArthur E, Fergusson D, Garg AX, Knoll G. Validation of administrative database codes for acute kidney injury in kidney transplant recipients. Can J Kidney Health Dis. 2016;3:1–10. [DOI] [PMC free article] [PubMed] [Google Scholar]
- 6. McCarthy C, Murphy S, Cohen JA, Rehman S, Jones‐O'Connor M, Olshan DS, Singh A, Vaduganathan M, Januzzi JL Jr, Wasfy JH. Misclassification of myocardial injury as myocardial infarction: implications for assessing outcomes in value‐based programs. JAMA Cardiol. 2019;4:460–464. [DOI] [PMC free article] [PubMed] [Google Scholar]
- 7. Chang TE, Lichtman JH, Goldstein LB, George MG. Accuracy of ICD‐9‐CM codes by hospital characteristics and stroke severity: paul coverdell national acute stroke program. J Am Heart Assoc. 2016;5:e003056 DOI: 10.1161/JAHA.115.003056. [DOI] [PMC free article] [PubMed] [Google Scholar]
- 8. Evans RS, Lloyd JF, Pierce LA. Clinical use of an enterprise data warehouse. AMIA Annu Symp Proc. 2012;2012:189–198. [PMC free article] [PubMed] [Google Scholar]
- 9. HCUP‐US Tools & Software Page [Internet]. Available at: https://www.hcup-us.ahrq.gov/toolssoftware/ccs/ccs.jsp. November 5, 2018.
- 10. Liu X. Classification accuracy and cut point selection. Stat Med. 2012;31:2676–2686. [DOI] [PubMed] [Google Scholar]
- 11. Harkema H, Dowling JN, Thornblade T, Chapman WW. ConText: an algorithm for determining negation, experiencer, and temporal status from clinical reports. J Biomed Inform. 2009;42:839–851. [DOI] [PMC free article] [PubMed] [Google Scholar]
- 12. Chapman BE, Lee S, Kang HP, Chapman WW. Document‐level classification of CT pulmonary angiography reports based on an extension of the ConText algorithm. J Biomed Inform. 2011;44:728–737. [DOI] [PMC free article] [PubMed] [Google Scholar]
- 13. pyConTextNLP [Internet]. PyPI. Available at: https://pypi.org/project/pyConTextNLP/. 2019 Apr 10 April, 2019.
- 14. Taggart M, Chapman WW, Steinberg BA, Ruckel S, Pregenzer‐Wenzler A, Du Y, Ferraro J, Bucher BT, Lloyd‐Jones DM, Rondina MT, Shah RU. Comparison of 2 natural language processing methods for identification of bleeding among critically Ill patients. JAMA Netw Open. 2018;1:e183451. [DOI] [PMC free article] [PubMed] [Google Scholar]
- 15. Lip GYH, Nieuwlaat R, Pisters R, Lane DA, Crijns HJGM. Refining clinical risk stratification for predicting stroke and thromboembolism in atrial fibrillation using a novel risk factor‐based approach: the euro heart survey on atrial fibrillation. Chest. 2010;137:263–272. [DOI] [PubMed] [Google Scholar]
- 16. January CT, Wann LS, Alpert JS, Calkins H, Cigarroa JE, Cleveland JC, Conti JB, Ellinor PT, Ezekowitz MD, Field ME, Murray KT, Sacco RL, Stevenson WG, Tchou PJ, Tracy CM, Yancy CW. 2014 AHA/ACC/HRS guideline for the management of patients with atrial fibrillation: a report of the American College of Cardiology/American Heart Association task force on practice guidelines and the heart rhythm society. Circulation. 2014;130:e199–e267. [DOI] [PMC free article] [PubMed] [Google Scholar]
- 17. Campanella P, Lovato E, Marone C, Fallacara L, Mancuso A, Ricciardi W, Specchia ML. The impact of electronic health records on healthcare quality a systematic review and meta‐analysis. Eur J Public Health. 2016;26:60–64. [DOI] [PubMed] [Google Scholar]
- 18. Quality ID #326 (NQF 1525): atrial fibrillation and atrial flutter: chronic anticoagulation therapy—national quality strategy domain: effective clinical care – meaningful measure area: management of chronic condition. Available from: https://qpp.cms.gov/docs/QPP_quality_measure_specifications/Claims-Registry-Measures/2019_Measure_326_MedicarePartBClaims.pdf. Accessed August 16, 2019.
- 19. Packer DL, Mark DB, Robb RA, Monahan KH, Bahnson TD, Moretz K, Poole JE, Mascette A, Rosenberg Y, Jeffries N, Al‐Khalidi HR, Lee KL; CABANA Investigators . Catheter ablation versus antiarrhythmic drug therapy for atrial fibrillation (CABANA) trial: study rationale and design. Am Heart J. 2018;199:192–199. [DOI] [PMC free article] [PubMed] [Google Scholar]
- 20. OMOP Common Data Model—OHDSI [Internet]. Available at: https://www.ohdsi.org/data-standardization/the-common-data-model/. Accessed 7 October, 2019.
Associated Data
This section collects any data citations, data availability statements, or supplementary materials included in this article.
Supplementary Materials
Table S1. Model Specifications
Table S2. Target Terms Used in the Natural Language Processing Task to Identify Patients With Atrial Fibrillation From Clinical Notes
Table S3. Training Model Regression Results