

Abstract
Background
Noninvasive cardiac tests, including exercise treadmill tests (ETTs), are commonly utilized in the evaluation of patients in the emergency department with suspected acute coronary syndrome. However, there are ongoing debates on their clinical utility and cost‐effectiveness. It is important to be able to use ETT results for research, but manual review is prohibitively time‐consuming for large studies. We developed and validated an automated method to interpret ETT results from electronic health records. To demonstrate the algorithm's utility, we tested the associations between ETT results with 30‐day patient outcomes in a large population.
Methods and Results
A retrospective analysis of adult emergency department encounters resulting in an ETT within 30 days was performed. A set of randomly selected reports were double‐blind reviewed by 2 physicians to validate a natural language processing algorithm designed to categorize ETT results into normal, ischemic, nondiagnostic, and equivocal categories. Natural language processing then searched and categorized results of 5214 ETT reports. The natural language processing algorithm achieved 96.4% sensitivity and 94.8% specificity in identifying normal versus all other categories. The rates of 30‐day death or acute myocardial infarction varied (P<0.001) by categories for normal (0.08%), ischemic (1.9%), nondiagnostic (0.77%), and equivocal (0.58%) groups achieving good discrimination (C‐statistic, 0.81; 95% CI, 0.7–0.92).
Conclusions
Natural language processing is an accurate and efficient strategy to facilitate large‐scale outcome studies of noninvasive cardiac tests. We found that most patients are at low risk and have normal ETT results, while those with abnormal, nondiagnostic, or equivocal results have slightly higher risks and warrant future investigation.
Keywords: cardiac event, chest pain, emergency department, natural language processing, noninvasive test, treadmill test
Subject Categories: Exercise Testing, Ischemia, Prognosis, Quality and Outcomes, Information Technology
Clinical Perspective
What Is New?
Exercise treadmill test (ETT) reports have a rich set of information with diagnostic and prognosis value but are challenging to use because of their unstructured format.
Natural language processing provides an efficient way to identify and extract ETT variables from ETT reports.
The majority of patients in the emergency department who underwent ETT had normal results and were at low risk, and patients with inconclusive ETT results (equivocal and nondiagnostic) were significantly different.
What Are the Clinical Implications?
This study demonstrates that ETT shows good prediction on near‐term cardiac outcomes.
ETT may offer a better value proposition as a prognostic tool compared with a diagnostic tool.
Instead of treating equivocal and nondiagnostic as inconclusive ETT tests, as is commonly done in current clinical practice, these patients may warrant different treatment pathways.
Introduction
Noninvasive cardiac tests, including exercise treadmill tests (ETTs), are recommended in the evaluation of patients with suspected acute coronary syndrome.1, 2 However, the benefits of routine use of noninvasive cardiac tests remains unclear as there is no evidence for reduction in death or acute myocardial infarction (AMI).3, 4, 5 Because of the costs and risks associated with noninvasive test strategies,6, 7 there is a strong need for comparative effectiveness studies to assess the value of ETT in acute care settings.3, 4
An essential technical barrier to such studies is the need to extract clinical information from ETT text reports. Because of low event rates and confounding factors in observational data, an adequately powered study would require clinical data from vast numbers of ETTs.8 With ≈1 million ETTs performed since 2000 in our regional health system alone, there is tremendous interest in using the information documented in these test reports for research. However, clinical ETT data are typically in a free‐text format. Studies have required manual review of noninvasive test results, which is time‐consuming and expensive. An automated method that can extract information documented in the unstructured testing reports would greatly facilitate studies that require data from large numbers of ETT reports.
With the widespread use of electronic health record (EHR) systems, clinical notes are electronically available. Natural language processing (NLP) is a computer‐based method that has been utilized to identify and extract information from clinical notes. When compared with manual chart review of medical records, NLP is more efficient and produces more consistent results.9, 10 Our team has previously developed NLP algorithms for cardiovascular variables, such as extraction of ejection fraction from echocardiography reports.11, 12, 13 The goals of this study were to: (1) derive and validate an algorithm to identify ETT results from unstructured reports, and (2) demonstrate the algorithm's utility by correlating ETT results with 30‐day patient outcomes in a large population.
Methods
The data, analytic methods, and study materials will not be made available to other researchers for purposes of reproducing the results or replicating the procedure.
Study Setting
This retrospective cohort study was conducted at Kaiser Permanente Southern California (KPSC), an integrated healthcare organization with over 7600 physicians, 15 medical centers, and 231 medical offices. KPSC provides prepaid comprehensive health care to 4.6 million racially and socioeconomically diverse members. Members receive medical care in KPSC‐owned facilities and contracting facilities. All KPSC emergency department (ED) sites use the same troponin laboratory assay (Beckman Coulter Access AccuTnI+3) with an AMI threshold level of 0.5 ng/mL, and ED physicians can order noninvasive cardiac testing as part of the discharge and follow‐up plan of patients with suspected acute coronary syndrome.
Study Population
We included all KPSC members 18 years or older with an ED visit between January 1, 2015, to September 19, 2017, and who had a troponin laboratory test and underwent an ETT within 30 days of their ED visits. We excluded patients who were transferred from a non‐KPSC hospital or died during ED visits. We excluded patients without KPSC health plan membership during the 12 months before and 30 days after ED visits because accurate comorbidities and patient outcomes are not available for nonmembers. Noninvasive cardiac tests were identified by Current Procedural Terminology codes (Data S1).
Patient demographic information such as age, sex, and race were obtained from administrative records. HEART (history, ECG, age, risk factors, and troponin) is a risk score used to inform clinical decision making14 and KPSC implemented the HEART score into routine ED care in May 2016.15 Therefore, HEART scores calculated at the time of the index ED visit were captured in the EHR when available, as well as other variables such as smoking history. As in previous reports, International Classification of Diseases, Ninth and Tenth Revision (ICD‐9 and ICD‐10) codes in the structured EHR data were used to define coronary artery disease, diabetes mellitus, dyslipidemia, hypertension, stroke, and the Elixhauser comorbidity index.16, 17
Training and Validation Data Sets
Based on the sample size calculation,18 using a prevalence rate of non‐normal findings among ETT of 32% (32%,19 36%,20 and 39%21 in previous studies), the minimal size of the validation data set is 84 when the expected precision of estimate (ie, the maximum marginal error) is 0.1 and CI is 95%. Therefore, among the study population, we performed random sampling to create NLP training (n=115) and validation (n=115) data sets. Ten patients were excluded from the validation data because there were no associated ETT reports.
The ETT reports of the remaining 105 patients in the validation data set were reviewed independently by an emergency physician (A.L.S.) and a cardiologist (M.S.L.). Besides the final ETT impression, the physician review also abstracted additional information from the ETT reports (Data S2). ETT reports were primarily to assist reviewers and the NLP algorithm to appropriately categorize patients into ischemic, nondiagnostic, equivocal, or normal categories. The following are the simplified definitions for each category:
Ischemic: Cardiologist‐reported ischemic changes or abnormal ST results defined as an upsloping ST change ≥2 mm or downsloping or horizontal ST change ≥1 mm.
Nondiagnostic: Patient heart rate (HR) does not rise to 85% of the maximum predicted HR during ETT.
Equivocal: Any abnormal results that were not categorized by ischemic or nondiagnostic definitions.
Normal: Patient completed the ETT with an appropriate maximum predicted HR and no ischemic ECG changes or other significant abnormalities.
Other definitions used to categorize ETT results are found in Data S3. The results of physician review were compared, and discrepancies were resolved by consensus and discussion with the other physicians on the research team (B.S., M.F., R.F.R.). The adjudicated results served as the reference standard against which NLP was compared.
NLP Algorithm Development
The NLP modules used in this study were previously described.9, 11 Terminologies were created to capture ETT‐related information (Data S4). The NLP search was performed for each report on 3 levels: sentence, neighboring sentences, and section (Data S5). A relationship detection algorithm was applied to relate the identified symptoms to the corresponding time periods. Negation and temporal relationship detection algorithms were applied to identify and exclude negated, uncertain, historical, and future statements. Negation algorithm handles double negations that commonly occur in ETT reports, eg, “no significant abnormality.” Regular expressions were created to capture some of the values. We developed separated algorithms to identify and extract each clinical variable commonly available in ETT reports (Figure 1, Data S2, and Table S1).
Figure 1.
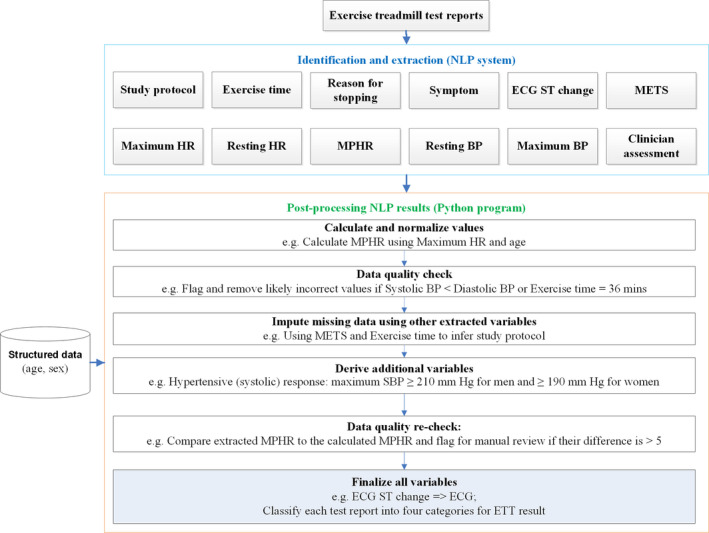
Diagram illustrating the natural language processing (NLP) process to extract and process exercise treadmill test (ETT) reports. BP indicates blood pressure; HR, heart rate; METs, metabolic equivalents; MPHR, maximum predicted heart rate; SBP, systolic blood pressure.
A postprocessing step was developed using Python programming language to integrate and finalize the results. Additional variables were derived based on the NLP‐extracted variables and the variables (age and sex) from structured EHR data (Data S2 and Table S2). A data imputing step was performed to fill missing data using other variables. For example, based on the age and maximum HR, maximum predicted HR can be calculated (Data S3). Based on the exercise time and metabolic equivalents (METs), it can infer whether it is the standard Bruce protocol (Data S6). Algorithms have also been developed to identify incorrect information in the reports. For example, incorrect values were flagged and discarded if they were out of the clinical range, such as an MET of 50. The magnitude of ST change and its direction was used to classify the ECG result into normal, abnormal, and equivocal categories (Data S7).22 The ETT results were classified as abnormal, normal, equivocal, and nondiagnostic categories based on the clinician's assessment as well as the other information documented in the reports (Data S3).22, 23 The NLP algorithm was developed and iteratively improved using the training data set.
NLP Algorithm Validation
The performance of NLP was evaluated against the validation data set at the patient level. Confusion matrix, a type of class‐tabulation table commonly used in the visualization of the performance of a machine learning classification algorithm, was depicted to compare the NLP results to the reference standard for identification of ETT results. The multicategory variables were dichotomized into 2 categories for evaluation purposes. The numbers of true positives, false positives, true negatives, and false negatives were calculated for each variable. Sensitivity, specificity, positive predictive value, negative predictive value, and negative/positive likelihood ratios were then derived based on those numbers.
Application of NLP Algorithm and Analysis
NLP algorithms were further refined based on the validation results. The final NLP algorithm was then applied to the entire study population of patients with exercise testing to identify the ETT results. Patient characteristics and comorbidities were compared among the different ETT results. The ETT result was treated as a nominal variable rather than an ordinal variable. The primary outcome was 30‐day AMI or all‐cause mortality. The secondary outcome was 30‐day major adverse cardiac event rates, which was the composite of death, AMI, and any coronary revascularization procedures. We calculated P values using chi‐square or Fisher exact tests for all categorical variables and Wilcoxon test for all continuous variables. The significance threshold was set at 0.05. To reduce potential bias for rare events, logistic regression with Firth penalized maximum likelihood method24 was used to estimate odds ratios (ORs) and 95% CIs. C‐statistics were calculated for the ETT's ability to predict the primary and secondary outcomes. All data were analyzed using SAS version 9.4 (SAS Institute Inc.). The institutional review board at KPSC approved this study. Requirement for informed consent was waived.
Results
Our study population included 5214 patients with a median age of 56 years, 50.4% were women, and 48.1% were white (Table 1). The interannotator agreements (Cohen κ) on the validation data set were reported in Table S3. The overall agreements are substantial to excellent based on Landis and Koch.25 In the reference standard, the percentages of abnormal, equivocal, nondiagnostic, and normal ETT results were 5.7%, 6.7%, 14.3%, and 73.3%, respectively. NLP achieved 96.4% sensitivity and 94.8% specificity on identifying non‐normal (abnormal/equivocal/nondiagnostic) versus normal ETT tests (Table 2) on the validation data set. The positive predictive value was 87.1% and the negative predictive value was 98.6%. NLP had the highest accuracy in identifying nondiagnostic results. For abnormal and equivocal results, NLP had higher specificity and negative predictive value but lower sensitivity and positive predictive value. The evaluation results for the other 9 ETT variables are presented in Table 3. NLP achieved high accuracy on these variables except for the relatively low positive predictive value for symptom identification.
Table 1.
Comparison of Patient Characteristics by Treadmill Test Results
| Patient Variables | Normal | Abnormal | Equivocal | Nondiagnostic | P Valuea | Total |
|---|---|---|---|---|---|---|
| No. (%) | 3908 (75) | 310 (5.9) | 344 (6.6) | 652 (12.5) | 5214 (100) | |
| Age, ya | 55 (47, 64) | 58 (50, 65) | 57 (49, 64) | 60 (52, 69) | <0.001 | 56 (48, 65) |
| Women | 1955 (50) | 138 (44.5) | 182 (52.9) | 355 (54.4) | 0.022 | 2630 (50.4) |
| Hispanic | 1591 (40.7) | 123 (39.7) | 129 (37.5) | 278 (42.6) | 0.68 | 2121 (40.7) |
| Race | 0.32 | |||||
| White | 1895 (48.5) | 154 (49.7) | 166 (48.3) | 294 (45.1) | 2509 (48.1) | |
| Black | 400 (10.2) | 37 (11.9) | 42 (12.2) | 90 (13.8) | 569 (10.9) | |
| Asian | 492 (12.6) | 42 (13.5) | 47 (13.7) | 86 (13.2) | 667 (12.8) | |
| Alaska Native/Pacific Islander | 79 (2) | 3 (1) | 6 (1.7) | 9 (1.4) | 97 (1.9) | |
| Other | 1042 (26.7) | 74 (23.9) | 83 (24.1) | 173 (26.5) | 1372 (26.3) | |
| Smoking behavior | 0.003 | |||||
| Never | 2548 (65.2) | 203 (65.5) | 240 (69.8) | 393 (60.3) | 3384 (64.9) | |
| Other | 1253 (32.1) | 100 (32.3) | 102 (29.7) | 249 (38.2) | 1704 (32.7) | |
| HEART score | 3 (2, 4) | 4 (3, 4) | 3 (2, 4) | 4 (2, 5) | 0.009 | 1065 (20.4) |
| HEART score (risk groups) | 0.12 | |||||
| Low (0–3) | 468 (58.6) | 32 (46.4) | 44 (60.3) | 60 (48) | 604 (56.7) | |
| Intermediate (4–6) | 320 (40.1) | 35 (50.7) | 27 (37) | 63 (50.4) | 445 (41.8) | |
| High (≥7) | 10 (1.3) | 2 (2.9) | 2 (2.7) | 2 (1.6) | 16 (1.5) | |
| Elixhauser index | 2 (1, 3) | 2 (1, 4) | 2 (1, 4) | 3 (2, 5) | <0.001 | 5214 (100) |
| Comorbidities | ||||||
| Coronary artery disease | 217 (5.6) | 51 (16.5) | 29 (8.4) | 95 (14.6) | <0.001 | 392 (7.5) |
| Stroke | 31 (0.8) | 4 (1.3) | 2 (0.6) | 11 (1.7) | 0.12 | 48 (0.9) |
| Dyslipidemia | 2279 (58.3) | 203 (65.5) | 206 (59.9) | 437 (67) | <0.001 | 3125 (59.9) |
| Hypertension | 1605 (41.1) | 179 (57.7) | 166 (48.3) | 419 (64.3) | <0.001 | 2369 (45.4) |
| Diabetes mellitus | 756 (19.3) | 96 (31) | 76 (22.1) | 210 (32.2) | <0.001 | 1138 (21.8) |
| Medications, No. (%)b | ||||||
| Anticoagulants | 109 (2.8) | 15 (4.8) | 18 (5.2) | 52 (8) | <0.0001 | 194 (3.7) |
| Hyperlipidemics | 965 (24.7) | 104 (33.5) | 98 (28.5) | 247 (37.9) | <0.0001 | 1414 (27.1) |
| Hypertensives | 1233 (31.6) | 139 (44.8) | 122 (35.5) | 351 (53.8) | <0.0001 | 1845 (35.4) |
| Diabetes mellitus | 421 (10.8) | 58 (18.7) | 49 (14.2) | 134 (20.6) | <0.0001 | 662 (12.7) |
HEART indicates history, ECG, age, risk factors, and troponin.
Chi‐square test was used for categorical variables, and Wilcoxon test was used for continuous variables.
Continuous variables are expressed as median (25th, 75th percentiles). Data are presented as number (percentage) unless otherwise indicated.
Medication usage in the 90 days before emergency department visits.
Table 2.
Comparison of NLP to the Reference Standard for Identification of ETT Results
| Confusion Matrix | NLP | Total | |||
|---|---|---|---|---|---|
| Reference Standard | Normal | Abnormal | Equivocal | Nondiagnostic | |
| Normal | 73 | 1 | 3 | 77 | |
| Abnormal | 1 | 5 | 6 | ||
| Equivocal | 2 | 7 | 9 | ||
| Nondiagnostic | 13 | 13 | |||
| Total | 74 | 8 | 10 | 13 | |
| Comparison Groupsa | Sensitivity, % (95% CI) | Specificity, % (95% CI) | PPV, % (95% CI) | NPV, % (95% CI) |
|---|---|---|---|---|
| Normal vs rest | 96.4 (79.8–99.8) | 94.8 (86.5–98.3) | 87.1 (69.2–95.8) | 98.6 (91.7–99.9) |
| Abnormal vs rest | 83.3 (36.5–99.1) | 97.0 (90.8–99.2) | 62.5 (25.9–89.8) | 99.0 (93.6–99.9) |
| Equivocal vs rest | 77.8 (40.2–96.1) | 96.9 (90.5–99.2) | 70.0 (35.4–91.9) | 97.9 (91.9–99.6) |
| Nondiagnostic vs rest | 100 (71.7–100) | 100 (95.0–100) | 100 (71.7–100) | 100 (95.0–100) |
NLP indicates natural language processing; NPV, negative predictive value; PPV, positive predictive value.
For evaluation purposes, the multicategory exercise treadmill test (ETT) results were dichotomized into 2 categories.
Table 3.
Comparison of NLP to the Reference Standard for Identification of Treadmill Test Variables
| ETT Variables | Reference Standard (n/N) | Sensitivity % (95% CI) | Specificity % (95% CI) | PPV % (95% CI) | NPV % (95% CI) |
|---|---|---|---|---|---|
| Study protocola | 98/105 | 95.9 (89.3–98.7) | 100 (77.1–100) | 100 (95.1–100) | 81 (57.4–93.7) |
| Exercise time | 104/105 | 94.2 (87.4–97.6) | 100 (67.9–100) | 100 (95.3–100) | 64.7 (38.6–84.7) |
| Reasons for stoppinga | 92/105 | 98.9 (93.2–99.9) | 100 (82.2–100) | 100 (95–100) | 95.8 (76.9–99.8) |
| Symptoma | 100/105 | 80 (29.9–98.9) | 94 (86.9–97.5) | 40 (13.7–72.6) | 98.9 (93.4–99.9) |
| Symptom2a | 89/105 | 100 (39.6–100) | 98.8 (92.7–99.9) | 80 (29.9–98.9) | 100 (94.6–100) |
| ECGa | 105/105 | 98.1 (92.6–99.7) | 100 (67.9–100) | 100 (95.5–100) | 84.6 (53.7–97.3) |
| METs | 104/105 | 100 (95.6–100) | 100 (67.9–100) | 100 (95.6–100) | 100 (67.9–100) |
| Maximum BP | 96/105 | 96.9 (90.5–99.2) | 100 (79.1–100) | 100 (95.1–100) | 86.4 (64–96.4) |
| MPHR | 104/105 | 100 (95.6–100) | 100 (67.9–100) | 100 (95.6–100) | 100 (67.9–100) |
| Maximum HR | 94/105 | 90.4 (82.2–95.3) | 100 (80.8–100) | 100 (94.6–100) | 70 (50.4–84.6) |
The results of sensitivity, specificity, positive predictive value (PPV), and negative predictive value (NPV) findings were reported as percentages with 95% CIs. BP indicates blood pressure; ETT, exercise treadmill test; METs, metabolic equivalents; MPHR, maximum predicted heart rate; NLP, natural language processing.
- Study protocol: standard Bruce protocol vs other types of study protocols.
- Reasons for stopping: target heart rate (HR) achieved vs other reasons.
- Symptom: no symptoms vs abnormal, atypical angina, atypical symptoms.
- Symptom 2: no symptoms vs abnormal.
- ECG: normal, nondiagnostic vs abnormal.
The refined NLP algorithm was applied to the 5214 ETT reports. The percentages of abnormal, equivocal, nondiagnostic, and normal ETT results were 5.9%, 6.6%, 12.5%, and 75%, respectively. Table 1 shows patient characteristics stratified by the ETT results. The troponin values were reported in Table S4. Most of these patients had a troponin value <0.02 ng/mL.
The mean and median days from ED to ETT were 4 and 1, respectively. Bruce protocol was used in 95% of patients. Table 4 presents the ETT variables stratified by the ETT results. Compared with the patients with normal ETT results, the other groups were more likely to have shorter exercise time, lower METs, lower maximum HR, and chronotropic incompetence.
Table 4.
Comparison of ETT Variables by NLP Identified ETT Results
| ETT Variables | Normal | Abnormal | Equivocal | Nondiagnostic | P Valuea | Total |
|---|---|---|---|---|---|---|
| No. (%) | 3908 (75) | 310 (5.9) | 344 (6.6) | 652 (12.5) | 5214 (100) | |
| Days between ED and ETT | 1 (1, 5) | 1 (1, 3) | 1 (1, 5.5) | 1 (1, 3) | <0.001 | 5214 (100) |
| Protocol—standard Bruce | 3745 (95.8) | 298 (96.1) | 326 (94.8) | 562 (86.2) | <0.001 | 4931 (94.6) |
| Exercise time, min | 8.8 (6.6, 10) | 7.2 (6, 9.1) | 7.6 (6, 9.4) | 6.4 (4.3, 8.4) | <0.001 | 5079 (97.4) |
| BP | ||||||
| Resting SBP | 128 (117, 141) | 131 (118, 142) | 132 (120, 144.5) | 133 (120, 146) | <0.001 | 4780 (91.7) |
| Resting DBP | 80 (72, 86) | 79 (70, 88) | 80 (72, 88) | 78 (70, 84) | <0.001 | 4781 (91.7) |
| Resting pulse pressure | 48 (40, 58) | 50 (41, 61) | 52 (41, 61) | 54 (44, 66) | <0.001 | 4780 (91.7) |
| Maximum SBP | 178 (160, 196) | 180 (162, 199) | 181 (162, 198) | 174 (155, 196) | 0.005 | 4780 (91.7) |
| Maximum DBP | 80 (70, 88) | 79 (70, 87) | 80 (71, 88) | 80 (69, 87) | 0.2 | 4780 (91.7) |
| Maximum pulse pressure | 98 (80, 117) | 100.5 (82, 120.5) | 100 (83, 118) | 94 (78, 115) | 0.03 | 4780 (91.7) |
| SBP change | 50 (36, 63) | 48 (33, 65) | 49 (36, 60) | 41 (28, 58) | <0.001 | 4586 (88) |
| Hypertensive | 1342 (34.3) | 98 (31.6) | 126 (36.6) | 199 (30.5) | 0.14 | 1765 (33.9) |
| Hypertensive (diastolic) | 693 (17.7) | 49 (15.8) | 64 (18.6) | 115 (17.6) | <0.001 | 921 (17.7) |
| Hypertensive (systolic) | 828 (21.2) | 65 (21) | 86 (25) | 123 (18.9) | <0.001 | 1102 (21.1) |
| Hypotensive | 3 (0.1) | 1 (0.3) | 1 (0.3) | 3 (0.5) | 0.04b | 8 (0.2) |
| Low SBP peak | 208 (5.3) | 23 (7.4) | 19 (5.5) | 63 (9.7) | 0.001 | 313 (6) |
| HR | ||||||
| Resting HR | 74 (65, 83) | 69 (63, 78) | 73 (64, 82) | 67 (60, 76) | <0.001 | 4822 (92.5) |
| Maximum HR | 155 (146, 166) | 150 (139, 160) | 153 (141, 162) | 126 (114, 139) | <0.001 | 4939 (94.7) |
| MPHR | 94 (89, 100) | 90 (86, 98) | 92 (87, 98) | 78 (72, 83) | <0.001 | 5170 (99.2) |
| Chronotropic incompetence | 852 (21.8) | 108 (34.8) | 109 (31.7) | 491 (75.3) | <0.001 | 1560 (29.9) |
| METs | <0.001 | 5100 (97.8) | ||||
| ≤7 | 745 (19.1) | 92 (29.7) | 101 (29.4) | 291 (44.6) | 1229 (23.6) | |
| 7 to 10 | 926 (23.7) | 76 (24.5) | 78 (22.7) | 153 (23.5) | 1233 (23.6) | |
| >10 | 2178 (55.7) | 135 (43.5) | 160 (46.5) | 165 (25.3) | 2638 (50.6) | |
| Symptom | <0.001 | 5214 (100) | ||||
| Abnormal chest pain | 113 (2.9) | 73 (23.5) | 24 (7) | 41 (6.3) | 251 (4.8) | |
| Atypical angina | 264 (6.8) | 52 (16.8) | 36 (10.5) | 85 (13) | 437 (8.4) | |
| Atypical symptoms | 279 (7.1) | 21 (6.8) | 29 (8.4) | 93 (14.3) | 422 (8.1) | |
| No symptoms | 3252 (83.2) | 164 (52.9) | 255 (74.1) | 433 (66.4) | 4104 (78.7) | |
| ECG finding | <0.001 | 5199 (99.7) | ||||
| Abnormal | 47 (1.2) | 152 (49) | 74 (21.5) | 35 (5.4) | 308 (5.9) | |
| Nondiagnostic | 300 (7.7) | 28 (9) | 105 (30.5) | 70 (10.7) | 503 (9.6) | |
| Normal | 3561 (91.1) | 130 (41.9) | 165 (48) | 532 (81.6) | 4388 (84.2) | |
| Reason for stoppingc | <0.001 | |||||
| Target HR achieved | 3489 (71.3) | 229 (54.3) | 298 (66.4) | 482 (51.4) | 4498 (67.1) | |
| Noncardiac | 268 (5.5) | 31 (7.3) | 34 (7.6) | 143 (15.3) | 476 (7.1) | |
| Abnormal BP response | 108 (2.2) | 7 (1.7) | 13 (2.9) | 39 (4.2) | 167 (2.5) | |
| Dyspnea | 271 (5.5) | 44 (10.4) | 31 (6.9) | 80 (8.5) | 426 (6.4) | |
| Chest pain | 163 (3.3) | 61 (14.5) | 20 (4.5) | 55 (5.9) | 299 (4.5) | |
| Missing | 592 (12.1) | 50 (11.8) | 53 (11.8) | 138 (14.7) | 833 (12.4) | |
Continuous variables are shown as median (25th, 75th percentiles). Data are presented as number (percentage) unless otherwise indicated. BP indicates blood pressure; DBP, diastolic blood pressure; ED, emergency department; ETT, exercise treadmill test; HR, heart rate; METs, metabolic equivalents; MPHR, maximum predicted heart rate; NLP, natural language processing; SBP, systolic blood pressure.
Chi‐square test was used for categorical variables and Wilcoxon test was used for continuous variables.
Fisher exact test.
Reason for stopping allows multiple values per report.
Overall event rates were low (Table 5, Figure 2). There were associations of increasing 30‐day death/AMI with ETT results (P<0.001) from normal (0.08%; 95% CI, 0–0.16), to nondiagnostic (0.77%; 95% CI, 0.1–1.44), to equivocal (0.58%; 95% CI, 0–1.38), to abnormal (1.9%; 95% CI, 0.4–3.47). There were stronger associations of increasing 30‐day major adverse cardiac event rates with ETT results (P<0.001) from normal (0.08%; 95% CI, 0–0.16), to nondiagnostic (1.1%; 95% CI, 0.28–1.86), to equivocal (2.03%; 95% CI, 0.54–3.53), to abnormal (10.0%; 95% CI, 6.66–13.34).
Table 5.
Thirty‐Day Major Adverse Cardiac Outcomes Stratified by NLP Identified Treadmill Test Results After an ED Visit for Suspected Acute Coronary Syndrome
| 30‐d Outcomes | NLP Identified ETT Results | P Valuea | Total | ||||||||
|---|---|---|---|---|---|---|---|---|---|---|---|
| Normal | Abnormal | Equivocal | Nondiagnostic | ||||||||
| No. | % (95% CI) | No. | % (95% CI) | No. | % (95% CI) | No. | % (95% CI) | No. | % (95% CI) | ||
| MACE | 3 | 0.08 (0–0.16) | 31 | 10 (6.66–13.34) | 7 | 2.03 (0.54–3.53) | 7 | 1.07 (0.28–1.86) | <0.001 | 48 | 0.92 (0.66–1.18) |
| Death | 0 | 0 (0–0) | 1 | 0.32 (0–0.95) | 0 | 0 (0–0) | 0 | 0 (0–0) | 0.06 | 1 | 0.02 (0–0.06) |
| AMI | 3 | 0.08 (0–0.16) | 5 | 1.61 (0.21–3.02) | 2 | 0.58 (0–1.38) | 5 | 0.77 (0.1–1.44) | <0.001 | 15 | 0.29 (0.14–0.43) |
| CABG | 0 | 0 (0–0) | 16 | 5.16 (2.7–7.62) | 1 | 0.29 (0–0.86) | 2 | 0.31 (0–0.73) | <0.001 | 19 | 0.36 (0.2–0.53) |
| Revascularization | 2 | 0.05 (0–0.12) | 12 | 3.87 (1.72–6.02) | 5 | 1.45 (0.19–2.72) | 3 | 0.46 (0–0.98) | <0.001 | 22 | 0.42 (0.25–0.6) |
| Death or AMI | 3 | 0.08 (0–0.16) | 6 | 1.94 (0.4–3.47) | 2 | 0.58 (0–1.38) | 5 | 0.77 (0.1–1.44) | <0.001 | 16 | 0.31 (0.16–0.46) |
AMI indicates acute myocardial infarction; CABG, coronary artery bypass grafting; ED, emergency department; ETT, exercise treadmill test; MACE, major adverse cardiac events (which included cardiovascular death, acute myocardial infraction, coronary artery bypass grafting, and coronary revascularization); NLP, natural language processing.
Fisher exact test.
Figure 2.
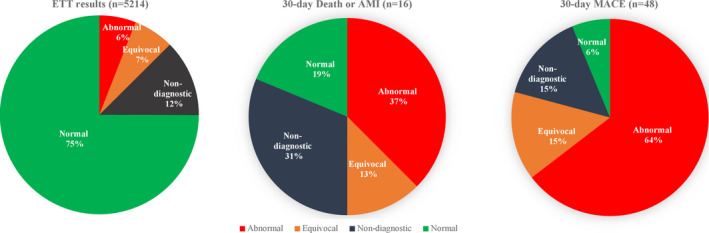
Thirty‐day MACE stratified by natural language processing–identified treadmill test results after an emergency department visit for suspected acute coronary syndrome. AMI indicates acute myocardial infarction; ETT, exercise treadmill test; MACE, major adverse cardiac events (which included cardiovascular death, acute myocardial infraction, coronary artery bypass grafting, and coronary revascularization).
Table 6 presents the unadjusted ORs for ETT results in patients who had 30‐day major adverse cardiac event rates or death/AMI versus patients who did not. Compared with normal ETT, nondiagnostic, equivocal, and abnormal ETT were associated with higher odds of 30‐day death/AMI (nondiagnostic: OR, 9.5 [95% CI, 2.5–40.9]; equivocal: OR, 8.1 [95% CI, 1.4–42.0]; and abnormal: OR, 23.8 [95% CI, 6.7–100.4]). The C‐statistic was 0.81 (95% CI, 0.70–0.92). Compared with normal ETT, nondiagnostic, equivocal, and abnormal ETT were associated with higher odds of 30‐day major adverse cardiac event rates (nondiagnostic: OR, 13 [95% CI, 3.8–53.5]; equivocal: OR, 24.8 [95% CI, 7.3–102.5]; and abnormal: OR, 125.8 [95% CI, 47.2–466.3]). The C‐statistic was 0.9 (95% CI, 0.86–0.95).
Table 6.
Thirty‐Day Major Adverse Cardiac Outcomes Stratified by NLP Identified Treadmill Test Results After an ED Visit for Suspected Acute Coronary Syndrome
| ETT Results | 30‐d MACE | 30‐d Death or AMI | ||
|---|---|---|---|---|
| No. of Cases | OR (95% CI)a | No. of Cases | OR (95% CI)a | |
| Abnormal vs normal | 31:3 | 125.8 (47.2–466.3) | 6:3 | 23.8 (6.7–100.4) |
| Equivocal vs normal | 7:3 | 24.8 (7.3–102.5) | 2:3 | 8.1 (1.4–42.0) |
| Nondiagnostic vs normal | 7:3 | 13.0 (3.8–53.5) | 5:3 | 9.5 (2.5–40.9) |
Number of patients in the 4 groups of exercise treadmill test (ETT) results: abnormal=310; equivocal=344; nondiagnostic=652; and normal=3908. AMI indicates acute myocardial infarction; ED, emergency department; MACE, major adverse cardiac events (which included cardiovascular death, acute myocardial infraction, coronary artery bypass grafting, and coronary revascularization); NLP, natural language processing; OR, odds ratio.
Logistic regression with Firth penalized maximum likelihood estimation.
Discussion
In the era of big data, unstructured (or free‐text) data in the EHR has become an increasingly valuable source for clinical research and operational measurement. However, the traditional approach of using unstructured data requires manual chart review. Manual chart review is not only time‐consuming and costly but it often lacks accuracy and consistency.26 In this study, we derived and validated a highly accurate automatic algorithm using NLP to identify, extract, and synthesize information from free‐text ETT reports. The NLP algorithm had high sensitivity and specificity compared with physician reviewers and accurately identified normal, ischemic, nondiagnostic, and equivocal ETT results. We expect these results would yield similar results in different systems as we have found previous NLP algorithms developed in our institution have been successful in other institutions.27, 28
Our results were further validated by the varying association of each ETT result category with 30‐day AMI or death. These findings indicate that NLP can be used to facilitate future research and gain better understanding of the benefits and risks of ETT. This may help physicians to identify patients who might benefit from the use of ETT.
Prior studies categorized results into 2 categories (normal and abnormal)22 or included a third category of “inconclusive,” which combined equivocal and nondiagnostic results.19, 20, 23, 29 However, our study demonstrated that there are significant differences between “equivocal” and “nondiagnostic” results. Patients with equivocal and nondiagnostic results most closely resembled those with normal and abnormal results, respectively, in baseline characteristics. Patients with equivocal ETT test results were more likely to have non‐normal ECG findings.
Few studies have focused on the prognostic value of ETT in patients with short‐term cardiac events referred from the ED with suspected acute coronary syndrome. Compared with a related study composed of a much smaller patient population, our study found lower 30‐day death or AMI rates for patients with normal (0.17% versus 0.08%) or ischemic (3.5% versus 1.9%) ETTs but higher rates for those with nondiagnostic (0% versus 0.77%) results.20 Three‐fourths of our study population had normal ETT results, consistent with other reports.19, 20, 21 The overall 30‐day death/AMI rate was low (0.31%; 95% CI, 0.16–0.46), which may suggest that patients are sent for stress testing too often and a better pretest risk stratification is needed.
Even within an integrated health system, we identified numerous variations on the format and quality of the ETT reports. While some reports contained the most information in a well‐formed format, as shown in the sample ETT report (Data S5), others had missing data elements, section heads, and punctuation. NLP also identified incorrect and missing information in the reports (Table S5). In addition to its usage in research studies, this method can be integrated into the EHR system to improve the quality of ETT reports, thus improving clinical decision support and care coordination for patients undergoing ETT. Proper treatment and follow‐up of patients undergoing ETT are essential to reduce the risk of future cardiac events. NLP's ability to extract useful information from unstructured data available in the EHR may enable more efficient, economically feasible, large‐scale applications using ETT data among diverse systems.
There were significant differences in the majority of extracted variables between ETT result groups. These variables have been reported to have additional diagnostic or prognostic values in addition to the ETT result.30 The Duke Treadmill Score is a weighted score combining exercise time, ST change, and exercise‐induced angina.31 It has been used as a risk‐stratification tool and to predict 5‐year mortality. However, it was developed for ETT under the Bruce protocol and did not include other ETT variables such as METs, HR, or blood pressure. The FIT Treadmill Score was derived by combining age, sex, maximum predicted HR, and METs.32 It was used to predict 10‐year mortality and did not include other variables such as ECG, HR, or blood pressure. There are a lack of population‐based studies on short‐term outcomes prediction following ETT.33 A much larger study population is required for short‐term outcome prediction because of the low incidence rate. The risk models were also commonly linear equations derived by Cox regression models. In the era of artificial intelligence and big data, better machine learning methods have been available to train on a large volume of data efficiently.34 The new machine learning methods are also able to deal with the imbalanced data such as the low positive cardiac outcomes following ETTs. The NLP algorithm developed in this study facilitates the development of a more robust risk score system using statistical and machine learning methods. Such a system may provide better prognostic value than the raw ETT results.
Study Strengths and Limitations
To the best of our best knowledge, this is the largest study on the association of ETT results with short‐term cardiac event rates. We found that most patients are at low risk and have normal ETT results, while those with ischemic, nondiagnostic, or equivocal results have higher risks and warrant future research to help direct clinical management.
Our study population was limited to patients in a large integrated health system presenting to the ED with ETT performed within 30 days. ETTs were also performed for patients in non‐ED settings. The automated approach developed in this study does not rely on any specific clinical features unique to our institution. ETT results were mainly based on the treating clinician's interpretations, rather than adjudicated by a core laboratory. However, variations in test interpretation are expected among the clinicians. We limited our analyses to short‐term outcomes using only the ETT result since it is often the only information used in clinical decision making.23 The other variables extracted by the NLP in this study could be used to augment the ETT results for better prediction of short‐term outcomes in future studies. Our study focused on the ETT reports, which do not have ECG tracing information. The only structured data we used in the algorithms were the patient's age and sex. Including additional clinical variables will likely enhance short‐term outcome prediction. Patients presenting to the ED with ETT have a low rate of short‐term cardiac events. Of more than 5000 patients, only 16 had an AMI or died at 30 days (Table 5). In the future, we may reassess these correlations in a larger population.
Conclusions
We developed and validated an automated NLP algorithm to identify and extract ETT results that performed with high sensitivity and specificity. We demonstrated that a computational tool could be used to support a population‐based study using ETT data otherwise infeasible because of the extensive manual chart review that would be required. The automated identification of ETT variables may facilitate future research to understand the appropriate care strategies for patients who present with suspected acute coronary syndrome in ED settings.
Sources of Funding
This work was supported by the National Heart, Lung, and Blood Institute of the National Institutes of Health (NIH) under award number R01HL134647. The content is solely the responsibility of the authors and does not necessarily represent the official views of the NIH. Dr Natsui was supported by a NIH/National Center for Advancing Translational Sciences UCLA CTSI grant (TL1TR001883). Dr Ferencik was supported by an American Heart Association Fellow‐to‐Faculty Award (13FTF16450001).
Disclosures
Dr Sun was a consultant for Medtronic. The remaining authors have no disclosures to report.
Supporting information
Data S1.
Data S2.
Data S3.
Data S4.
Data S5.
Data S6.
Data S7.
Table S1. ETT Variables Extracted by NLP
Table S2. ETT Variables Derived Based on NLP‐Extracted Information
Table S3. Kappa Scores Between the 2 Physicians on the Validation Data Set Measured by the Treadmill Test Variables
Table S4. Troponin Values by ETT Results
Table S5. Number of Conflicted or Missing Cases for Selected Variables
Acknowledgments
The authors thank the patients of Kaiser Permanente for helping us improve care through the use of information collected through our EHR systems. We also thank Danielle E. Altman, MA, and Stacy J. Park, PhD, for their assistance in organizing and managing this project.
(J Am Heart Assoc. 2020;9:e014940 DOI: 10.1161/JAHA.119.014940.)
References
- 1. Brooker JA, Hastings JW, Major‐Monfried H, Maron CP, Winkel M, Wijeratne HR, Fleischman W, Weingart S, Newman DH. The association between medicolegal and professional concerns and chest pain admission rates. Acad Emerg Med. 2015;22:883–886. [DOI] [PubMed] [Google Scholar]
- 2. Fihn SD, Gardin JM, Abrams J, Berra K, Blankenship JC, Dallas AP, Douglas PS, Foody JM, Gerber TC, Hinderliter AL, King SB III, Kligfield PD, Krumholz HM, Kwong RY, Lim MJ, Linderbaum JA, Mack MJ, Munger MA, Prager RL, Sabik JF, Shaw LJ, Sikkema JD, Smith CR Jr, Smith SC Jr, Spertus JA, Williams SV; American College of Cardiology F . 2012 ACCF/AHA/ACP/AATS/PCNA/SCAI/STS guideline for the diagnosis and management of patients with stable ischemic heart disease: executive summary: a report of the American College of Cardiology Foundation/American Heart Association Task Force on Practice Guidelines, and the American College of Physicians, American Association for Thoracic Surgery, Preventive Cardiovascular Nurses Association, Society for Cardiovascular Angiography and Interventions, and Society of Thoracic Surgeons. Circulation. 2012;126:3097–3137. [DOI] [PubMed] [Google Scholar]
- 3. Prasad V, Cheung M, Cifu A. Chest pain in the emergency department: the case against our current practice of routine noninvasive testing. Arch Intern Med. 2012;172:1506–1509. [DOI] [PubMed] [Google Scholar]
- 4. Redberg RF. Stress testing in the emergency department: not which test but whether any test should be done. JAMA Intern Med. 2015;175:436. [DOI] [PubMed] [Google Scholar]
- 5. Foy AJ, Liu G, Davidson WR Jr, Sciamanna C, Leslie DL. Comparative effectiveness of diagnostic testing strategies in emergency department patients with chest pain: an analysis of downstream testing, interventions, and outcomes. JAMA Intern Med. 2015;175:428–436. [DOI] [PMC free article] [PubMed] [Google Scholar]
- 6. Venkatesh AK, Geisler BP, Gibson Chambers JJ, Baugh CW, Bohan JS, Schuur JD. Use of observation care in US emergency departments, 2001 to 2008. PLoS One. 2011;6:e24326. [DOI] [PMC free article] [PubMed] [Google Scholar]
- 7. Sabbatini AK, Nallamothu BK, Kocher KE. Reducing variation in hospital admissions from the emergency department for low‐mortality conditions may produce savings. Health Aff (Millwood). 2014;33:1655–1663. [DOI] [PubMed] [Google Scholar]
- 8. Heston TF. Letter by Heston regarding article, “comparative effectiveness of exercise electrocardiography with or without myocardial perfusion single photon emission computed tomography in women with suspected coronary artery disease: results from the what is the optimal method for ischemia evaluation in women (WOMEN) trial”. Circulation. 2012;125:e933; author reply e932‐935. [DOI] [PubMed] [Google Scholar]
- 9. Zheng C, Rashid N, Wu YL, Koblick R, Lin AT, Levy GD, Cheetham TC. Using natural language processing and machine learning to identify gout flares from electronic clinical notes. Arthritis Care Res (Hoboken). 2014;66:1740–1748. [DOI] [PubMed] [Google Scholar]
- 10. Maddox TM, Matheny MA. Natural language processing and the promise of big data: small step forward, but many miles to go. Circ Cardiovasc Qual Outcomes. 2015;8:463–465. [DOI] [PubMed] [Google Scholar]
- 11. Zheng C, Rashid N, Koblick R, An J. Medication extraction from electronic clinical notes in an integrated health system: a study on aspirin use in patients with nonvalvular atrial fibrillation. Clin Ther. 2015;37:2048–2058.e2042. [DOI] [PubMed] [Google Scholar]
- 12. Xie F, Zheng C, Yuh‐Jer Shen A, Chen W. Extracting and analyzing ejection fraction values from electronic echocardiography reports in a large health maintenance organization. Health Informatics J. 2017;23:319–328. [DOI] [PubMed] [Google Scholar]
- 13. An J, Niu F, Zheng C, Rashid N, Mendes RA, Dills D, Vo L, Singh P, Bruno A, Lang DT, Le PT, Jazdzewski KP, Aranda G Jr. Warfarin management and outcomes in patients with nonvalvular atrial fibrillation within an integrated health care system. J Manag Care Spec Pharm. 2017;23:700–712. [DOI] [PMC free article] [PubMed] [Google Scholar]
- 14. Backus BE, Six AJ, Kelder JC, Mast TP, van den Akker F, Mast EG, Monnink SH, van Tooren RM, Doevendans PA. Chest pain in the emergency room: a multicenter validation of the HEART Score. Crit Pathw Cardiol. 2010;9:164–169. [DOI] [PubMed] [Google Scholar]
- 15. Sharp AL, Wu YL, Shen E, Redberg R, Lee MS, Ferencik M, Natsui S, Zheng C, Kawatkar A, Gould MK, Sun BC. The HEART score for suspected acute coronary syndrome in U.S. emergency departments. J Am Coll Cardiol. 2018;72:1875–1877. [DOI] [PMC free article] [PubMed] [Google Scholar]
- 16. Quan H, Sundararajan V, Halfon P, Fong A, Burnand B, Luthi JC, Saunders LD, Beck CA, Feasby TE, Ghali WA. Coding algorithms for defining comorbidities in ICD‐9‐CM and ICD‐10 administrative data. Med Care. 2005;43:1130–1139. [DOI] [PubMed] [Google Scholar]
- 17. Sharp AL, Baecker AS, Shen E, Redberg R, Lee MS, Ferencik M, Natsui S, Zheng C, Kawatkar A, Gould MK, Sun BC. Effect of a HEART care pathway on chest pain management within an integrated health system. Ann Emerg Med. 2019;74:171–180. [DOI] [PMC free article] [PubMed] [Google Scholar]
- 18. Hajian‐Tilaki K. Sample size estimation in diagnostic test studies of biomedical informatics. J Biomed Inform. 2014;48:193–204. [DOI] [PubMed] [Google Scholar]
- 19. Christman MP, Bittencourt MS, Hulten E, Saksena E, Hainer J, Skali H, Kwong RY, Forman DE, Dorbala S, O'Gara PT, Di Carli MF, Blankstein R. Yield of downstream tests after exercise treadmill testing: a prospective cohort study. J Am Coll Cardiol. 2014;63:1264–1274. [DOI] [PMC free article] [PubMed] [Google Scholar]
- 20. Amsterdam EA, Kirk JD, Diercks DB, Lewis WR, Turnipseed SD. Immediate exercise testing to evaluate low‐risk patients presenting to the emergency department with chest pain. J Am Coll Cardiol. 2002;40:251–256. [DOI] [PubMed] [Google Scholar]
- 21. Diercks DB, Hollander JE, Sites F, Kirk JD. Derivation and validation of a risk stratification model to identify coronary artery disease in women who present to the emergency department with potential acute coronary syndromes. Acad Emerg Med. 2004;11:630–634. [PubMed] [Google Scholar]
- 22. Fletcher GF, Ades PA, Kligfield P, Arena R, Balady GJ, Bittner VA, Coke LA, Fleg JL, Forman DE, Gerber TC, Gulati M, Madan K, Rhodes J, Thompson PD, Williams MA; American Heart Association Exercise, Cardiac Rehabilitation, and Prevention Committee of the Council on Clinical Cardiology, Council on Nutrition, Physical Activity and Metabolism, Council on Cardiovascular and Stroke Nursing, and Council on Epidemiology and Prevention . Exercise standards for testing and training: a scientific statement from the American Heart Association. Circulation. 2013;128:873–934. [DOI] [PubMed] [Google Scholar]
- 23. Amsterdam EA, Kirk JD, Bluemke DA, Diercks D, Farkouh ME, Garvey JL, Kontos MC, McCord J, Miller TD, Morise A, Newby LK, Ruberg FL, Scordo KA, Thompson PD. Testing of low‐risk patients presenting to the emergency department with chest pain: a scientific statement from the American Heart Association. Circulation. 2010;122:1756–1776. [DOI] [PMC free article] [PubMed] [Google Scholar]
- 24. Firth D. Bias reduction of maximum likelihood estimates. Biometrika. 1993;80:27–38. [Google Scholar]
- 25. Landis JR, Koch GG. The measurement of observer agreement for categorical data. Biometrics. 1977;33:159–174. [PubMed] [Google Scholar]
- 26. Vassar M, Holzmann M. The retrospective chart review: important methodological considerations. J Educ Eval Health Prof. 2013;10:12. [DOI] [PMC free article] [PubMed] [Google Scholar]
- 27. Zheng C, Yu W, Xie F, Chen W, Mercado C, Sy LS, Qian L, Glenn S, Lee G, Tseng HF, Duffy J, Jackson LA, Daley MF, Crane B, McLean HQ, Jacobsen SJ. The use of natural language processing to identify Tdap‐related local reactions at five health care systems in the Vaccine Safety Datalink. Int J Med Inform. 2019;127:27–34. [DOI] [PMC free article] [PubMed] [Google Scholar]
- 28. Danforth KN, Early MI, Ngan S, Kosco AE, Zheng C, Gould MK. Automated identification of patients with pulmonary nodules in an integrated health system using administrative health plan data, radiology reports, and natural language processing. J Thorac Oncol. 2012;7:1257–1262. [DOI] [PMC free article] [PubMed] [Google Scholar]
- 29. Barraclough K, Gale CP, Hall R. Assessment of chest pain in a low risk patient: is the exercise tolerance test obsolete? BMJ. 2015;350:h1905. [DOI] [PubMed] [Google Scholar]
- 30. Ashley EA, Myers J, Froelicher V. Exercise testing in clinical medicine. Lancet. 2000;356:1592–1597. [DOI] [PubMed] [Google Scholar]
- 31. Mark DB, Shaw L, Harrell FE Jr, Hlatky MA, Lee KL, Bengtson JR, McCants CB, Califf RM, Pryor DB. Prognostic value of a treadmill exercise score in outpatients with suspected coronary artery disease. N Engl J Med. 1991;325:849–853. [DOI] [PubMed] [Google Scholar]
- 32. Ahmed HM, Al‐Mallah MH, McEvoy JW, Nasir K, Blumenthal RS, Jones SR, Brawner CA, Keteyian SJ, Blaha MJ. Maximal exercise testing variables and 10‐year survival: fitness risk score derivation from the FIT Project. Mayo Clin Proc. 2015;90:346–355. [DOI] [PubMed] [Google Scholar]
- 33. Jonas DE, Reddy S, Middleton JC, Barclay C, Green J, Baker C, Asher GN. Screening for cardiovascular disease risk with resting or exercise electrocardiography: evidence report and systematic review for the US Preventive Services Task Force. JAMA. 2018;319:2315–2328. [DOI] [PubMed] [Google Scholar]
- 34. Murphy KP. Machine Learning: A Probabilistic Perspective. Cambridge, MA: The MIT Press; 2012. [Google Scholar]
Associated Data
This section collects any data citations, data availability statements, or supplementary materials included in this article.
Supplementary Materials
Data S1.
Data S2.
Data S3.
Data S4.
Data S5.
Data S6.
Data S7.
Table S1. ETT Variables Extracted by NLP
Table S2. ETT Variables Derived Based on NLP‐Extracted Information
Table S3. Kappa Scores Between the 2 Physicians on the Validation Data Set Measured by the Treadmill Test Variables
Table S4. Troponin Values by ETT Results
Table S5. Number of Conflicted or Missing Cases for Selected Variables