

Abstract
Background
Limited data are available on the prospective relationship between beverage consumption and plasma lipid and lipoprotein concentrations. Two major sources of sugar in the US diet are sugar‐sweetened beverages (SSBs) and 100% fruit juices. Low‐calorie sweetened beverages are common replacements.
Methods and Results
Fasting plasma lipoprotein concentrations were measured in the FOS (Framingham Offspring Study) (1991–2014; N=3146) and Generation Three (2002–2001; N=3584) cohorts. Beverage intakes were estimated from food frequency questionnaires and grouped into 5 intake categories. Mixed‐effect linear regression models were used to examine 4‐year changes in lipoprotein measures, and Cox proportional hazard models were used to estimate hazard ratios for incident dyslipidemia, adjusting for potential confounding factors. We found that regular (>1 serving per day) versus low (<1 serving per month) SSB consumption was associated with a greater mean decrease in high‐density lipoprotein cholesterol (β±standard error −1.6±0.4 mg/dL; P trend<0.0001) and increase in triglyceride (β±standard error: 4.4±2.2 mg/dL; P trend=0.003) concentrations. Long‐term regular SSB consumers also had a higher incidence of high triglyceride (hazard ratio, 1.52; 95% CI, 1.03–2.25) compared with low consumers. Although recent regular low‐calorie sweetened beverage consumers had a higher incidence of high non–high‐density lipoprotein cholesterol (hazard ratio, 1.40; 95% CI, 1.17–1.69) and low‐density lipoprotein cholesterol (hazard ratio, 1.27; 95% CI, 1.05–1.53) concentrations compared with low consumers, cumulative average intakes of low‐calorie sweetened beverages were not associated with changes in non–high‐density lipoprotein cholesterol, low‐density lipoprotein cholesterol concentrations, or incident dyslipidemias.
Conclusions
SSB intake was associated with adverse changes in high‐density lipoprotein cholesterol and triglyceride concentrations, along with a higher risk of incident dyslipidemia, suggesting that increased SSB consumption may contribute to the development of dyslipidemia.
Keywords: carbohydrates, dyslipidemia, fruit juice, low‐calorie sweetened beverages, nutrition, observational study, sugar‐sweetened beverages
Subject Categories: Epidemiology, Diet and Nutrition, Lipids and Cholesterol
Clinical Perspective
What Is New?
In this cohort of US adults followed for a mean of 12.5 years, regular consumption of sugar‐sweetened beverages, which includes sodas and fruit drinks, was associated with adverse changes in lipoprotein concentrations and increased incidence of dyslipidemias related to triglyceride and high‐density lipoprotein cholesterol.
While we observed some adverse changes in lipoprotein concentrations and incidence of dyslipidemia with recent consumption of low‐calorie sweetened beverages, which includes naturally and artificially sweetened “diet” drinks, we observed no significant relationship between long‐term low‐calorie sweetened beverage consumption and incidence of dyslipidemias.
Our study suggests that regular consumption of 100% fruit juice up to 1.5 servings per day was not associated with adverse changes in lipoprotein concentrations or incident dyslipidemias, but further research is warranted.
What Are the Clinical Implications?
Our results support the recommendations to limit sugar‐sweetened beverage intake and suggest that dyslipidemia may be one mechanistic pathway whereby sugar‐sweetened beverage intake may increase cardiovascular disease risk.
Dietary patterns low in sugar‐sweetened beverages may contribute to maintenance of favorable plasma lipoprotein profiles.
Consumption of low‐calorie sweetened beverages and limited amounts of 100% fruit juice (up to 1.5 servings per day) do not appear to adversely influence lipoprotein concentrations.
Introduction
An estimated 40% to 50% of adults in the United States can be classified as having dyslipidemia,1 characterized by high triglyceride, high low‐density lipoprotein cholesterol (LDL‐C), and/or low high‐density lipoprotein cholesterol (HDL‐C) concentrations, predisposing them to increased risk for cardiovascular disease (CVD).2 Thus, managing patients’ blood lipid concentrations is a major focus for health professionals.3 Dietary modification offers a promising strategy to both prevent and treat dyslipidemia.4
Evidence from observational studies suggests that there is a positive association between added sugar intake and CVD risk,5, 6 particularly in the form of sugar‐sweetened beverages (SSBs).7 SSBs, such as sodas, fruit‐flavored drinks, sports drinks, and presweetened coffees and teas, are a significant source of added sugars in the diets of US adults and a major contributor to excess energy intake.8 One potential mechanism by which SSBs may increase the risk for CVD is through the development of dyslipidemia. Animal and human intervention trials suggest that consumption of large amounts of sugar, particularly those high in fructose, can rapidly induce dyslipidemia.9, 10, 11 Several cross‐sectional studies have observed that higher SSB consumption is adversely associated with lipid concentrations.12, 13, 14, 15, 16 In the FHS (Framingham Heart Study), a higher incidence of hypertriglyceridemia and low HDL‐C concentrations were observed among men with higher soft drink consumption.17 In that report, soft drinks included both SSBs and low‐calorie sweetened beverages (LCSBs).
One hundred percent fruit juices (FJs) and LCSBs are commonly used as alternative “healthier” beverages to SSBs.18, 19 Evidence from randomized controlled trials and observational studies is mixed for the association between LCSB16, 20, 21 and FJ consumption22, 23 and CVD. These potential differences in physiological effects of SSBs, LCSBs, and FJs underscore the necessity to examine these beverage consumption exposures separately, which is in contrast to the aforementioned study among FHS participants17 that combined both SSBs and LCSBs into one “soft drink” exposure.
The objective of the present study was to examine the association of SSB, LCSB, and FJ consumption with longitudinal changes in concentrations of triglyceride, LDL‐C, HDL‐C, and non–HDL‐C in the FOS (Framingham Offspring Study) and GEN3 (Generation Three) cohorts. We hypothesized that greater SSB consumption would associate with unfavorable longitudinal changes in lipoprotein concentrations and incident dyslipidemia, and to a greater extent than LCSBs and FJs.
Methods
Study Participants
The FHS is a long‐standing, prospective cohort study in Framingham, Massachusetts, that began in 1948. Data from FOS24 at examination 5 (1991–1995; n=3799), examination 6 (1995–1998; n=3532), examination 7 (1998–2001; n=3539), examination 8 (2005–2008; n=3021), and examination 9 (2011–2014; n=2430), and GEN325 at examination 1 (2002–2005; n=4095) and examination 2 (2008–2011; n=3411), were used in the current study for up to 23 years of follow‐up (mean follow‐up, 12.5 years). In each cohort and at each examination cycle within FHS, participants underwent a detailed medical history, physical examination, and standard laboratory tests. Participants also provided demographic, diet, lifestyle, and medical history data via standard questionnaires. All participants provided written informed consent before study participation. All study protocols and procedures were approved by the institutional review boards for human research at Boston University Medical Campus and Tufts University Health Sciences. Requests by researchers on how to access the data for the purposes of reproducing the results can be made to the corresponding author.
Assessment of Lipid Outcomes
Fasting blood samples from FHS participants were used to measure plasma HDL‐C (mg/dL), triglyceride (mg/dL), and total cholesterol (TC) (mg/dL) concentrations using standard assays at each examination. LDL‐C concentrations were calculated according to the Friedewald equation (LDL‐C=TC−HDL‐C− triglyceride/5), and set to missing if triglyceride concentrations were ≥400 mg/dL.26 Non–HDL‐C concentrations were calculated as TC minus HDL‐C concentrations. Non–HDL‐C concentrations were explored because observational studies have shown them to be more predictive of cardiovascular events than individual lipid concentrations alone.27, 28 Changes in each of these lipid measurements were calculated as the difference between 2 consecutive examinations. To correct for unequal time intervals between examinations, changes in lipoprotein concentrations were normalized to 4‐year changes.
Four dyslipidemia outcomes were defined as: LDL‐C concentrations ≥160 mg/dL or use of LDL‐C–lowering medications; HDL‐C concentrations <40 mg/dL in men or <50 mg/dL in women; triglyceride concentrations ≥175 mg/dL; and non–HDL‐C concentrations ≥190 mg/dL or use of LDL‐C–lowering medications. The cut points for LDL‐C, HDL‐C, triglyceride, and non–HDL‐C concentrations are established cutoffs for CVD risk‐enhancing factors in the 2018 Guideline on the Management of Blood Cholesterol.4
A total of 3146 FOS and 3584 GEN3 participants provided diet and lipid measures at baseline (examination 5 in FOS and examination 1 in GEN3 in this study). A total of 3182 FOS and 2805 GEN3 participants provided diet and lipid measures for at least 2 consecutive examination periods from examinations 5 to 9 in FOS and 1 to 2 in GEN3. FOS participants contributed multiple observations if diet and lipid measures were provided at >2 consecutive examination periods. Participants were excluded from each cohort if the change in lipoprotein concentrations was not within 4 SDs of the mean 4‐year change within the respective cohort. A total of 58 FOS and 5 GEN3 participants were excluded because they were missing change in all lipoprotein concentration data, reducing the sample size to 3124 in the FOS cohort and 2800 in the GEN3 cohort for analysis of change in lipoprotein concentrations (a maximum of 11 659 observations in the pooled analysis). These criteria resulted in different sample sizes for each lipoprotein outcome: LDL‐C (8598 observations among 3082 FOS participants and 2744 GEN3 participants), triglyceride (8818 observations among 3118 FOS participants and 2776 GEN3 participants), HDL‐C (8787 observations among 3115 FOS participants and 2784 GEN3 participants), and non–HDL‐C (8734 observations among 3111 FOS participants and 2777 GEN3 participants).
The analysis of the development of dyslipidemia was conducted in a smaller sample as participants were excluded from the analysis for the following reasons: prevalent dyslipidemia at baseline, use of LDL‐C–lowering medications (for lipid outcomes that include LDL‐C concentrations), or lack of follow‐up data. Missing data for covariates were carried forward from the previous examination. After these exclusions, the sample sizes were as follows for the development of dyslipidemia: FOS cohort based on LDL‐C (n=2161), HDL‐C (n=1703), triglyceride (n=2116), and non–HDL‐C (n=2205); and GEN3 cohort based on LDL‐C (n=2377), HDL‐C (n=2084), triglyceride (n=2426), and non–HDL‐C (n=2400).
Beverage Consumption
Usual dietary intakes in the past year were estimated at each examination using the Harvard 126‐item semi‐quantitative food‐frequency questionnaire (FFQ).29 The FFQ was mailed to participants to be completed at home and returned at the study appointment. The FFQ consisted of a list of foods with standard serving sizes and a selection of 9 frequency categories ranging from none or <1 serving per month to ≥6 servings per day. Dietary information was considered valid only if reported energy intake was as follows: ≥600 kcal/d for both men and women; <4000 kcal/d for women; <4200 kcal/d for men; and if ≤13 food items were left blank on the FFQ. The relative validity of the FFQ in FHS has been examined for both nutrients and foods in men and women in other cohorts.29, 30
Estimates of SSB consumption included the following categories: (1) Coke, Pepsi, or other cola with sugar; (2) caffeine‐free Coke, Pepsi, or other cola with sugar; (3) other carbonated beverage with sugar (eg, 7Up, ginger ale); and (4) Hawaiian Punch, lemonade, or other noncarbonated fruit drinks. Estimates of FJ consumption included the following categories: (1) orange juice; (2) grapefruit juice; (3) apple juice or cider; and (4) other 100% FJs. Estimates of LCSB consumption included the following categories: (1) low‐calorie cola, eg, Tab with caffeine; (2) low‐calorie caffeine‐free cola, eg, Pepsi Free; and (3) other low‐calorie carbonated beverage, eg, Fresca, Diet 7Up, and diet ginger ale. The low‐calorie sweeteners found in these beverages could include either naturally or artificially derived sweeteners that provide either no or few (<40 per serving) calories (kcal). One serving of SSB or LCSB is equivalent to 12 fluid ounces, and one serving FJ is equivalent to 8 fluid ounces.
Covariate Assessment
Education was assessed by asking the highest degree or level of school the participant had completed (obtained in FOS at examination 8 and GEN3 at examination 1), and participants were grouped into 4 categories (less than high school, high school, some college, graduated college). Participants self‐reported whether they had taken medication for high blood cholesterol since their last examination, and participants were classified as having diabetes mellitus if their fasting blood glucose was ≥126 mg/dL or they were under current treatment for diabetes mellitus. In the GEN3 cohort, an additional criterion was applied where participants were classified as having diabetes mellitus if their nonfasting blood glucose was ≥200 mg/dL. Participants also completed a standardized physical examination, which included measurements of height, weight, and waist circumference (measured at the level of the umbilicus in a standing position). Body mass index (BMI) was calculated as weight divided by height (kg/m2). Alcohol intake was assessed by asking the number of alcoholic beverages consumed in a typical week in the previous year and expressed as grams per day. Current smokers were defined as participants who reported smoking regularly in the past year. Physical activity was evaluated through a standard exercise questionnaire.31 Physical activity was not assessed at examination 6, so the physical activity estimates from examination 5 and examination 7 were used to estimate physical activity during the intervals of examination 5 to 6 and examination 6 to 7, respectively.
Nutrient intakes were calculated from FFQ data by multiplying the frequency of consumption of a food item by the nutrient contents per standard serving size for the given food item. Potential confounding through other dietary components was explored through adjustment of individual dietary factors (percent energy from saturated fat and servings per day of fruit, vegetables, whole grains, fish, and nuts/seeds), as well as through a composite diet quality score: the 2015 Dietary Guidelines Adherence Index (2015 DGAI),32 which reflects adherence to key recommendations based on the 2015 Dietary Guidelines for Americans.
Statistical Analyses
Linear mixed effects regression models were used to examine the association between beverage consumption patterns and 4‐year changes in fasting LDL‐C, HDL‐C, triglyceride, and non–HDL‐C concentrations using the pedigreemm R package (https://cran.r-project.org). Familial correlation and multiple observations per person were accounted for by adding a random effects term in the model with a covariance structure proportional to the kinship matrix and a random effects term for individual, respectively. To estimate usual dietary intakes and covariate data within each examination interval, the average of the two measurements within the examination intervals was computed. Beverage consumption was explored using 5 categories of intake (<1 serving per month, 1–4 servings per month, 1–2 servings per week, 3–7 servings per week, >1 serving per day), similar to previous studies.16, 33 Three models were performed. Model 1 adjusted for age (continuous), sex (male/female), total energy intake (continuous), baseline lipoprotein concentrations during each interval (continuous), education (less than high school, graduated high school, some college, or graduated college), current smoking status (yes/no), current diabetes mellitus (yes/no), physical activity index (continuous), alcohol (grams per day), use of LDL‐C–lowering medication (yes/no; where applicable); model 2 adjusted for model 1 covariates plus servings per day of vegetables, whole fruits, whole grains, nuts/seeds, and seafood, as well as percent energy from saturated fat (continuous) and mutual adjustment for SSBs, LCSBs, and FJs (categorical as continuous). Model 3 adjusted for model 2 covariates plus the change in waist circumference (WC) (continuous), which is a marker of abdominal adiposity and could be in the causal pathway between beverage consumption and development of dyslipidemia. Covariate adjustment did not drastically change the results, so fully adjusted models are presented (model 3). Models were run separately for FOS and GEN3 cohorts, and then data were combined in a pooled analysis (adjusting for cohort). For the presentation of the cross‐stratified association of SSBs and LCSBs on lipid concentrations in Figure 1, intakes were grouped as follows: low intake (<1 serving per month), medium intake (1–10 servings per month), and high intake (>3 servings per week). The joint association of SSBs and LCSBs was modeled as the interaction of the low/medium/high categories of intake among participants, and the models were compared using likelihood ratio testing with and without multiplicative interaction terms.
Figure 1.
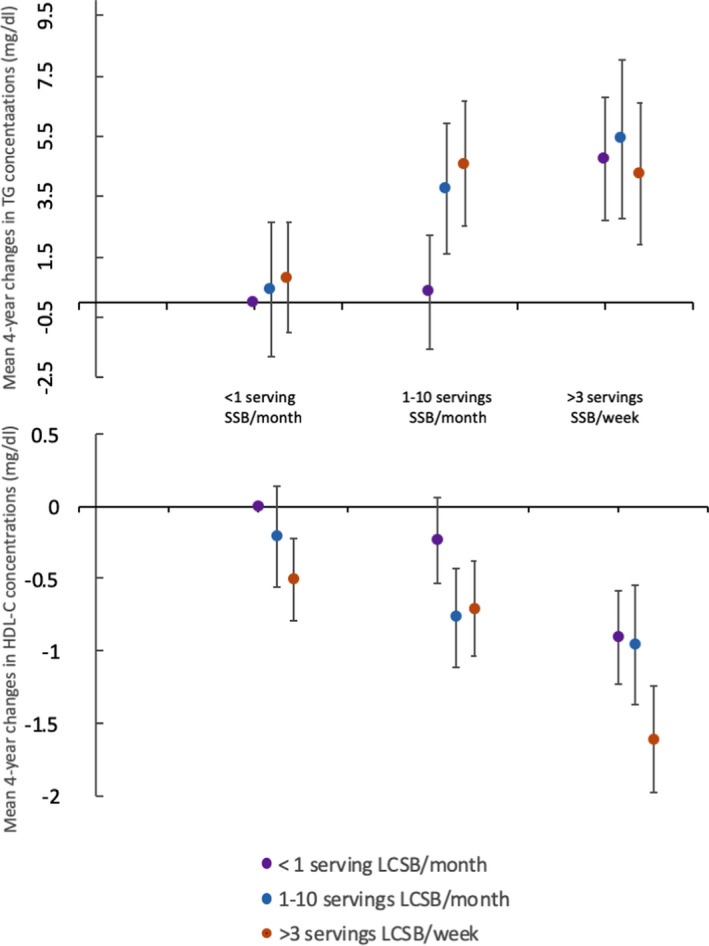
Relationship between cross‐stratified sugar‐sweetened beverage (SSB) and low‐calorie sweetened beverage (LCSB) intakes for mean 4‐year changes in high‐density lipoprotein cholesterol (HDL‐C) and triglyceride concentrations among Framingham cohorts (pooled data). Participants in the highest categories of both SSB and LCSB intakes had mean 4‐year increases in triglyceride concentrations 4.3 mg/dL greater (β±standard error: 4.3±2.4 mg/dL; P=0.07) and mean 4‐year decreases in HDL‐C concentrations 1.6 mg/dL greater (β±SE: −1.6±0.4 mg/dL; P<0.0001) compared with those in the lowest categories of both SSB and LCSB intakes. There was little evidence of a significant interaction between SSB and LCSB intake (P>0.01 for the interaction). All changes in lipoprotein concentrations were adjusted for age, cohort, sex, total energy, baseline lipoprotein concentration, education, current smoking status, current diabetes mellitus status, physical activity index, alcohol intake, percent energy from saturated fat, change in waist circumference, and servings per day of vegetables, whole fruits, 100% fruit juice, whole grains, nuts/seeds, and seafood. Multivariable‐adjusted β estimates for additional comparisons are presented in Table S2. Vertical error bars indicate standard errors for regression coefficients.
For analysis of the development of dyslipidemia, we applied Cox proportional hazards models with time‐varying covariates and follow‐up time as the underlying time scale to estimate hazard ratios (HRs) and 95% CIs of dyslipidemia for beverage consumption using the survival R package (https://cran.r-project.org). Given that the GEN3 participants were younger and followed for only 1 examination, the main analyses were performed in the FOS cohort and validation was performed in the GEN3 cohort. Family structure and multiple observations were accounted for using a robust standard error and clustering on family and individual, respectively. We tested the proportional hazard assumption by examining the scaled Schoenfeld residuals over time, and the assumption was unlikely violated. Beverage exposure was estimated as “recent” intake (ie, intake at the examination before developing dyslipidemia) and as “cumulative” average intake. In the FOS, cumulative mean intake was calculated as the mean intake reported at examinations up to and including the examination of dyslipidemia diagnosis (eg, fifth and sixth examinations for those who developed dyslipidemia by the sixth examination; the fifth, sixth, and seventh examinations for those who developed dyslipidemia by the seventh examination). For those who did not develop dyslipidemia during follow‐up, the cumulative mean was calculated across all available examination data (examination 5 to examination 8). Beverage intakes were grouped in 5 categories in the same manner as the analysis of changes in lipoprotein concentrations, and we examined the linear trend by modeling beverage consumption categories as a continuous variable.
Multivariable Cox proportional hazards models were adjusted for potential confounders, which were updated at each examination cycle. Models were adjusted for age (continuous), sex (male/female), total energy (continuous), education (less than high school, graduated high school, some college, or graduated college), current smoking status (yes/no), current diabetes mellitus status (yes/no), physical activity index (continuous), alcohol (grams per day), WC (continuous), servings per day of vegetables, whole fruits, whole grains, nuts/seeds, and seafood, as well as percent energy from saturated fat (continuous) and mutual adjustment for SSBs, LCSBs, and FJs (categorical as continuous).
Secondary Analyses
For both analyses, likelihood ratio testing comparing models with and without multiplicative interaction terms were used to assess effect modification by sex (male/female) and BMI (<25 kg/m2; 25–29.9 kg/m2; ≥30 kg/m2). No significant interactions were observed; thus, data are not stratified in the main analysis. Several sensitivity analyses were conducted to examine the consistency of the associations. To minimize reverse causation, analyses were performed eliminating those who developed diabetes mellitus or began taking lipid‐lowering medications. To evaluate whether overall diet quality was adequately controlled for in our models, the dietary covariates (vegetables, whole fruits, whole grains, nuts/seeds, seafood, and saturated fat) were replaced with 2015 DGAI (calculated without the added sugar component).32 Furthermore, we substituted adjustment for WC with BMI (continuous) and adjusted for both WC and BMI to consider whether overall adiposity, compared with abdominal adiposity, changed the reported associations.
All statistical analyses were performed using either SAS (version 9.4 or higher; SAS Institute) or R (version 3.1 or higher; https://cran.r-project.org) statistical software. All reported P values are 2‐sided, and results were considered statistically significant at a Bonferroni‐corrected P<0.01 (0.05/4 outcomes).
Results
Table 1 shows the characteristics of participants for each cohort and examination cycle. Mean age (±SD) at baseline was 54.8 years (±9.8 years) among FOS participants and 40.3 years (±8.8 years) among GEN3 participants. Participants smoked less, achieved more education, had increased BMI and WC, and a higher percent was classified as having diabetes mellitus and took LDL‐C–lowering medications with each subsequent examination cycle. Lipoprotein concentrations (LDL‐C, HDL‐C, triglyceride, and non–HDL‐C) improved across examination cycles. Differences in dietary intakes across examinations were not substantial (<0.5 servings per day), but statistically significant P for trends were observed. We observed a slight decrease in consumption of SSBs, FJs, and LCSBs among both FOS (1991–2008) and GEN3 (2002–2011) participants across examination cycles. Among FOS participants, mean intakes of total energy, vegetables, and seafood remained similar through the examination cycles, whereas increases were observed for energy from saturated fat (percent), and servings of whole fruits, whole grains, and nuts/seeds. Trends were different among GEN3 participants where decreases were observed in total energy intake, percent energy from saturated fat, and consumption of whole fruits, vegetables, whole grains, nuts/seeds, and seafood.
Table 1.
Characteristics of Participants by Cohort and Examination Cycle
| Framingham Offspring Study Cohort | P Trenda | Generation 3 Cohort | P Valuea | ||||||
|---|---|---|---|---|---|---|---|---|---|
| Examination 5: 1991–1995 | Examination 6: 1995–1998 | Examination 7: 1998–2001 | Examination 8: 2005–2008 | Examination 9: 2011–2014 | Examination 1: 2002–2005 | Examination 2: 2008–2011 | |||
| No. | 3146 | 3008 | 2697 | 2529 | 2204 | 3584 | 3132 | ||
| Age, y | 54.8 (9.8) | 58.7 (9.6) | 61 (9.4) | 66.3 (8.9) | 71.2 (8.7) | <0.0001 | 40.3 (8.8) | 46.6 (8.7) | <0.0001 |
| Women, % | 53.1 | 53.6 | 54.3 | 55.2 | 54.9 | 0.09 | 54.3 | 54.1 | 0.88 |
| Current smoker, % | 19.1 | 15.1 | 12.0 | 8.4 | 5.8 | 0.002 | 14.5 | 9.9 | <0.0001 |
| Education (% some college) | 60.5 | 62.3 | 64.6 | 66.3 | 68.9 | <0.0001 | 85.3 | 84.5 | 0.75 |
| BMI, kg/m2 | 27.4 (5.0) | 27.9 (5.1) | 28.2 (5.3) | 28.2 (5.4) | 28.4 (5.4) | <0.0001 | 26.8 (5.5) | 28.0 (5.8) | <0.0001 |
| WC, in | 36.5 (5.6) | 38.4 (5.3) | 39.3 (5.5) | 39.9 (5.7) | 40.1 (5.5) | <0.0001 | 36.5 (5.9) | 38.1 (6.0) | <0.0001 |
| Physical activity index | 34.7 (6.1) | NA | 37.9 (6.3) | 35.3 (5.4) | 34.8 (5.8) | 0.08 | 37.3 (7.7) | 36.4 (6.6) | <0.0001 |
| LDL‐C, mg/dL | 126 (33) | 127 (33) | 120 (33) | 105 (31) | 99 (31) | <0.0001 | 112 (32) | 104 (31) | <0.0001 |
| HDL‐C, mg/dL | 50 (15) | 51 (16) | 54 (17) | 58 (18) | 62 (19) | <0.0001 | 55 (16) | 60 (18) | <0.0001 |
| Triglyceride, mg/dLb | 125 (92) | 119 (89) | 117 (87) | 104 (69) | 103 (63) | <0.0001 | 97 (73) | 97 (66) | 0.16 |
| Non–HDL‐C | 262 (81) | 258 (78) | 250 (77) | 220 (68) | 211 (63) | <0.0001 | 220 (76) | 212 (71) | <0.0001 |
| Diabetes mellitus, % | 7.1 | 9.5 | 10.8 | 13.2 | 14.5 | <0.0001 | 2.9 | 4.7 | <0.0001 |
| LDL‐C–lowering medication users, % | 7.3 | 13.0 | 20.7 | 42.9 | 50.1 | <0.0001 | 6.8 | 16.2 | <0.0001 |
| Dietary intakes | |||||||||
| Total energy, kcal/d | 1862 (612) | 1846 (607) | 1827 (591) | 1866 (626) | NA | 0.33 | 2055 (667) | 1990 (628) | <0.0001 |
| Saturated fat, % total energy | 10.4 (2.9) | 10.1 (2.8) | 10.7 (2.9) | 11.1 (2.7) | NA | <0.0001 | 11.5 (2.9) | 10.5 (2.5) | <0.0001 |
| Alcohol, g/db | 1.24 (13.3) | 1.19 (13) | 1.14 (12.9) | 1.20 (13.9) | NA | 0.001 | 1.9 (12.8) | 2.3 (14.5) | 0.006 |
| Whole fruits, servings per db | 0.66 (1.09) | 0.77 (1.12) | 0.79 (1.13) | 0.78 (1.13) | NA | <0.0001 | 0.64 (1.06) | 0.54 (0.92) | <0.0001 |
| Vegetables, servings per db | 1.74 (1.22) | 1.75 (1.23) | 1.75 (1.26) | 1.75 (1.24) | NA | 0.28 | 1.77 (1.37) | 1.60 (1.20) | <0.0001 |
| Whole grain, servings per db | 0.62 (1.31) | 0.62 (1.25) | 0.65 (1.34) | 0.83 (1.40) | NA | <0.0001 | 0.71 (1.21) | 0.17 (0.44) | <0.0001 |
| Nuts/seeds, servings per db | 0.16 (0.36) | 0.14 (0.36) | 0.18 (0.50) | 0.36 (0.86) | NA | <0.0001 | 0.28 (0.64) | 0.11 (0.36) | <0.0001 |
| Seafood, servings per db | 0.29 (0.37) | 0.27 (0.33) | 0.29 (0.37) | 0.30 (0.37) | NA | 0.68 | 0.26 (0.38) | 0.21 (0.28) | <0.0001 |
| SSBs, servings per db , c | 0.09 (0.49) | 0.09 (0.44) | 0.08 (0.42) | 0.05 (0.20) | NA | <0.0001 | 0.12 (0.56) | 0.08 (0.42) | <0.0001 |
| 100% FJ, servings per db , c | 0.36 (0.93) | 0.37 (0.99) | 0.37 (0.92) | 0.23 (0.93) | NA | <0.0001 | 0.31 (0.87) | 0.21 (0.79) | <0.0001 |
| LCSBs, servings per db , c | 0.10 (0.85) | 0.09 (0.78) | 0.08 (0.70) | 0.07 (0.49) | NA | <0.0001 | 0.08 (0.70) | 0.06 (0.42) | <0.0001 |
Maximum available observations for analyses. Values are means (SDs) unless otherwise indicated. Means are compared with the use of general linear models. BMI indicates body mass index; HDL‐C, high‐density lipoprotein cholesterol; LDL‐C, low‐density lipoprotein cholesterol; NA, not available; WC, waist circumference.
P trend (Framingham Offspring Study cohort) or P value (Generation 3 cohort) for examination follow‐up number.
Geometric mean (interquartile range).
One serving of sugar‐sweetened beverages (SSBs) or low‐calorie sweetened beverages (LCSBs) is equivalent to 12 fluid ounces, and 1 serving of 100% fruit juice (FJ) is equivalent to 8 fluid ounces.
Table 2 shows that after multivariable adjustment for potential confounding factors and change in abdominal adiposity (covariate model 3), participants in the highest category of SSB intake (>1 serving per day) had a 1.6 mg/dL lower mean 4‐year change in HDL‐C concentrations [β±standard error (SE): −1.6±0.4 mg/dL; P for trend <0.0001], and a 4.4 mg/dL higher mean 4‐year change in triglyceride concentrations (β±SE: 4.4±2.2 mg/dL; P for trend=0.003) than those in the lowest category of SSB intake (<1 serving per month). Participants in the highest category of LCSB consumption had mean 4‐year changes in HDL‐C concentrations 0.7 mg/dL lower than those in the lowest intake category (β±SE: −0.7±0.2 mg/dL; P for trend=0.001). No other significant associations between beverage consumption and lipid concentrations were observed in fully adjusted models after Bonferroni correction. No significant interactions were observed by cohort for analyses of change in lipoprotein concentrations (cohort‐specific results found in Table S1). However, the effect size in the association between SSB consumption and mean 4‐year changes in triglyceride concentrations was larger in the GEN3 cohort (β±SE: 10.8±3.5 mg/dL; P for trend=0.006) compared with the FOS cohort (β±SE: 2.6±2.9 mg/dL; P for trend=0.03). No significant interactions were observed between beverage intakes and sex or BMI. Similar results were observed in sensitivity analyses eliminating those who had diabetes mellitus or took LDL‐C–lowering medications, when food groups were substituted for the 2015 DGAI, and when the change in WC was replaced with the change in BMI. Additional analyses of the joint effects of SSB and LCSB revealed that the highest categories of both SSB and LCSB intakes had mean 4‐year changes in HDL‐C concentration (β±SE: −1.6±0.4 mg/dL; P<0.0001) and triglyceride concentration (β±SE: 4.3±2.4 mg/dL; P=0.07) compared with the nonconsumers, but no significant interaction was observed (P>0.01) (Figure 1 and Table S2).
Table 2.
Mean Difference in 4‐Year Changes in Lipid Traits Across Beverage Consumption Groups in Pooled Analysis for the Framingham Offspring Study and Generation 3a
| Beverage Consumption Groups | P for Trend | |||||
|---|---|---|---|---|---|---|
| <1 Serving per mo | 1 to 4 Servings per mo | 1 to 2 Servings per wk | 3 to 7 Servings per wk | >1 Serving per d | ||
| SSB intake | ||||||
| No. of observations | 4360 | 2215 | 1804 | 2281 | 999 | |
| Median intake, 12‐oz servings per wk | 0.1 | 0.7 | 1.7 | 3.9 | 10.2 | |
| LDL‐C | Reference | −0.6 (0.6) | 0.7 (0.7) | 0.1 (0.6) | 1.3 (0.9) | 0.25 |
| HDL‐C, mg/dL | Reference | −0.3 (0.2) | −0.5 (0.2) | −0.8 (0.2) | −1.6 (0.4) | <0.0001 |
| Triglyceride, mg/dL | Reference | 2.1 (1.4) | 2.4 (1.6) | 4.6 (1.5) | 4.4 (2.2) | 0.003 |
| Non–HDL‐C, mg/dL | Reference | −0.2 (0.7) | −0.5 (0.7) | 0.7 (0.7) | 1.8 (1.0) | 0.11 |
| LCSB intake | ||||||
| No. of observations | 5017 | 1463 | 1092 | 2396 | 1689 | |
| Median intake, 12‐oz servings per wk | 0.0 | 0.7 | 1.7 | 4.5 | 12.3 | |
| LDL‐C | Reference | 0.5 (0.7) | 0.8 (0.7) | −0.2 (0.6) | −0.2 (0.6) | 0.71 |
| HDL‐C, mg/dL | Reference | −0.3 (0.2) | −0.4 (0.3) | −0.5 (0.2) | −0.7 (0.2) | 0.001 |
| Triglyceride, mg/dL | Reference | 1.5 (1.6) | 1.7 (1.8) | 1.8 (1.3) | 1.3 (1.6) | 0.20 |
| Non–HDL‐C, mg/dL | Reference | 0.5 (0.7) | 0.7 (0.8) | 0.04 (0.6) | −0.3 (0.7) | 0.78 |
| 100% FJ intake | ||||||
| No. of observations | 1429 | 1368 | 1556 | 4710 | 2596 | |
| Median intake, 8‐oz servings per wk | 0.2 | 0.9 | 2.0 | 5.0 | 9.8 | |
| LDL‐C | Reference | 0.4 (0.8) | 0.5 (0.8) | −0.7 (0.7) | −0.9 (0.8) | 0.05 |
| HDL‐C, mg/dL | Reference | 0.23 (0.3) | −0.2 (0.3) | −0.4 (0.3) | −0.1 (0.3) | 0.20 |
| Triglyceride, mg/dL | Reference | 2.0 (2.0) | 0.1 (2.0) | 0.2 (1.6) | −3.2 (1.9) | 0.06 |
| Non–HDL‐C, mg/dL | Reference | 0.8 (0.9) | 0.4 (0.9) | −0.5 (0.8) | −1.5 (0.9) | 0.02 |
HDL‐C indicates high‐density lipoprotein cholesterol.
Maximum number of observations available is 11 659 (Framingham Offspring Study cohort: 8859 observations from 3124 participants; Framingham Generation 3 cohort: 2800 participants), but variation in the number of observations exists for each lipoprotein measure. Values are beta‐coefficients and standard errors for beverage intake in multivariable adjusted mixed effects models accounting for family structure and multiple observations, and adjusted for age (continuous), sex (male/female), total energy (continuous), baseline for lipid trait (continuous), education (less than high school, graduated high school, some college, or graduated college), current smoking status (yes/no), current diabetes mellitus status (yes/no), physical activity index (continuous), alcohol (grams per day), use of low‐density lipoprotein cholesterol (LDL‐C)–lowering medication (yes/no; where applicable), servings per day of vegetables, whole fruits, whole grains, nuts/seeds, and seafood, as well as percent energy from saturated fat (continuous), change in waist circumference, and mutual adjustment for sugar‐sweetened beverages (SSBs), low‐calorie sweetened beverages (LCSBs), and 100% fruit juice (FJ; categorical as continuous).
During a mean 12.5 years of follow‐up in the FOS cohort, incident cases of dyslipidemia were as follows: 961 cases of high LDL‐C, 319 cases of low HDL‐C, 457 cases of high triglyceride, and 975 cases of high non–HDL‐C. Multivariable‐adjusted HRs for the highest category of beverage consumption (>1 serving per day) compared with the lowest category (<1 serving per month), estimated as both recent and cumulative average intakes, are presented in Figure 2. After adjustment for potential confounders, in the FOS cohort the highest recent SSB consumers had 98% higher incidence of low HDL‐C (HR, 1.98; 95% CI, 1.20–3.28 [P for trend=0.01]) and 53% higher incidence of high triglyceride (HR, 1.53; 95% CI, 1.01–2.31 [P for trend=0.004]) compared with the lowest SSB consumers. For cumulative SSB intake, the risk was attenuated to nonsignificant for incidence of low HDL‐C (HR, 1.57; 95% CI, 0.97–2.54 [P for trend=0.09]) and high triglyceride (HR, 1.52; 95% CI, 1.03–2.25 [P for trend=0.03]), but effect sizes remained similar. The highest recent LCSB consumers had a 40% higher incidence of high non–HDL‐C (HR, 1.40; 95% CI, 1.17–1.69 [P for trend=0.0002]) and 27% higher incidence of high LDL‐C (HR, 1.27; 95% CI, 1.05–1.53 [P for trend=0.01]) compared with the lowest LCSB consumers. However, using cumulative average LCSB intakes, these associations were attenuated to nonsignificant (HDL‐C: HR, 1.06; 95% CI, 0.74–1.52 [P for trend=0.79]; Triglyceride: HR, 1.03, 0.76–1.39 [P for trend=0.51]), suggesting that reverse causation may explain the observation of increased risk for dyslipidemias related to LDL‐C and non–HDL‐C among high LCSB consumers. No other significant differences in incidences of dyslipidemia by category of beverage consumption were observed among FOS participants, although there was suggestion of a lower incidence of high non–HDL‐C observed among the highest compared with the lowest FJ consumers (HR, 0.75; 95% CI, 0.56–1.00 [P for trend=0.34]). Multivariable‐adjusted HRs for additional categories of beverage consumption are presented in Tables S3 and S4. During a mean follow‐up of 6.1 years in the GEN3 cohort, results for the association between recent SSB and LCSB consumption were nonsignificant. This could suggest that beverage consumption may play less of a role in the development of dyslipidemia in this younger, lower‐risk cohort (Table S5), but could also reflect the lower power attributable to smaller number of cases and less follow‐up time in the GEN3 cohort. No significant interactions were observed between beverage intakes and sex or BMI in either cohort. Similar results were observed in sensitivity analyses removing individuals with diabetes mellitus, when food groups were substituted for the 2015 DGAI, and when WC was replaced with BMI.
Figure 2.
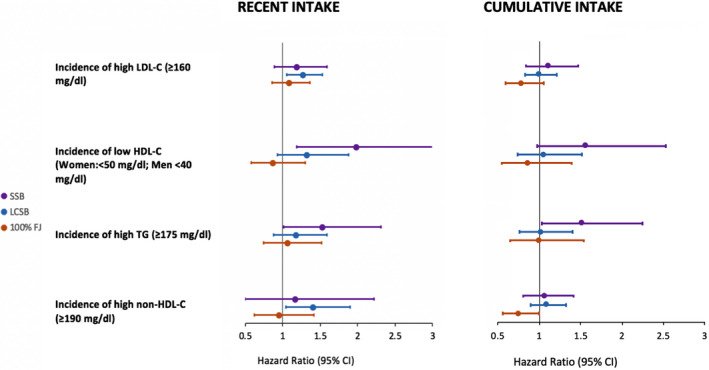
Hazard ratios for development of dyslipidemia among the highest beverage consumers (>1 serving per day) compared with the lowest beverage consumers (<1 serving per month) indicated by recent beverage consumption vs cumulative average of beverage consumption among the Framingham Offspring Study cohort. Participants were followed for a mean of 12.5 years and were free of dyslipidemia at baseline (according to each definition). Thus, maximum sample sizes and case numbers were as follows: low‐density lipoprotein cholesterol (LDL‐C) (n=2161; 961 cases), high‐density lipoprotein cholesterol (HDL‐C) (n=1703; 319 cases), triglyceride (TG) (n=2116; 457 cases), and non–HDL‐C (n=2205; 975 cases). We defined “recent” beverage intake as intake one examination before development of dyslipidemia and “cumulative” beverage intake as the average beverage intake during the period before development of dyslipidemia. All hazard ratios are adjusted for age, sex, total energy, education, current smoking status, current diabetes mellitus status, physical activity index, waist circumference, alcohol intake, percent energy from saturated fat, and servings per day of vegetables, whole fruits, 100% fruit juice, whole grains, nuts/seeds, and seafood. Horizontal bars indicate 95% CIs. FJ indicates fruit juice; LCSB; low‐calorie sweetened beverage; SSB, sugar‐sweetened beverage.
Discussion
In this population‐based, prospective cohort study among US adults, greater consumption of SSB was associated with adverse changes in lipid concentrations over time and development of dyslipidemia. Consumption of SSB was adversely associated with mean 4‐year changes in HDL‐C and triglyceride concentrations, along with increased incidence of low HDL‐C and high triglyceride. Mixed results were observed for LCSB consumption, where cumulative LCSB consumption was not significantly associated with development of dyslipidemia, but we observed some adverse changes in lipoprotein concentrations with recent consumption of LCSB. FJ consumption was not significantly associated with the development of dyslipidemia.
Several cross‐sectional studies have observed that higher SSB consumption is associated with lower HDL‐C concentrations and higher triglyceride concentrations.13, 15, 16 In the only other prospective analysis conducted to date among adults, a higher incidence of hypertriglyceridemia and low HDL‐C concentrations among adults with higher soft drink consumption (SSB+LCSB) was seen in the FOS cohort during a follow‐up period of about 4 years.17 Our study strengthens this evidence base by providing prospective data that SSB alone is associated with 4‐year changes in triglyceride and HDL‐C concentrations, along with the incidence of dyslipidemia during up to 23 years of follow‐up (mean of 12.5 years). These results also agree with findings from shorter prospective studies among children and young adults that observed an association between higher SSB intake and adverse changes in triglyceride and HDL‐C concentrations.34, 35, 36 Animal and human intervention trials corroborate these observational studies and provide evidence that SSBs may influence lipid concentrations.9, 10, 11, 37
We also assessed the association of LCSB consumption and changes in lipoprotein concentrations and development of dyslipidemia. We found that recent LCSB consumption, but not cumulative consumption, was associated with an increased incidence of dyslipidemias related to LDL‐C and non–HDL‐C, where the latter results are consistent with the null associations observed between LCSB intake and 4‐year changes in LDL‐C and non–HDL‐C concentrations described above. We also observed a modestly larger mean decrease in HDL‐C among the highest LCSB consumers compared with the lowest consumers. These findings are consistent with several cross‐sectional and short‐term randomized control trials that indicate mixed results when examining the association between LCSB intake and lipoprotein concentrations.15, 38, 39, 40 A recent meta‐analysis of observational studies concluded that LCSB intake was associated with increased risk of metabolic syndrome and cardiovascular events.21 The potential explanation for these conflicting results is reverse causality, as reported by others,38, 41, 42 given that higher consumers of LCSBs may choose to consume these products because they are at a higher risk for disease and switch from SSB to LCSB consumers.38, 42 Additional data examining the joint association of SSB and LCSB consumption in the current study indicate that the association between SSB consumption and mean 4‐year changes in triglyceride and HDL‐C concentrations is not dependent on LCSB consumption, further supporting the notion that LCSB consumption is not associated with mean changes in lipoprotein concentrations in our data. Thus, the significant association observed between LCSB consumption and incident high non–HDL‐C and LDL‐C, only observed among recent consumers, is most likely more influenced by reverse causality than LCSB intakes. Because our analysis was limited to examining the relationship between LCSB intake and lipoprotein concentrations and recent research has shown alterations in the gut microbiota and changes in taste preferences20 with consumption of low‐calorie sweeteners, further consideration of the health effects of LCSB is warranted.
The results from our study did not identify a significant relationship between FJ consumption and the risk of dyslipidemia among adults. However, the direction of the association between cumulative FJ consumption and incident dyslipidemia related to non–HDL‐C suggests potential risk reduction among the highest consumers compared with the lowest consumers. This is in contrast to prior work that has identified both positive and negative associations between FJ consumption and risk for cardiometabolic diseases43, 44, 45, 46, 47, 48 and changes in plasma lipoprotein concentrations.49, 50, 51 Dietary patterns high in FJ consumption may be more likely to associate with positive dietary behaviors than dietary patterns high in SSB consumption,52 which underscores the importance of considering potential residual confounding in interpretation. Additionally, FJs may contain other beneficial nutrients not contained in SSBs or the way people consume FJs may differ from that of SSB (whether it is consumed with meals or not and/or time of consumption). These factors may mitigate potential adverse effects of sugar from FJ on lipids and other cardiometabolic outcomes. Similar to other observations,23 further research is needed to identify the potential mechanisms by which FJs and SSBs may alter intermediate markers and health outcomes.
Study Limitations
As with all research designs, the proposed study has limitations. The use of self‐reported dietary data from a FFQ to infer dietary intakes could potentially lead to misclassification of food and nutrient intakes. While FFQs are able to provide rough estimates of absolute dietary intakes, they are more suited to ranking individuals on relative dietary intakes. Thus, in this study, we categorized individuals based on estimates of beverage consumption. These FFQs did not include an exhaustive list of all potential sources of SSBs, such as consumption of presweetened coffee/tea. Thus, we are not able to capture added sugar intake from these sources in our study. Individuals diagnosed as having high plasma cholesterol concentrations may be advised to change their diet in order to help improve lipid profiles. Thus, this potential reverse causality makes it difficult to infer underlying mechanisms based on results from this study. Even for longitudinal analyses in prospective cohort studies adjusting for a variety of potential demographic, lifestyle, and dietary confounding factors, residual confounding cannot be ruled out. Long‐term, randomized controlled intervention studies would be necessary to infer causal mechanisms for how differing beverage consumption patterns might be influencing plasma lipoprotein concentrations. Our assessment of socioeconomic status is limited by our ability to only adjust for education, and not income, which could potentially result in incomplete adjustment for socioeconomic status. Our findings are only generalizable to adults of European descent who are middle‐aged or older. It is possible that our findings may be biased because of the differences in age and health status between participants who were excluded from the analyses and those who remained in the study.
Study Strengths
The strengths of the present study include its large sample size, repeated assessments of dietary intakes and covariates, long follow‐up period, and prospective design. High‐quality observational studies are necessary to inform whether it would be cost‐effective to conduct a long‐term randomized controlled trial. We were able to account for important lifestyle variables that could confound the association between beverage consumption and lipids such as overall diet quality, physical activity, and alcohol intake. We have also used 2 different types of longitudinal analyses in this study. Because models for the development of dyslipidemia may be biased by reverse causality, the ability to additionally assess the change in lipoprotein concentrations in a larger subset of individuals by beverage consumption category strengthens our findings. Few studies directly compare the health effects of both FJs and LCSBs to those of SSBs, and this comparison can be useful when making recommendations for changes in dietary patterns.
Conclusions
Our findings suggest that SSB consumption is associated with dyslipidemias related to low HDL‐C and high triglyceride concentrations. Cumulative LCSB consumption was not associated with risk of dyslipidemia nor was intake of FJ up to 1.5 servings per day. These findings are consistent with current recommendations to limit SSB consumption and emphasize the need for further research to inform recommendations related to LCSB and FJ consumption.
Sources of Funding
This work is supported by National Institutes of Health (NIH) 5T32HL069772‐15 and NIH 2T32CA009001‐39 (Haslam), American Heart Association 16CSA28590003 (Haslam, McKeown, and Herman), NIH R01DK100425 (Herman) and K08 HL112845 (Smith), and USDA ARS agreement No. 58‐1950‐4‐003 (McKeown) and 588‐1950‐9‐001 (Lichtenstein). From the Framingham Heart Study of the National Heart Lung and Blood Institute of the National Institutes of Health and Boston University School of Medicine. This project has been funded in whole or in part with Federal funds from the National Heart, Lung, and Blood Institute, National Institutes of Health, Department of Health and Human Services, under Contract No. 75N92019D00031.
Disclosures
None.
Supporting information
Table S1. Mean Difference in 4‐Year Changes in Lipid Traits Across Beverage Consumption Groups by Cohort*
Table S2. Difference in 4‐Year Changes in Lipid Traits by SSB and LCSB Category*
Table S3. HRs (95% CIs) for Incident Dyslipidemia According to Recent Beverage Consumption Category (Framingham Offspring Study Cohort)*
Table S4. HRs (95% CIs) for Incident Dyslipidemia According to Cumulative Beverage Consumption Category (Framingham Offspring Study Cohort)*
Table S5. HRs (95% CIs) for Incident Dyslipidemia According to Recent Beverage Consumption Category (Framingham Generation 3 Cohort)*
Acknowledgments
Author contributions: The authors’ responsibilities were as follows: Haslam, Peloso, Dupuis, Herman, and McKeown: designed research; Haslam, Peloso, Herman, Dupuis, Lichtenstein, Smith, and McKeown: conducted research. Haslam, Peloso, Dupuis, and McKeown: performed statistical analyses; Haslam: wrote the article; Haslam, Peloso, and McKeown had primary responsibility for final content. All authors read and approved the final version of the article.
(J Am Heart Assoc. 2020;9:e014083 DOI: 10.1161/JAHA.119.014083.)
This study was presented as an abstract at Nutrition 2019, June 8‐11, 2019, in Baltimore, MD.
References
- 1. Saydah S, Bullard KM, Cheng Y, Ali MK, Gregg EW, Geiss L, Imperatore G. Trends in cardiovascular disease risk factors by obesity level in adults in the United States, NHANES 1999–2010. Obesity. 2014;22:1888–1895. [DOI] [PMC free article] [PubMed] [Google Scholar]
- 2. Wilson Peter WF, D'Agostino Ralph B, Levy D, Belanger Albert M, Silbershatz H, Kannel WB. Prediction of coronary heart disease using risk factor categories. Circulation. 1998;97:1837–1847. [DOI] [PubMed] [Google Scholar]
- 3. Nelson RH. Hyperlipidemia as a risk factor for cardiovascular disease. Prim Care. 2013;40:195–211. [DOI] [PMC free article] [PubMed] [Google Scholar]
- 4. Grundy SM, Stone NJ, Bailey AL, Beam C, Birtcher KK, Blumenthal RS, Braun LT, de Ferranti S, Faiella‐Tommasino J, Forman DE, Goldberg R, Heidenreich PA, Hlatky MA, Jones DW, Lloyd‐Jones D, Lopez‐Pajares N, Ndumele CE, Orringer CE, Peralta CA, Saseen JJ, Smith SC Jr, Sperling L, Virani SS, Yeboah J. 2018 AHA/ACC/AACVPR/AAPA/ABC/ACPM/ADA/AGS/APhA/ASPC/NLA/PCNA Guideline on the Management of Blood Cholesterol Circulation 2019;139:e1082–e1143. [DOI] [PMC free article] [PubMed] [Google Scholar]
- 5. Yang Q, Zhang Z, Gregg EW, Flanders WD, Merritt R, Hu FB. Added sugar intake and cardiovascular diseases mortality among us adults. JAMA Intern Med. 2014;174:516–524. [DOI] [PMC free article] [PubMed] [Google Scholar]
- 6. Johnson RK, Appel LJ, Brands M, Howard BV, Lefevre M, Lustig RH, Sacks F, Steffen LM, Wylie‐Rosett J. Dietary sugars intake and cardiovascular health. Circulation. 2009;120:1011–1020. [DOI] [PubMed] [Google Scholar]
- 7. Malik VS. Sugar sweetened beverages and cardiometabolic health. Curr Opin Cardiol. 2017;32:572–579. [DOI] [PubMed] [Google Scholar]
- 8. Rosinger A, Herrick K, Gahche J, Park S. Sugar‐Sweetened Beverage Consumption Among U.S. Adults, 2011–2014. NCHS data brief, no 270. Hyattsville, MD: National Center for Health Statistics; 2017. [Google Scholar]
- 9. Herman MA, Samuel VT. The sweet path to metabolic demise: fructose and lipid synthesis. Trends Endocrinol Metab. 2016;27:719–730. [DOI] [PMC free article] [PubMed] [Google Scholar]
- 10. Malik VS, Hu FB. Fructose and cardiometabolic health: what the evidence from sugar‐sweetened beverages tells US. J Am Coll Cardiol. 2015;66:1615–1624. [DOI] [PMC free article] [PubMed] [Google Scholar]
- 11. Hannou SA, Haslam DE, McKeown NM, Herman MA. Fructose metabolism and metabolic disease. J Clin Invest. 2018;128:545–555. [DOI] [PMC free article] [PubMed] [Google Scholar]
- 12. Welsh JA, Sharma A, Cunningham SA, Vos MB. Consumption of added sugars and indicators of cardiovascular disease risk among US adolescents. Circulation. 2011;123:249–257. [DOI] [PMC free article] [PubMed] [Google Scholar]
- 13. Hert KA, Fisk PS II, Rhee YS, Brunt AR. Decreased consumption of sugar‐sweetened beverages improved selected biomarkers of chronic disease risk among US adults: 1999 to 2010. Nutr Res. 2014;34:58–65. [DOI] [PubMed] [Google Scholar]
- 14. Welsh JA, Sharma A, Abramson JL, Vaccarino V, Gillespie C, Vos MB. Caloric sweetener consumption and dyslipidemia among US adults. JAMA. 2010;303:1490–1497. [DOI] [PMC free article] [PubMed] [Google Scholar]
- 15. de Koning L, Malik VS, Kellogg MD, Rimm EB, Willett WC, Hu FB. Sweetened beverage consumption, incident coronary heart disease, and biomarkers of risk in men. Circulation. 2012;125:1735–1741. [DOI] [PMC free article] [PubMed] [Google Scholar]
- 16. Yu Z, Ley SH, Sun Q, Hu FB, Malik VS. Cross‐sectional association between sugar‐sweetened beverage intake and cardiometabolic biomarkers in US women. Br J Nutr. 2018;119:570–580. [DOI] [PMC free article] [PubMed] [Google Scholar]
- 17. Dhingra R, Sullivan L, Jacques PF, Wang TJ, Fox CS, Meigs JB, D'Agostino RB, Gaziano JM, Vasan RS. Soft drink consumption and risk of developing cardiometabolic risk factors and the metabolic syndrome in middle‐aged adults in the community. Circulation. 2007;116:480–488. [DOI] [PubMed] [Google Scholar]
- 18. Mattes RD, Popkin BM. Nonnutritive sweetener consumption in humans: effects on appetite and food intake and their putative mechanisms. Am J Clin Nutr. 2009;89:1–14. [DOI] [PMC free article] [PubMed] [Google Scholar]
- 19. Munsell CR, Harris JL, Sarda V, Schwartz MB. Parents’ beliefs about the healthfulness of sugary drink options: opportunities to address misperceptions. Public Health Nutr. 2016;19:46–54. [DOI] [PMC free article] [PubMed] [Google Scholar]
- 20. Sylvetsky AC, Rother KI. Non‐nutritive sweeteners in weight management and chronic disease: a review. Obesity (Silver Spring). 2018;26:635–640. [DOI] [PMC free article] [PubMed] [Google Scholar]
- 21. Azad MB, Abou‐Setta AM, Chauhan BF, Rabbani R, Lys J, Copstein L, Mann A, Jeyaraman MM, Reid AE, Fiander M, MacKay DS, McGavock J, Wicklow B, Zarychanski R. Nonnutritive sweeteners and cardiometabolic health: a systematic review and meta‐analysis of randomized controlled trials and prospective cohort studies. Can Med Assoc J. 2017;189:E929–E939. [DOI] [PMC free article] [PubMed] [Google Scholar]
- 22. Auerbach BJ, Dibey S, Vallila‐Buchman P, Kratz M, Krieger J. Review of 100% fruit juice and chronic health conditions: implications for sugar‐sweetened beverage policy. Adv Nutr. 2018;9:78–85. [DOI] [PMC free article] [PubMed] [Google Scholar]
- 23. Guasch‐Ferré M, Hu FB. Are Fruit Juices Just As Unhealthy As Sugar‐Sweetened Beverages? JAMA Netw Open. 2019;2:e193109. [DOI] [PubMed] [Google Scholar]
- 24. Kannel WB, Feinleib M, McNamara PM, Garrison RJ, Castelli WP. An investigation of coronary heart disease in familiesthe Framingham offspring study. Am J Epidemiol. 1979;110:281–290. [DOI] [PubMed] [Google Scholar]
- 25. Splansky GL, Corey D, Yang Q, Atwood LD, Cupples LA, Benjamin EJ, D'Agostino RB, Fox CS, Larson MG, Murabito JM, O'Donnell CJ, Vasan RS, Wolf PA, Levy D. The third generation cohort of the National Heart, Lung, and Blood Institute's Framingham Heart Study: design, recruitment, and initial examination. Am J Epidemiol. 2007;165:1328–1335. [DOI] [PubMed] [Google Scholar]
- 26. Friedewald WT, Levy RI, Fredrickson DS. Estimation of the concentration of low‐density lipoprotein cholesterol in plasma, without use of the preparative ultracentrifuge. Clin Chem. 1972;18:499–502. [PubMed] [Google Scholar]
- 27. Ingelsson E, Schaefer EJ, Contois JH, McNamara JR, Sullivan L, Keyes MJ, Pencina MJ, Schoonmaker C, Wilson PW, D'Agostino RB, Vasan RS. Clinical utility of different lipid measures for prediction of coronary heart disease in men and women. JAMA. 2007;298:776–785. [DOI] [PubMed] [Google Scholar]
- 28. Ridker PM, Rifai N, Cook NR, Bradwin G, Buring JE. Non–HDL cholesterol, apolipoproteins A‐I and B100, standard lipid measures, lipid ratios, and CRP as risk factors for cardiovascular disease in women. JAMA. 2005;294:326–333. [DOI] [PubMed] [Google Scholar]
- 29. Rimm EB, Giovannucci EL, Stampfer MJ, Colditz GA, Litin LB, Willett WC. Reproducibility and validity of an expanded self‐administered semiquantitative food frequency questionnaire among male health professionals. Am J Epidemiol. 1992;135:1114–1126; discussion 1127–1136. [DOI] [PubMed] [Google Scholar]
- 30. Feskanich D, Rimm EB, Giovannucci EL, Colditz GA, Stampfer MJ, Litin LB, Willett WC. Reproducibility and validity of food intake measurements from a semiquantitative food frequency questionnaire. J Am Diet Assoc. 1993;93:790–796. [DOI] [PubMed] [Google Scholar]
- 31. Kannel WB, Sorlie P. Some health benefits of physical activity: the Framingham Study. Arch Intern Med. 1979;139:857–861. [PubMed] [Google Scholar]
- 32. Jessri M, Lou WY, L'Abbé MR. The 2015 Dietary Guidelines for Americans is associated with a more nutrient‐dense diet and a lower risk of obesity. Am J Clin Nutr. 2016;104:1378–1392. [DOI] [PubMed] [Google Scholar]
- 33. Qi Q, Chu AY, Kang JH, Jensen MK, Curhan GC, Pasquale LR, Ridker PM, Hunter DJ, Willett WC, Rimm EB, Chasman DI, Hu FB, Qi L. Sugar‐sweetened beverages and genetic risk of obesity. N Engl J Med. 2012;367:1387–1396. [DOI] [PMC free article] [PubMed] [Google Scholar]
- 34. Van Rompay MI, McKeown NM, Goodman E, Eliasziw M, Chomitz VR, Gordon CM, Economos CD, Sacheck JM. Sugar‐sweetened beverage intake is positively associated with baseline triglyceride concentrations, and changes in intake are inversely associated with changes in HDL cholesterol over 12 months in a multi‐ethnic sample of children123. J Nutr. 2015;145:2389–2395. [DOI] [PMC free article] [PubMed] [Google Scholar]
- 35. Ambrosini GL, Oddy WH, Huang RC, Mori TA, Beilin LJ, Jebb SA. Prospective associations between sugar‐sweetened beverage intakes and cardiometabolic risk factors in adolescents. Am J Clin Nutr. 2013;98:327–334. [DOI] [PMC free article] [PubMed] [Google Scholar]
- 36. Duffey KJ, Gordon‐Larsen P, Steffen LM, Jacobs DR, Popkin BM. Drinking caloric beverages increases the risk of adverse cardiometabolic outcomes in the Coronary Artery Risk Development in Young Adults (CARDIA) Study. Am J Clin Nutr. 2010;92:954–959. [DOI] [PMC free article] [PubMed] [Google Scholar]
- 37. Morenga LAT, Howatson AJ, Jones RM, Mann J. Dietary sugars and cardiometabolic risk: systematic review and meta‐analyses of randomized controlled trials of the effects on blood pressure and lipids. Am J Clin Nutr. 2014;100:65–79. [DOI] [PubMed] [Google Scholar]
- 38. Pereira MA. Diet beverages and the risk of obesity, diabetes, and cardiovascular disease: a review of the evidence. Nutr Rev. 2013;71:433–440. [DOI] [PubMed] [Google Scholar]
- 39. Ferreira‐Pêgo C, Babio N, Bes‐Rastrollo M, Corella D, Estruch R, Ros E, Fitó M, Serra‐Majem L, Arós F, Fiol M, Santos‐Lozano JM, Muñoz‐Bravo C, Pintó X, Ruiz‐Canela M, Salas‐Salvadó J. Frequent consumption of sugar‐ and artificially sweetened beverages and natural and bottled fruit juices is associated with an increased risk of metabolic syndrome in a mediterranean population at high cardiovascular disease risk. J Nutr. 2016;146:1528–1536. [DOI] [PubMed] [Google Scholar]
- 40. Patel L, Alicandro G, La Vecchia C. Low‐calorie beverage consumption, diet quality and cardiometabolic risk factors in british adults. Nutrients. 2018;10:E1261. [DOI] [PMC free article] [PubMed] [Google Scholar]
- 41. Malik Vasanti S, Li Y, Pan A, De Koning L, Schernhammer E, Willett Walter C, Hu Frank B. Long‐term consumption of sugar‐sweetened and artificially sweetened beverages and risk of mortality in US adults. Circulation. 2019;139:2113–2125. [DOI] [PMC free article] [PubMed] [Google Scholar]
- 42. Sievenpiper JL, Khan TA, Ha V, Viguiliouk E, Auyeung R. The importance of study design in the assessment of nonnutritive sweeteners and cardiometabolic health. Can Med Assoc J. 2017;189:E1424–E1425. [DOI] [PMC free article] [PubMed] [Google Scholar]
- 43. Imamura F, O'Connor L, Ye Z, Mursu J, Hayashino Y, Bhupathiraju SN, Forouhi NG. Consumption of sugar sweetened beverages, artificially sweetened beverages, and fruit juice and incidence of type 2 diabetes: systematic review, meta‐analysis, and estimation of population attributable fraction. BMJ. 2015;351:h2376. [DOI] [PMC free article] [PubMed] [Google Scholar]
- 44. O'Connor L, Imamura F, Brage S, Griffin SJ, Wareham NJ, Forouhi NG. Intakes and sources of dietary sugars and their association with metabolic and inflammatory markers. Clin Nutr Edinb Scotl. 2018;37:1313–1322. [DOI] [PMC free article] [PubMed] [Google Scholar]
- 45. Mattei J, Malik V, Hu FB, Campos H. Substituting homemade fruit juice for sugar‐sweetened beverages is associated with lower odds of metabolic syndrome among hispanic adults123. J Nutr. 2012;142:1081–1087. [DOI] [PMC free article] [PubMed] [Google Scholar]
- 46. O'Neil CE, Nicklas TA, Zanovec M, Kleinman RE, Fulgoni VL. Fruit juice consumption is associated with improved nutrient adequacy in children and adolescents: the National Health and Nutrition Examination Survey (NHANES) 2003–2006. Public Health Nutr. 2012;15:1871–1878. [DOI] [PubMed] [Google Scholar]
- 47. Hansen L, Dragsted LO, Olsen A, Christensen J, Tjønneland A, Schmidt EB, Overvad K. Fruit and vegetable intake and risk of acute coronary syndrome. Br J Nutr. 2010;104:248–255. [DOI] [PubMed] [Google Scholar]
- 48. Auerbach BJ, Littman AJ, Tinker L, Larson J, Krieger J, Young B, Neuhouser M. Associations of 100% fruit juice versus whole fruit with hypertension and diabetes risk in postmenopausal women: results from the Women's Health Initiative. Prev Med. 2017;105:212–218. [DOI] [PMC free article] [PubMed] [Google Scholar]
- 49. Gorinstein S, Caspi A, Libman I, Katrich E, Lerner HT, Trakhtenberg S. Fresh Israeli Jaffa sweetie juice consumption improves lipid metabolism and increases antioxidant capacity in hypercholesterolemic patients suffering from coronary artery disease: studies in vitro and in humans and positive changes in albumin and fibrinogen fractions. J Agric Food Chem. 2004;52:5215–5222. [DOI] [PubMed] [Google Scholar]
- 50. Kurowska EM, Spence JD, Jordan J, Wetmore S, Freeman DJ, Piché LA, Serratore P. HDL‐cholesterol‐raising effect of orange juice in subjects with hypercholesterolemia. Am J Clin Nutr. 2000;72:1095–1100. [DOI] [PubMed] [Google Scholar]
- 51. Aviram M, Dornfeld L, Kaplan M, Coleman R, Gaitini D, Nitecki S, Hofman A, Rosenblat M, Volkova N, Presser D, Attias J, Hayek T, Fuhrman B. Pomegranate juice flavonoids inhibit low‐density lipoprotein oxidation and cardiovascular diseases: studies in atherosclerotic mice and in humans. Drugs Exp Clin Res. 2002;28:49–62. [PubMed] [Google Scholar]
- 52. O'Neil CE, Nicklas TA, Zanovec M, Fulgoni VL. Diet quality is positively associated with 100% fruit juice consumption in children and adults in the United States: NHANES 2003–2006. Nutr J. 2011;10:17. [DOI] [PMC free article] [PubMed] [Google Scholar]
Associated Data
This section collects any data citations, data availability statements, or supplementary materials included in this article.
Supplementary Materials
Table S1. Mean Difference in 4‐Year Changes in Lipid Traits Across Beverage Consumption Groups by Cohort*
Table S2. Difference in 4‐Year Changes in Lipid Traits by SSB and LCSB Category*
Table S3. HRs (95% CIs) for Incident Dyslipidemia According to Recent Beverage Consumption Category (Framingham Offspring Study Cohort)*
Table S4. HRs (95% CIs) for Incident Dyslipidemia According to Cumulative Beverage Consumption Category (Framingham Offspring Study Cohort)*
Table S5. HRs (95% CIs) for Incident Dyslipidemia According to Recent Beverage Consumption Category (Framingham Generation 3 Cohort)*