

Abstract
Materials with short-wave infrared (SWIR) emission are promising contrast agents for in vivo animal imaging, providing high-contrast and high-resolution images of blood vessels in deep tissues. However, SWIR emitters have not been developed as molecular labels for microscopy applications in the life sciences, which require optimized probes that are bright, stable, and small. Here, we design and synthesize semiconductor quantum dots (QDs) with SWIR emission based on HgxCd1−xSe alloy cores red shifted to the SWIR by epitaxial deposition of thin HgxCd1−xS shells with a small band gap. By tuning alloy composition alone, the emission can be shifted across the visible-to-SWIR (VIR) spectra while maintaining a small and equal size, allowing direct comparisons of molecular labeling performance across a broad range of wavelength. After coating with click-functional multidentate polymers, the VIR-QD spectral series has high quantum yield in the SWIR (14–33%), compact size (13 nm hydrodynamic diameter), and long-term stability in aqueous media during continuous excitation. We show that these properties enable diverse applications of SWIR molecular probes for fluorescence microscopy using conjugates of antibodies, growth factors, and nucleic acids. A broadly useful outcome is a 10–55-fold enhancement of the signal-to-background ratio at both the single-molecule level and the ensemble level in the SWIR relative to visible wavelengths, primarily due to drastically reduced autofluorescence. We anticipate that VIR-QDs with SWIR emission will enable ultrasensitive molecular imaging of low-copy number analytes in biospecimens with high autofluorescence.
INTRODUCTION
Fluorescent probes are used throughput the biomedical sciences to detect, image, and track molecules in cells and tissues.1–5 When labeling proteins and nucleic acids in fixed samples, small organic dyes are the most commonly used probes,6–8 whereas transgenic fluorescent proteins are most often used in live-cell applications to monitor dynamic molecular events.1,9 Light-emitting nanoparticles such as semiconductor quantum dots (QDs) have also become popular for many research-based applications due to their broad wavelength tunability and unique combination of intense and stable emission that allows long-term tracking of individual molecules.10–12 Over the past decade, advances in fluorescent probes, together with new instrumentation and computational techniques, have enabled rapid progress in microscopic molecular imaging, leading to super-resolution optical microscopy13–16 and single-molecule imaging17–19 that have both been widely adopted in cellular biology. However, a fundamental bottleneck is the intrinsic fluorescence from cellular components, which produces a baseline signal that obscures probe signals.20–22 This is especially problematic when using common dyes, when targets are low in copy number, and when using highly autofluorescent samples like fixed tissues. Creative workarounds have been developed using molecular amplification,23,24 multiphoton excitation,25 upconverting nanoparticles,26 time-gated imaging,27 and harsh sample treatments,28 but these are challenging to apply broadly. A broader solution is to simply use fluorophores that emit light beyond the visible spectrum (400–700 nm) at infrared wavelengths (>700 nm) where autofluorescence is reduced.20,29,30 However, as the emission of an organic dye or protein is shifted to the red, its quantum efficiency, aqueous solubility, and stability decrease, yielding diminishing returns for contrast.31–33
Recently, an assortment of nanomaterial-based fluorophores has been engineered to effciently emit light at wavelengths spanning two infrared spectral windows,33–56 typically denoted as the first near-infrared window (NIR-I, 700–950 nm) and the second near-infrared window (NIR-II, 950–2000 nm), with the latter also known as the short-wave infrared (SWIR). There is some variability in the literature over the nomenclature and spectral ranges of these windows, and it is noteworthy that the IUPAC defines the infrared A spectrum (IR-A) as 780–1400 nm. The NIR-I window has long been explored for biological imaging,57 facilitated by the ubiquitous availability of silicon-based detectors for high-sensitivity imaging up to ~950 nm, whereas affordable array sensors for the SWIR have only recently become available.58 The vast majority of studies to date exploring the SWIR window have focused on the enhanced penetration depth of SWIR photons through biological tissue deriving from reduced scattering. Compared with images collected at shorter wavelengths, SWIR images of thick tissues exhibit higher resolution and higher contrast, with particularly impressive outcomes for optical vascular imaging in living animals.33–49 The diversity of SWIR-emitting nanomaterials is rapidly expanding and now includes carbon nanotubes, rare-earth-doped nanocrystals, and semiconductor QDs composed of InAs, PbS, PbSe, Ag2S, Ag2Se, Cd3P2, CuInSe2, and HgCdTe.47–56
In this report, we demonstrate the utility of SWIR fluorophores as molecular labels for microscopy-based imaging of proteins and nucleic acids in cells and tissues. These applications are unlike those in vascular imaging for which diverse probe sizes and structures can be applied with contrast tuned simply by dose. For accurate molecular labeling, there are stringent criteria for probe physical dimensions, photon flux, and stability in oxidizing conditions, while outcomes are fundamentally limited by the molecular copy number, which can span many orders of magnitude.59 In particular, probes must have hydrodynamic diameters smaller than ~15 nm to access crowded cellular regions such as the neuronal synapse60 and to access cytoplasmic RNA,61 and must exhibit minimal nonspecific interactions with biological matter. For a nanoparticle, the hydrodynamic diameter is a product of the size of the particle core, its coating layers, and adsorbed ions and solvent molecules. For molecular probes based on QDs, it has not been possible to achieve suitably compact sizes in the SWIR spectrum in part because of the quantum confinement effect, which requires an increase in core size to reach longer emission wavelengths.62,63 Furthermore, for the coating, there is a trade-off between hydrodynamic thickness and stability.59
To develop SWIR probes for fluorescence microscopy, we designed and developed a new class of compact QDs based on a 3-domain alloy structure that exhibits continuous spectral tunability across the visible, NIR-I, and SWIR (a spectral range collectively termed VIR) with high quantum yields (QYs) without changing the nanocrystal size. A central aspect of the design is the sole use of II–VI semiconductor compounds to be fully compatible with the mature shelling processes that are standard for advanced QD designs in the visible spectrum and responsible for high brightness and photochemical stability in aqueous media.59,64 The nanocrystals are compatible with multidentate coating technologies that yield compact sizes, long-term colloidal stability, monodispersity, minimal nonspecific binding, and click-chemistry functionalization.65 We show that VIR-QDs can be applied for advanced high-resolution cell and tissue imaging applications that require ultrasensitive detection down to the level of single molecules. We evaluate their use for applications in single-molecule growth factor imaging,29 in situ RNA imaging,61 and in situ immunolabeling of proteins.65 In all cases, when moving from the visible spectrum to the SWIR, signal-to-background ratios are amplified by 1–2 orders of magnitude owing to the large reduction in autofluorescence in the SWIR. This results in the ability to collect high-resolution molecular images of cells and tissues at shorter acquisition times and with fewer obscuring signals, which is particularly beneficial when imaging high-background biospecimens with low-target copy numbers. We further determined that VIR-QDs do not induce significant toxicity in living cells at high concentrations, even though the nanocrystals contain divalent cadmium and mercury. Although beyond the scope of this work, the stability, compact size, high brightness, and low toxicity of VIR-QDs suggest that these nanoparticles can also be used as contrast agents for rapidly developing efforts in in vivo imaging.
■ RESULTS AND DISCUSSION
SWIR Nanocrystal Design and Synthesis.
We designed a new class of QDs with fixed size and tunable emission from the visible to the SWIR based on 3-domain nanocrystals primarily composed of mercury cadmium chalcogenide alloys (HgxCd1−xSe or HgxCd1−xS). Our goal was to maximize chemical and structural similarity to (core)shell (CdSe)CdxZn1−xS QDs; these are the workhorse materials of high-resolution single-molecule dynamic imaging due to a high QY approaching unity, high photostability, and stable hydrophilic coatings that minimize total size in aqueous solution.59 Figure 1a shows the processing steps to generate the 3-domain nanocrystal composed of (core)shell/shell (HgxCd1−xSe)HgyCd1−yS/CdzZn1−zS QDs. These materials are entirely within the II–VI family with tetrahedral bonding geometries that are structurally the same as those of 2-domain (CdSe)CdxZn1−xS QDs. For the first step, we applied a previously described cation exchange process53 in which zinc blende CdSe cores are mixed with certain mercury salts, resulting in a controllable optical red shift due to the formation of HgxCd1−xSe QDs, which shrinks the bulk band gap (Eg) as the alloy transitions between CdSe with Eg = +1.73 eV to HgSe with Eg = −0.22 eV.53 The alloying process does not change the QD size due to the near lattice match between HgSe and CdSe. These materials are processable with high-temperature liquid-phase epitaxy to allow growth of CdyZn1−yS shells, resulting in (HgxCd1−xSe)CdyZn1−yS QDs with emission wavelengths up to 800 nm and high QY after dispersion in aqueous solution with a variety of coatings.66 Theoretically, HgxCd1−xSe cores could emit at longer SWIR wavelengths through further cation exchange (higher x). However, in reality, the exchange effciency is kinetically limited and does not approach completion even with prolonged annealing in the presence of excess mercury. Higher temperatures (150 °C) do result in emission that extends to the SWIR; however, transmission electron microscopy (TEM) reveals that the particles are fused and aggregated and thus unsuitable for use as molecular probes (Figure S1).
Figure 1.
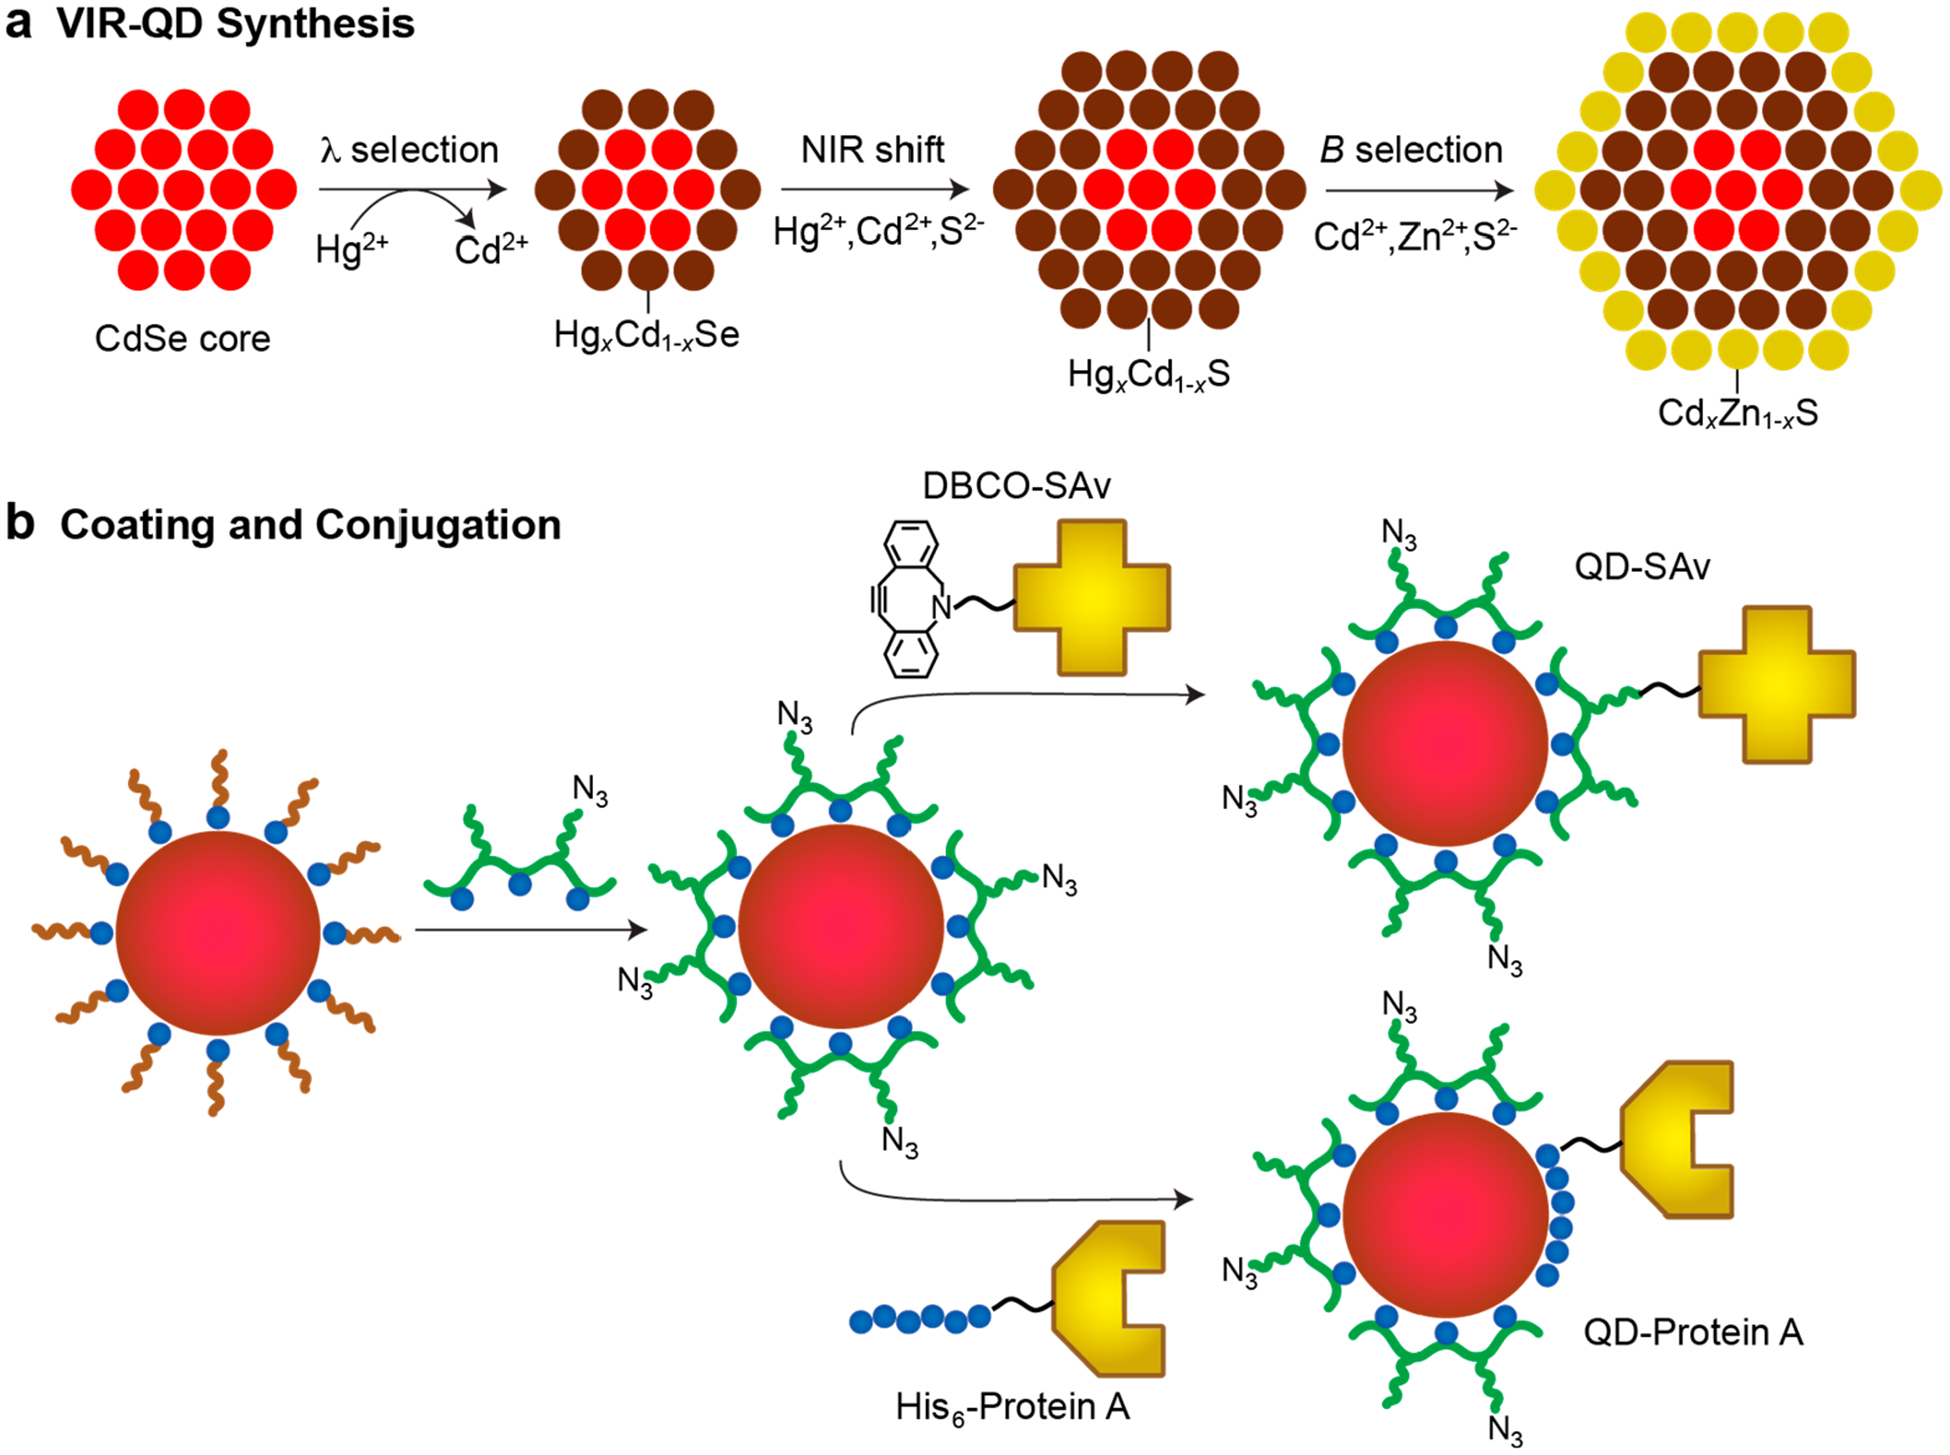
Schematic depiction of 3-domain quantum dots (QDs) with visible-to-infrared (VIR) emission and their synthesis as molecular probes. (a) Schematic depiction of the stepwise synthesis methodology for VIR-QD nanocrystals, comprising a mercury exchange process on CdSe cores to select the emission wavelength (λ), followed by epitaxial growth of a mercury cadmium sulfide shell to induce a further shift to the near-infrared (NIR), with a final epitaxial growth of an insulating cadmium zinc sulfide shell that boosts quantum yield and absorption coeffcient to select the desired brightness (B). (b) Schematic representation of VIR-QD surface coating with hydrophilic multidentate azide (N3) functional polymers, which replace native hydrophobic ligands. Resulting hydrophilic QDs can then be conjugated through click chemistry to streptavidin (SAv) modified with a dibenzylcyclooctyne (DBCO) linker or conjugated to Protein A through self-assembly mediated by a hexahistidine protein terminus.
We developed a new epitaxy-based shell growth process to further increase the mercury content in the HgxCd1−xSe nanocrystals and continuously red shift the band gap deep into the SWIR by deposition of submonolayer quantities of HgxCd1−xS. We previously were not able to adapt standard shell growth processes to generate mercury-based shells due to the high reactivity of mercury precursors that leads to both heterogeneous cation exchange and homogeneous nucleation (Figure S2).53,67,68 We overcame this limitation by optimizing the quantity of mercury precursor, its reactivity, and the reaction temperature. Using a simple temperature cycling process, HgxCd1−xS was epitaxially deposited using mercury octanethiolate with a red shift dictated by both the thickness and the mercury content in the shell. By controlling the mercury content in the HgxCd1−xSe core and the HgxCd1−xS shell together, the band gap can be widely and continuously tuned without substantially changing the nanocrystal size. With further overgrowth of a standard wide-band-gap CdxZn1−xS shell,64,69 electronic insulation results in stable emission with a high QY. By selecting core sizes smaller than 4 nm, the total crystalline size can be smaller than 6 nm, which is suitable for molecular labeling. The core size and shell thickness can also be independently tuned to select any combination of brightness (B), diameter, or wavelength (λ) based on previously described brightness tuning principles.66 As shown in Figure 1b, after synthesis, we exchanged the native aliphatic amine and carboxylate ligands with a monolayer of hydrophilic multidentate polymers for monodisperse stabilization in aqueous solution. These polymers contain mixed side chains, of which 65% are triethylene glycol (TEG) and 35% are imidazole (histamine). These polyacrylamido(histamine-co-TEG) polymers are called P-IM when TEG groups are entirely terminated with hydroxyls and called P-IM-N3 when 30% of the TEG groups are azide (N3) terminated. Azide functional groups allow effcient click chemistry conjugation to proteins and nucleic acids, while the QD surface itself also enables conjugation through self-assembly.65 Figure 1b depicts the conjugations to streptavidin (SAv) and Protein A used in this work.
Spectroscopic Properties.
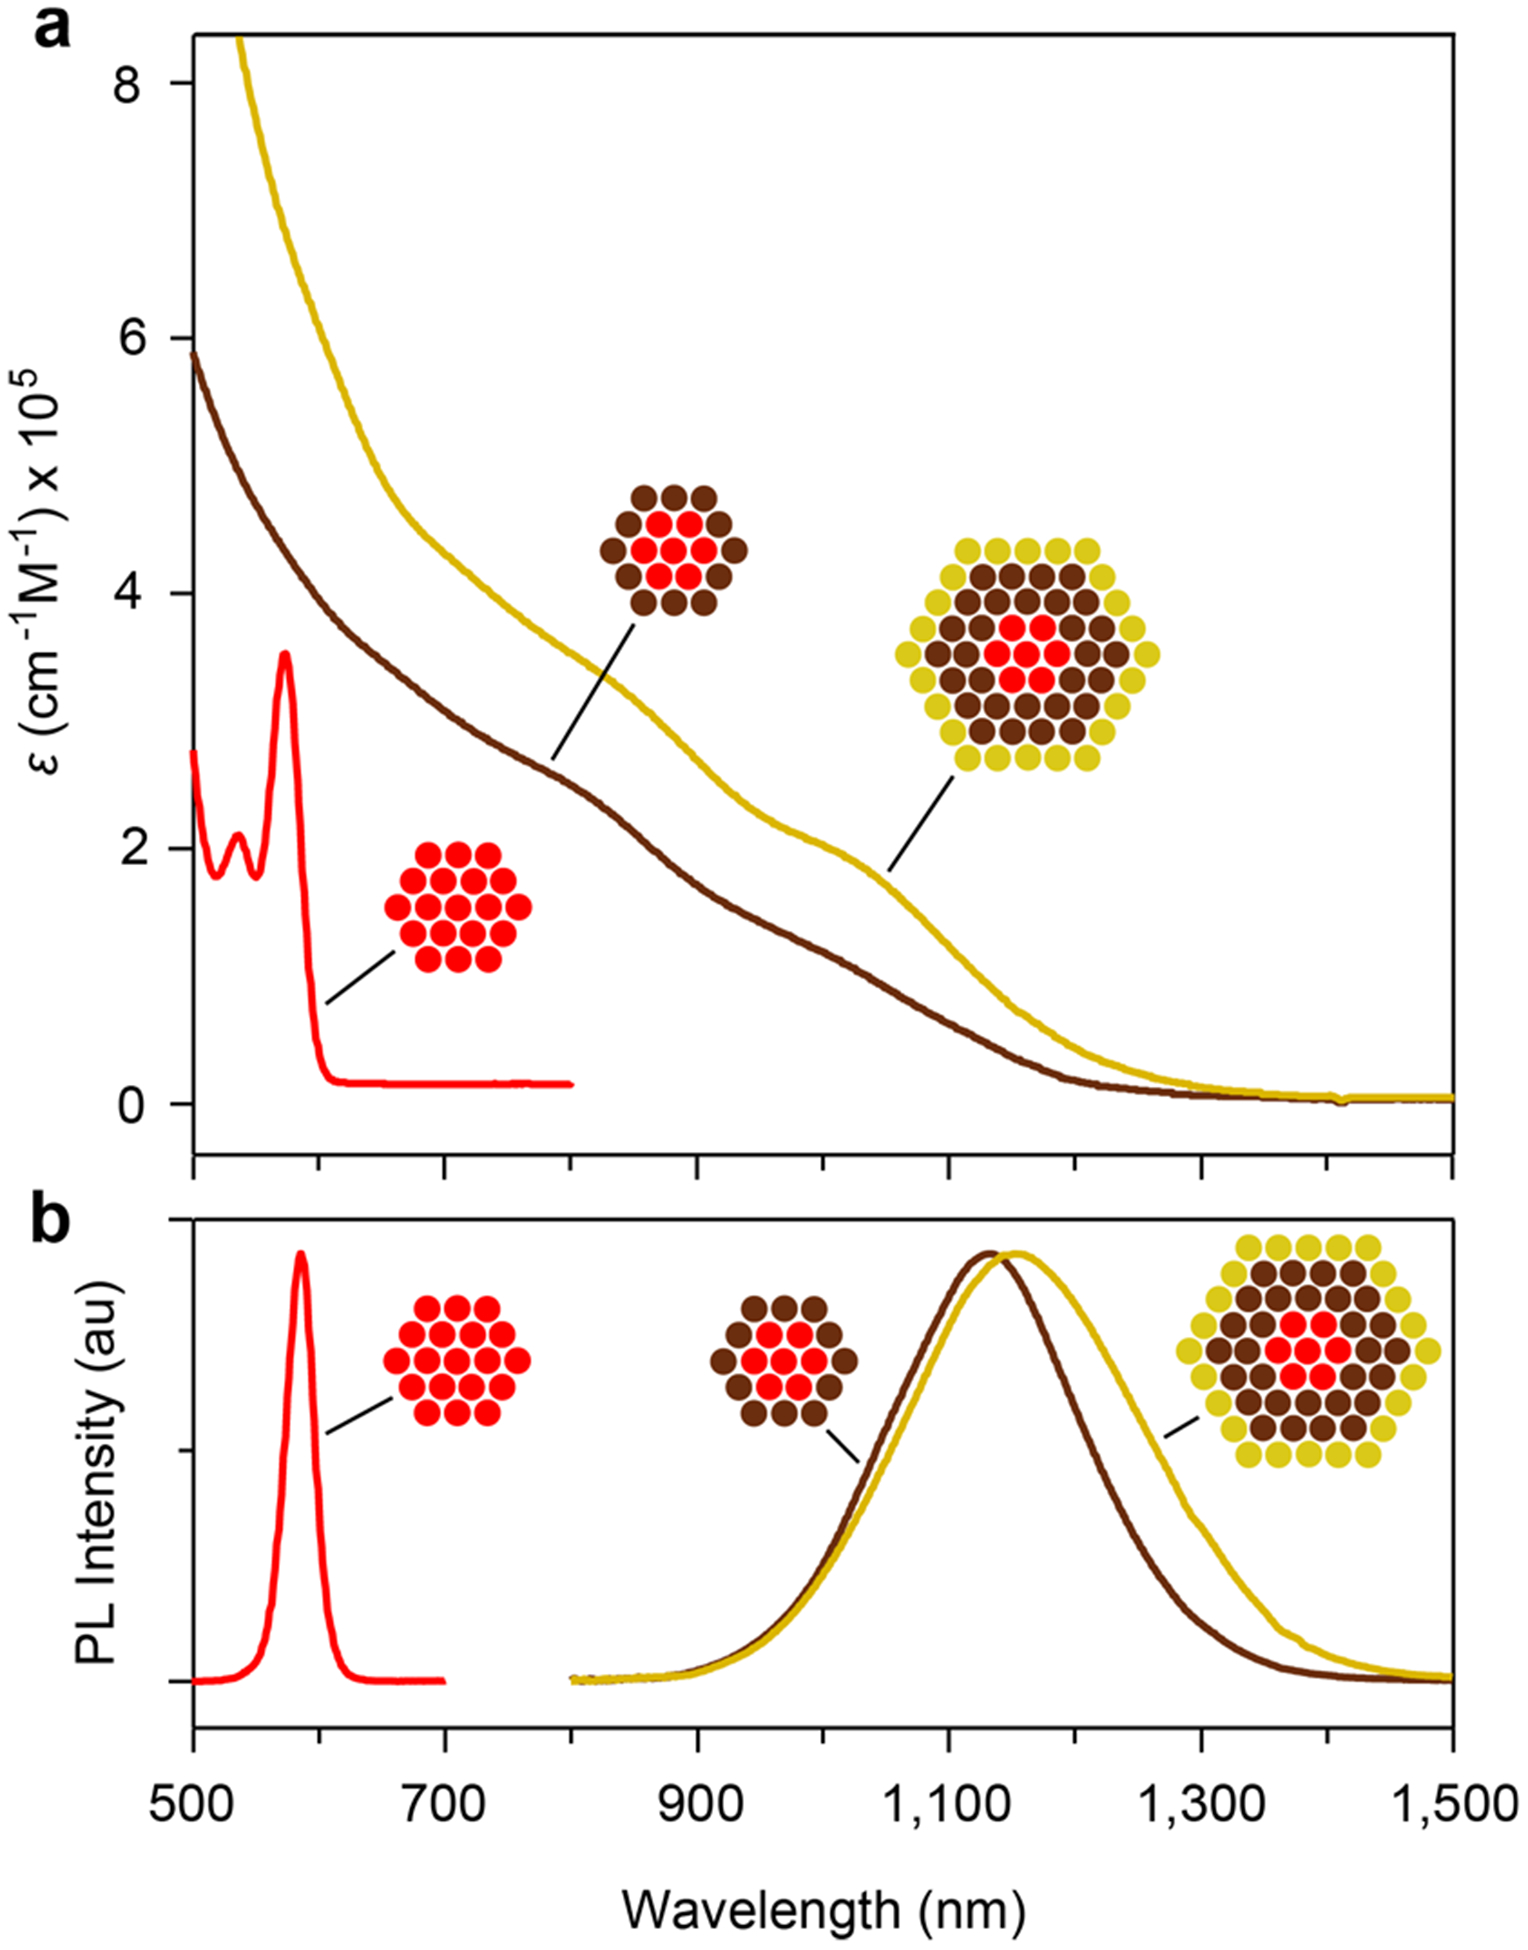
Figure 2a depicts steady state absorption and photoluminescence spectra of 5 batches of alloy VIR-QDs based on 3.9 nm CdSe nanocrystal cores with different mercury content. The QDs are named based on the peak wavelength of the photoluminescence emission when dispersed in tetrachloroethylene (TCE), QD-630, QD-770, QD-950, QD-1130, and QD-1360, with mercury-to-cadmium ratios (Hg/Cd) of 0, 0.070, 0.16, 0.23, and 0.31, respectively, measured by inductively coupled plasma-optical emission spectrometry (ICP-OES, Table S1). Photoluminescence spectra in Figure 2a are shown for both pure QDs in TCE as well as aqueous polymer-coated QDs in heavy water (D2O), both minimally absorbing solvents (see below). The emission band is tunable from ~600 to 1400 nm, spanning the visible, entire NIR-I, and one-half of the SWIR, as far as our fluorescence spectrophotometer can detect. To our knowledge, this is the widest spectral tunability (~1.2 eV) reported to date by alloy composition alone. The Hg/Cd ratio correlated with the photoluminescence band energy with negative linearity (R2 = 0.98), so presumably the entire SWIR and mid-infrared can be covered by further deposition of the HgxCd1−xS domain. The emission can be tuned further to the blue as well simply by using a smaller core or by including sulfur in the core.66 The full-width-at-half-maxima of the emission bands increase from 0.094 eV for the CdSe-based QDs to 0.15–0.22 eV for the QDs incorporating mercury (Table S2). Notably, we tuned the emission by continuously monitoring the absorption and emission spectra during cation exchange and the two epitaxial growth steps and have not yet rigorously determined the reproducibility of a specific synthesis protocol to achieve a precise emission wavelength or bandwidth. in absorption and photoluminescence bands, as well as a decrease in QY due to the introduction of surface traps that lead to nonradiative decay processes. In contrast, the insulating CdxZn1−xS shell has less impact on the spectral shape, and simply increases the absorption coeffcient in association with a small red shift. However, the CdxZn1−xS shell boosts QY and is essential for retaining QY after phase transfer to water and maintaining stability for months under ambient conditions. The robustness of coverage of the shell is evident from the lack of spectral shift upon purification and phase transfer to polar solvents.
Figure 2.
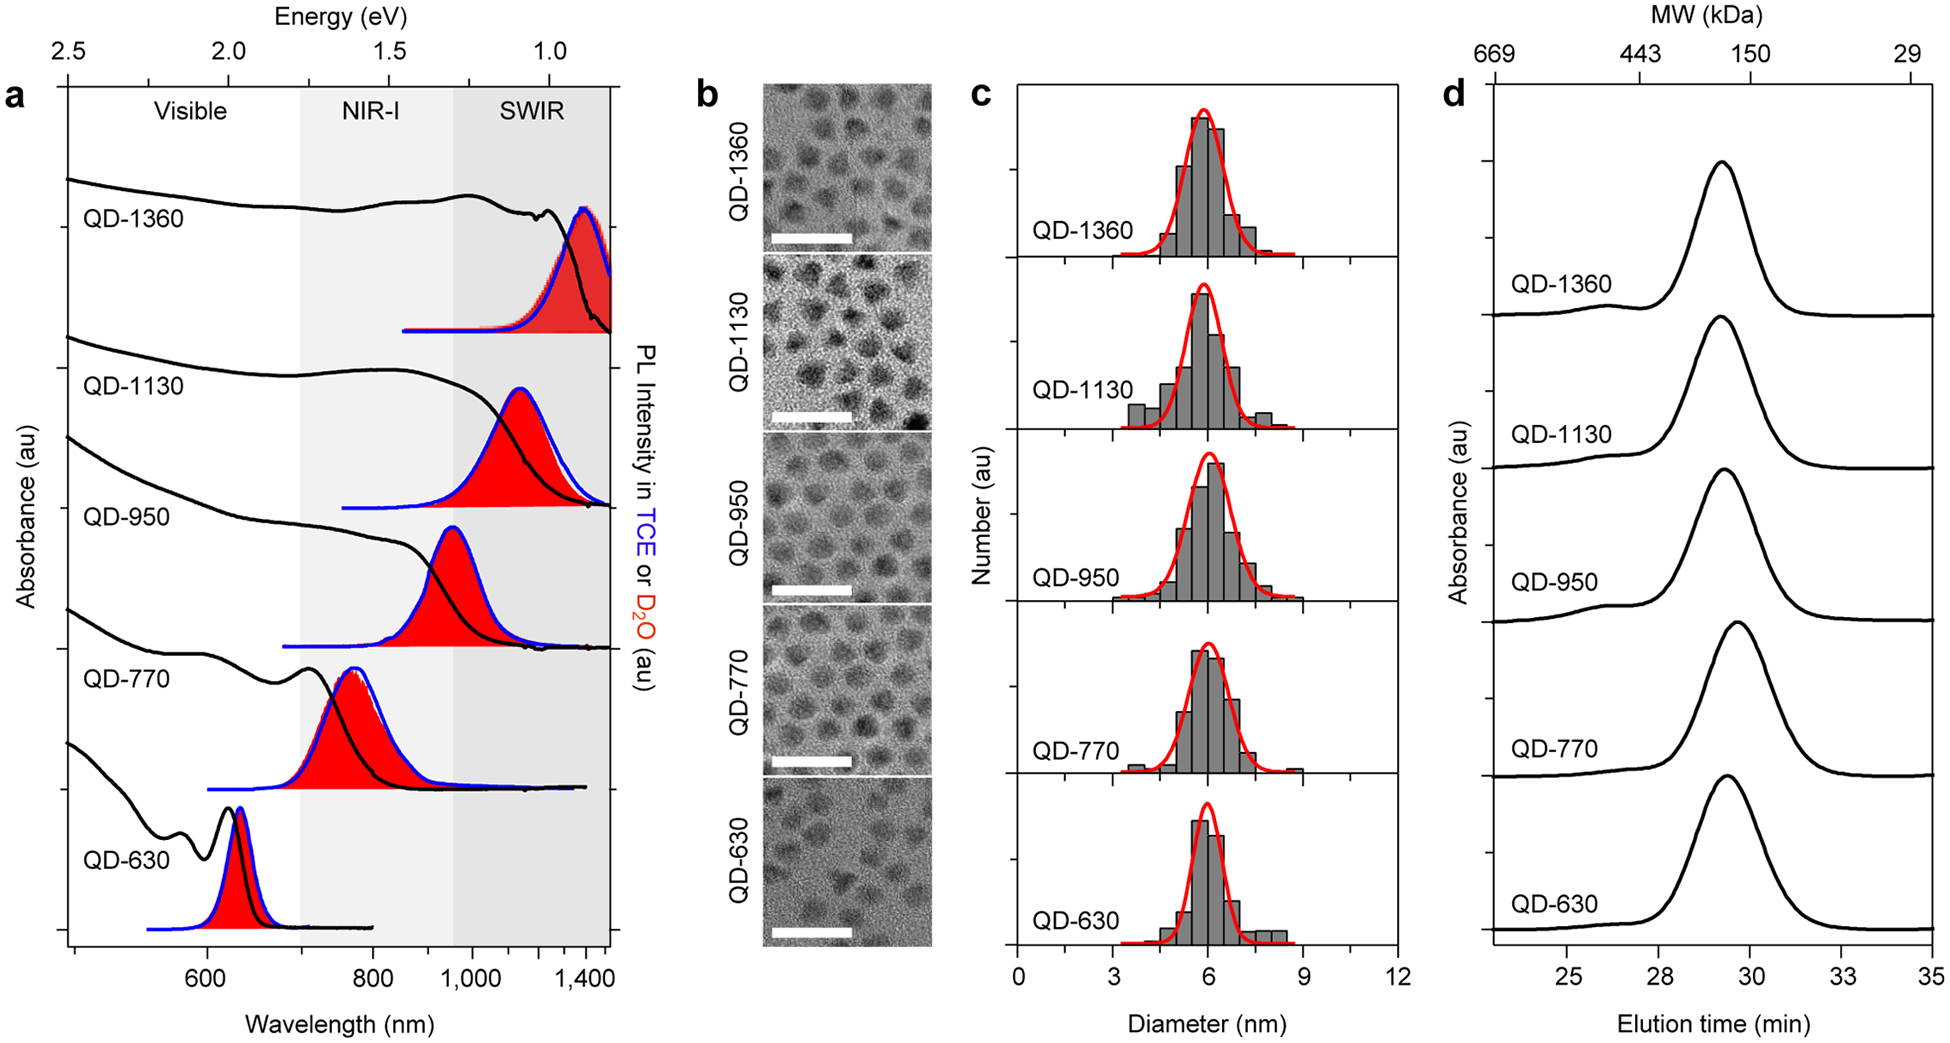
Photophysical and structural characterization of VIR-QDs. (a) Tunable absorption and photoluminescence (PL) spectra for five spectrally distinct VIR-QDs. Black lines are absorption spectra, blue curves are PL spectra in tetrachloroethylene (TCE), and red filled areas are PL spectra in deuterated water (D2O). (b) Transmission electron micrographs for the five samples. Scale bars are 20 nm. (c) Size distributions from the corresponding TEM images. Red lines are Gaussian fits to the histograms. (d) Gel permeation chromatograms for the five QDs after coating with multidentate polymer ligands and dispersion in water. Molecular weight protein standard elution times are indicated on the top x axis. au = arbitrary units.
Quantum Yield.
VIR-QDs coated with their native ligands after synthesis exhibited high QY between 40% and 80%, measured in low-absorbing TCE or hexane relative to reference dyes (Table S3). QY values of the VIR-QDs coated with P-IM or P-IM-N3 were more challenging to measure due to the high absorption coeffcient of water beyond ~1100 nm, resulting in irregular spectral shapes due to fluorescence reabsorption by the solvent, with a strong dependence on dilution. To overcome this issue, we measured spectra in heavy water (D2O), which is chemically the same as normal water but with heavy hydrogen isotopes, which drastically reduces vibrational oscillator strengths in the SWIR region. Figure 4 shows the impact of these solvent conditions, with a moderate alteration in the fluorescence emission band shape for QD-950 in normal water but a drastic impact on QD-1360. In all cases, the emission band shapes in heavy water were similar to those in TCE (Figure 2a), indicating that the spectral perturbation by normal water derives from light absorption by the solvent, rather than photophysical changes in the QDs themselves due to coating exchange. In heavy water, QYs of all of the QDs were high but lower than those in TCE, between 30% and 38% in the 770–1130 nm spectral range. These aqueous QYs are much higher than those reported for the many recently developed NIR and SWIR fluorophores.43–47,70,71 The observed reduction in QY due to the coating and phase transfer process is common for II–VI QDs and interpreted as surface atom reconstruction and surface defect introduction due to ligand exchange.59 For fluorescence microscopy applications using biological samples that are composed primarily of normal water, these ensemble measurements in heavy water are a realistic condition for interpreting performance outcomes (see below) because >99% of SWIR light transmits through thin (~10 μm) biological samples, eliminating the solvent absorption effects that impact ensemble measurements in normal water. This is unlike applications in thick tissues, for which 1 cm of tissue will attenuate >99.9% of light in the 1400 nm SWIR wavelength range. Notably, QDs emitting at 1360 nm exhibited a more substantial drop in QY after phase transfer, with 14% measured in heavy water, although a substantial fraction of the emission was outside the spectral range of our detector.
Figure 4.
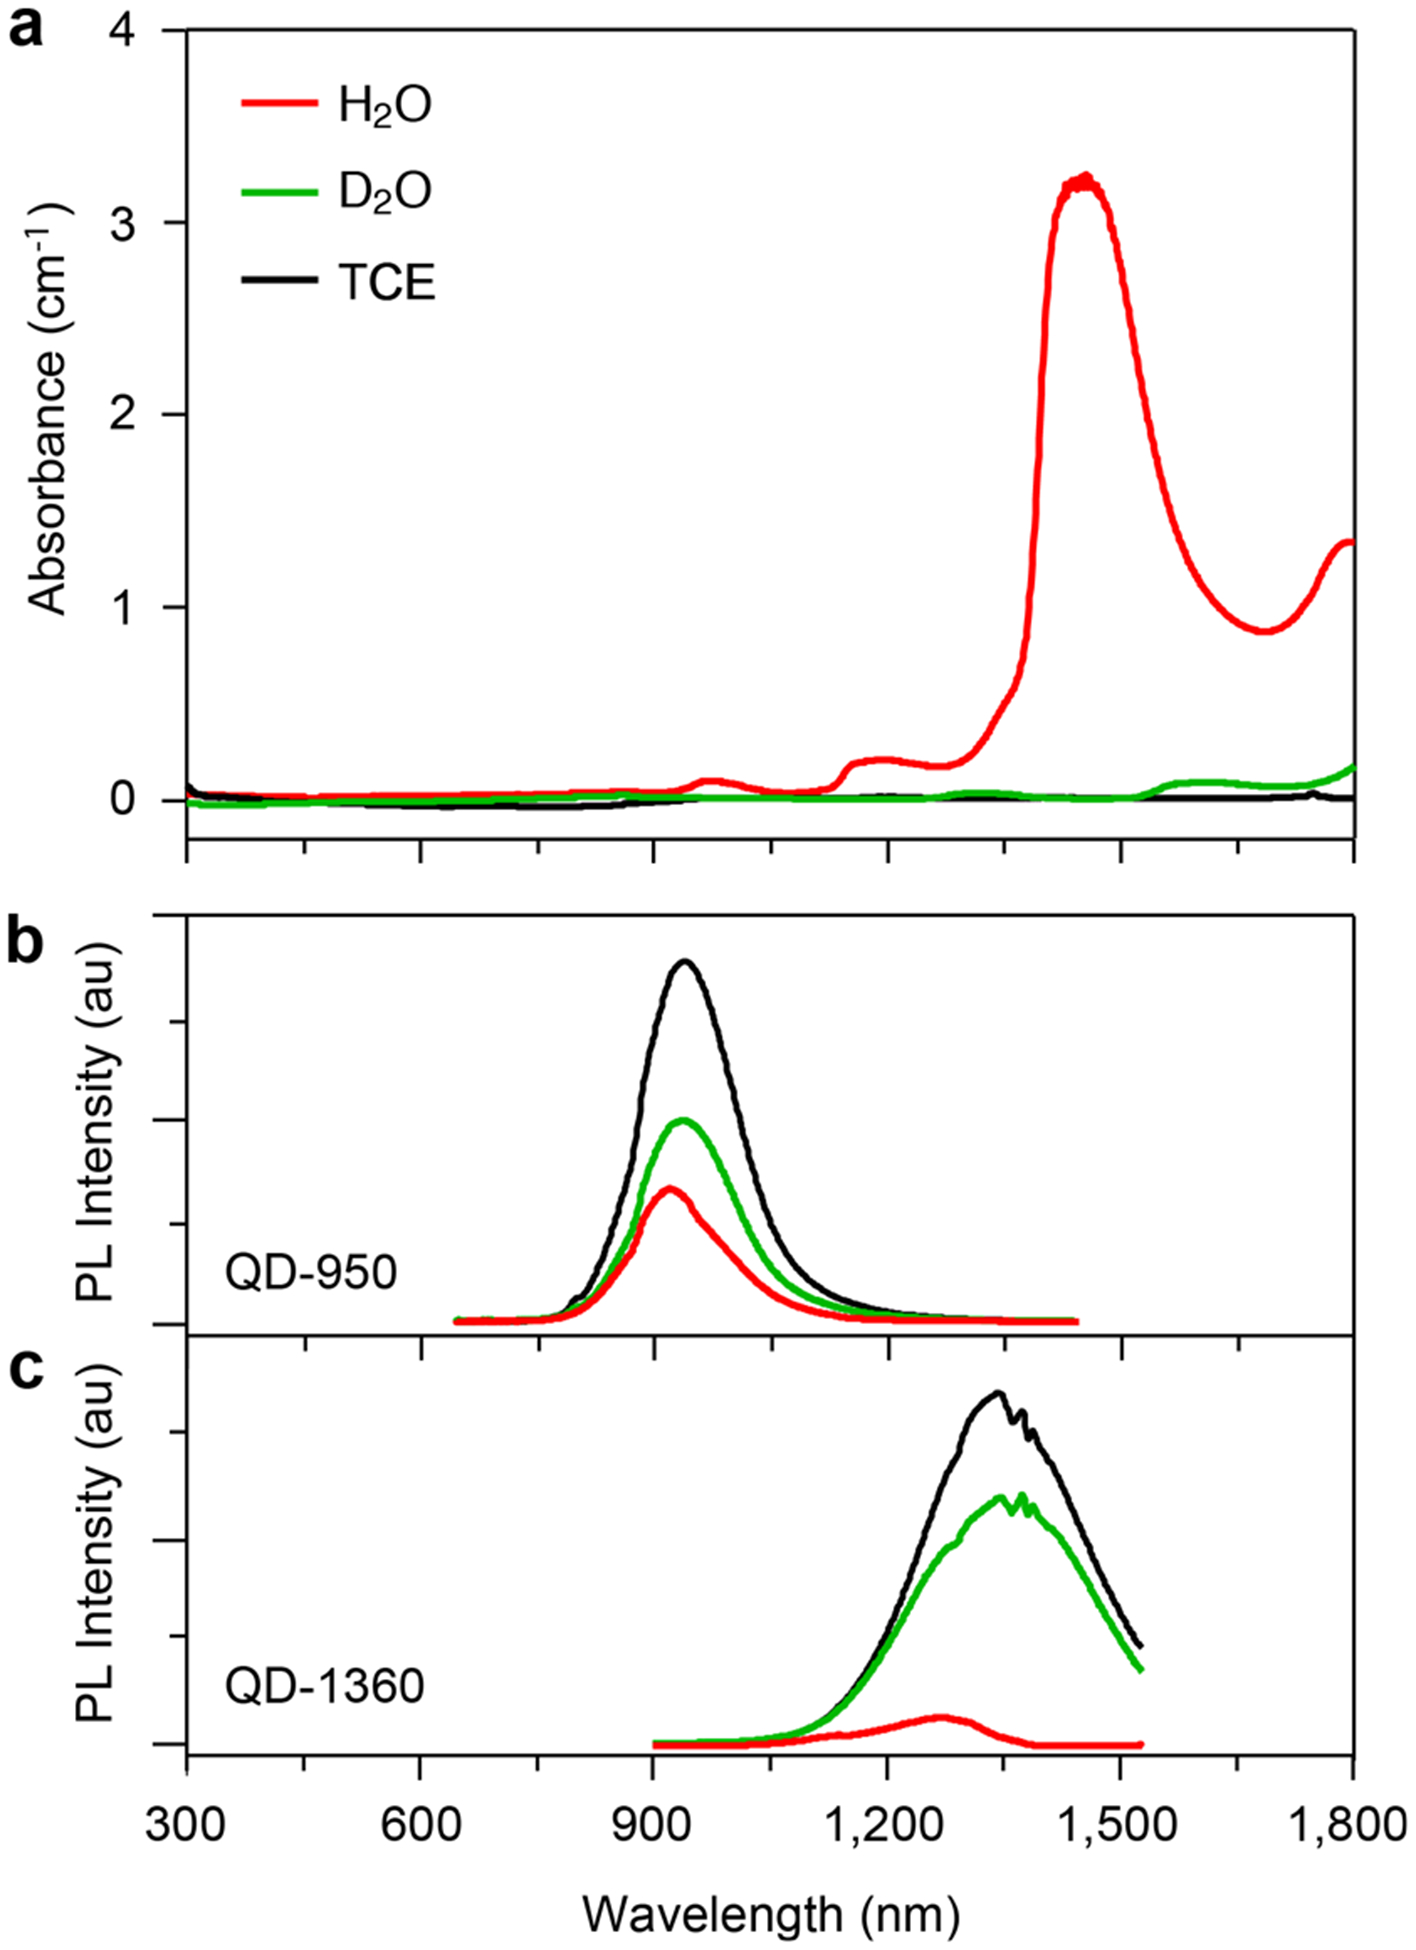
Impact of solvent absorption on VIR-QD emission spectra. (a) Absorbance spectra of three solvents used for QDs: normal water (H2O, red), heavy water (D2O, green), and tetrachloroethylene (TCE, black). (b) Photoluminescence (PL) spectra of QD-950 in three solvents. (c) PL spectra of QD-1360 in three solvents. For spectra in panels b and c, QDs were diluted to achieve equal absorbance at 350 nm, the wavelength we use for concentration determination, indicating equal QD concentrations. Excitation wavelength is 400 nm for both b and c. au = arbitrary units.
Physical Dimensions.
TEMs of the nanocrystals (Figure 2b) show quasi-spherical particles with a mean size near 6.0 nm for all wavelengths. Size distributions are uniform, with ~10% relative standard deviation of diameter (Figure 2c), which is typical for conventional (CdSe)CdxZn1−xS QDs. It is noteworthy that some of the QDs are faceted in TEM images and not entirely spherical, which could derive from differences in cations and ligands on the QD surface after differing degrees of mercury exchange. Hydrodynamic diameters and monodispersity of the same QDs coated with multidentate polymers were assessed using gel permeation chromatography (GPC) in phosphate-buffered saline (PBS) in Figure 2d. All five QD colors exhibited equivalent elution times and similar degrees of monodispersity with minimal aggregation. Each sample further exhibited high colloidal stability under storage after extensive purification. Elution peak times of the QDs from GPC corresponded to 13 nm hydrodynamic diameter based on globular protein size standards. Dynamic light scattering showed unimodal hydrodynamic sizes in the same range 8.5–16.0 nm (Table S4); however, the results were unreliable due to poor data quality deriving from interference from absorption and fluorescence at red wavelengths used to measure the scattering intensity. In comparison, other reported coatings for SWIR materials in biological media include lipids and amphiphilic polymers that generate micellar structures and increase the size to near 30 nm.49 Monodentate and bidentate hydrophilic ligands can also be used to generate a more compact structure but provide little stability.72
Single Quantum Dot Imaging.
We used a home-built widefield optical microscopy setup to image the spectral range of aqueous VIR-QDs (Figure 5a). We used both a silicon-based CCD camera (Vis-CCD) and an InGaAs-based cooled CCD camera (NIR-CCD) with quantum efficiency curves shown in Figure 5b. Either a filtered bulb or a continuous laser was used for excitation. QDs were then deposited on coverslips and imaged in air using filter sets shown in Figure S3. We chose four VIR-QDs with emission spanning the visible (QD-630), NIR-I (QD-770), and SWIR (QD-1130), with one QD intermediate between the two infrared spectral windows (QD-950) that could be measured on both detectors for focusing and alignment (Figure 5c). We used the same four QDs to assess representative spectral ranges for biological studies (see below). Each of the four QDs could be readily detected at the single-molecule level using a 1.45 NA objective with a 100 ms exposure time (Figure 5c). The capacity to detect individual emitters at short time increments is consistent with the high ensemble QYs and absorption coeffcients of VIR-QDs and the high quantum effciencies of the detectors. Single QDs were distinguished from small aggregates by characteristic bimodal intensity distributions derived from blinking traces shown in Figure 5d and 5e.29 Importantly, single-QD traces were stable in air and under continuous excitation for at least 7 min without photobleaching, reflecting the robust electronic insulation provided by the CdxZn1−xS shell and the stability of the coating. The widths of two-dimensional Gaussian fits of single-QD point spread functions (PSFs) increased linearly with wavelength (R2 = 0.96; Figure S4) by a small magnitude consistent with diffraction-limited resolution theory.73 Potential implications of PSF size differences on image resolution are discussed further below. Next, we devised three strategies to test the breadth of utility of VIR-QDs for molecular labeling in cells and tissues and to measure the impact of the spectral wavelength.
Figure 5.
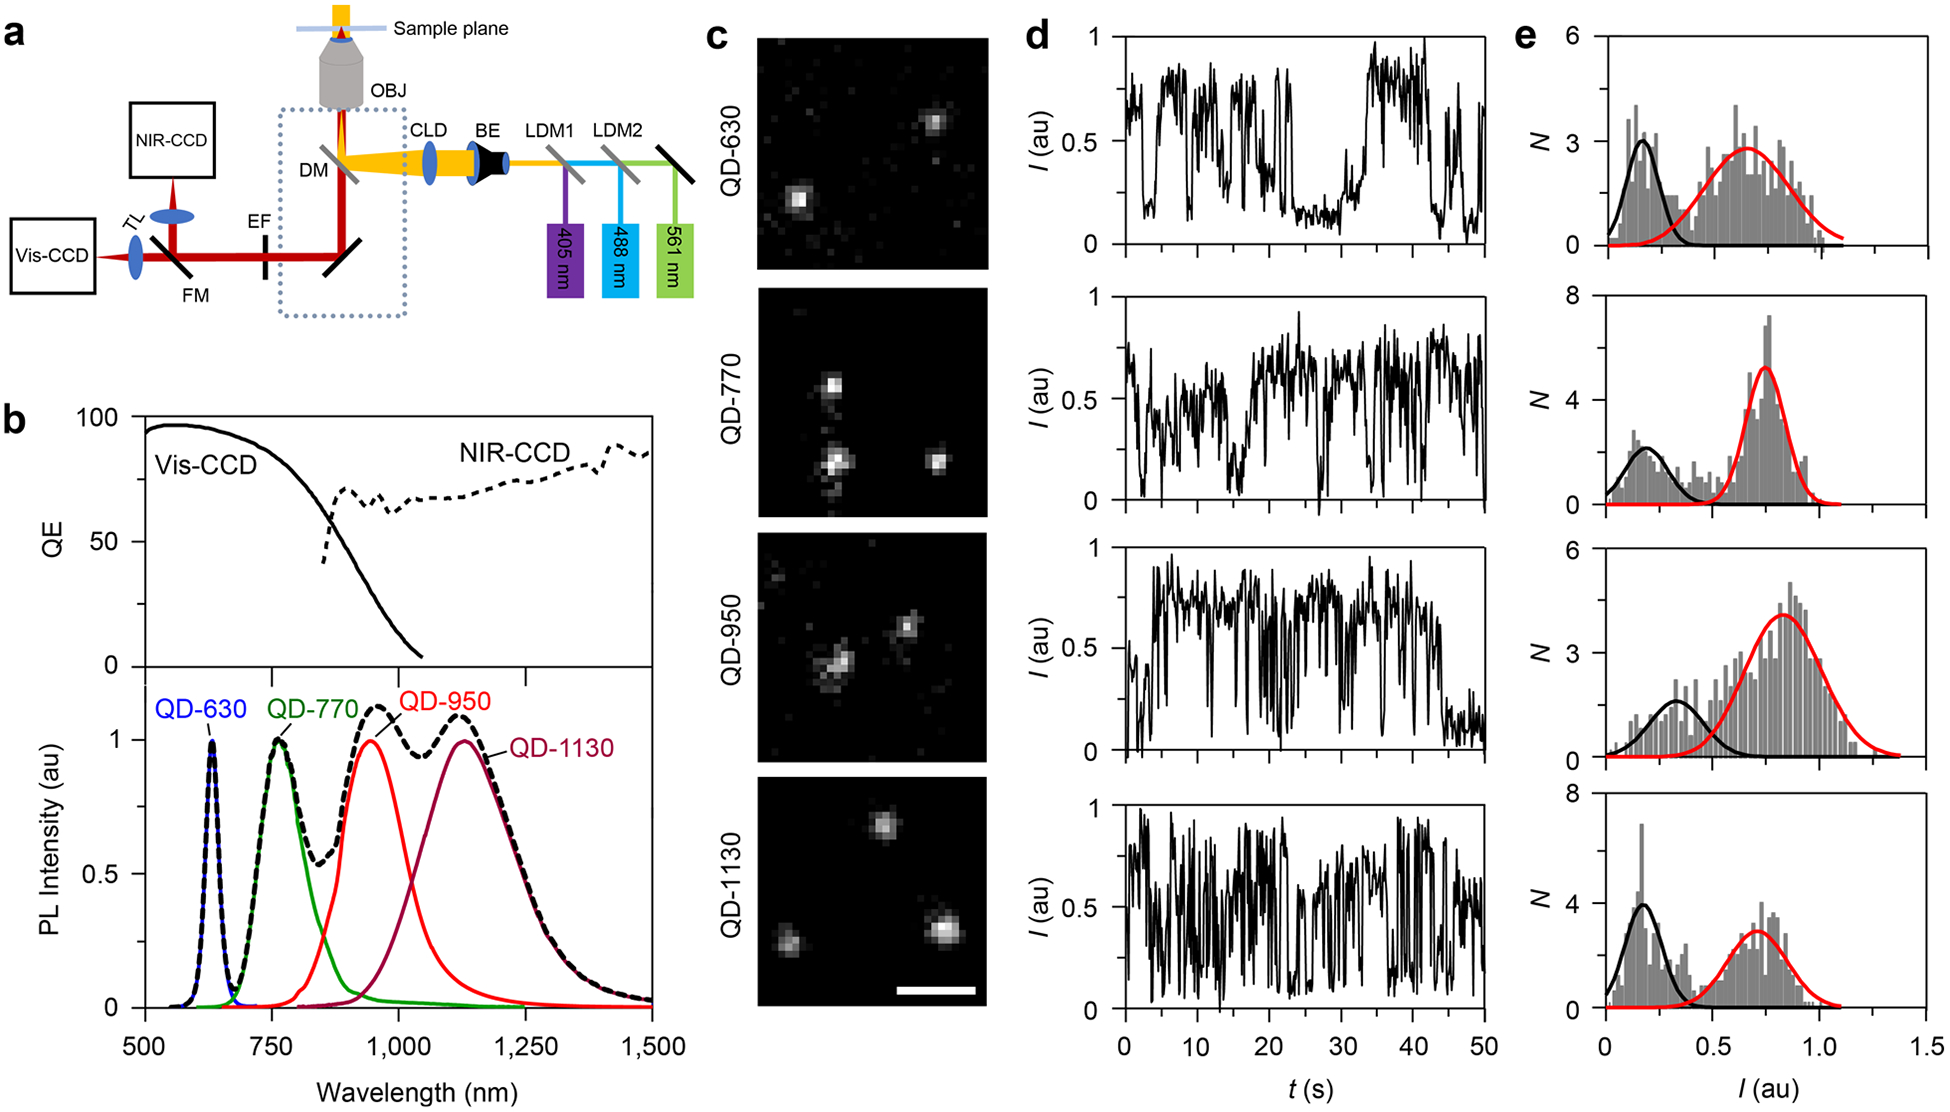
Single-molecule characterization of VIR-QDs. (a) Schematic depiction of the home-built optical microscope for imaging visible, NIR-I, and SWIR QDs. OBJ: Objective lens. BE: beam expander. CDL: condenser lens. DM: dichroic mirror. Dotted line: inverted microscope. EF: emission filter wheel. FM: flip mirror for switching between two cameras. TL: tube lens. NIR-CCD: liquid nitrogen-cooled NIR camera. Vis-CCD: EMCCD camera. LDM1/2: long-pass dichroic mirror. Lasers: 405, 488, and 561 nm. (b) Top panel shows quantum effciency (QE) curves of CCD detectors. Bottom panel shows fluorescence spectra of the four VIR-QDs analyzed (solid colored curves) and their sum (dashed black line). (c) Representative single-QD fluorescence images of QD-630, QD-770, QD-950, and QD-1130 at their respective emission wavelengths. All images share the same scale bar of 2 μm. (d) Representative intensity time traces of single QDs corresponding to the same QDs from panel c, collected with 100 ms exposure time at 2.19 frames per second. (e) Intensity histogram of single QDs shown in panel d with fitted Gaussians for the off intensity (black) and on intensity (red). au = arbitrary units.
Single Growth Factor Imaging in Cells.
We compared the performance of VIR-QDs across a wide spectral range for single-molecule imaging applications in cultured cells using the optical microscopy setup and four QDs in Figure 5 together with a recently described workflow for counting single growth factors on cells.29 We focused on epidermal growth factor (EGF), a signaling molecule that binds as a ligand to EGF receptors (EGFR) on cell membranes to induce signaling that can impact cell behavior and phenotype through processes that are dysregulated in diverse types of cancer.74–77 We previously showed that QDs could be conjugated to purified EGF molecules so that each EGF molecule bound to receptors on an individual cell could be imaged and counted to correlate with downstream signaling events. This was possible when using QDs emitting in the NIR-I spectrum (744 nm), but not possible with dyes or QDs emitting in the visible spectrum due to autofluorescence in cells which can be near to, or greater than, that of individual fluorophores.29 To label QDs with EGF, QDs coated with P-IM-N3 were covalently conjugated through copper-free “click” chemistry to SAv modified with dibenzylcyclooctyne (DBCO), resulting in a triazole linkage (Figure 1b).78 Then by mixing with biotinylated EGF, the QDs bound to the growth factor with near covalent bond strength (Figure 6a). We mixed four QD-EGF colors together and applied them on human triple-negative breast cancer cell MDA-MB-231 expressing EGFR, using a low concentration so that EGF binding is diffuse, allowing observation of well-separated individual molecules (Figure 6b). This is a similar protocol that we performed previously29 that allows direct comparison of different emitter classes spanning different wavelength ranges on the same sample; this is important due to the heterogeneity of autofluorescence across samples. We expect that all EGF-QDs bind equivalently to EGFR because of the strong specificity of these conjugates to EGFR and negligible binding by free QDs that we previously demonstrated29 together with the similar sizes of the VIR-QDs (Figure 2d) and their identical coatings. We also expect that there should be no photophysical interference between QDs as their large separation distances (hundreds of nanometers to micrometers) are too large to allow energy transfer.79
Figure 6.
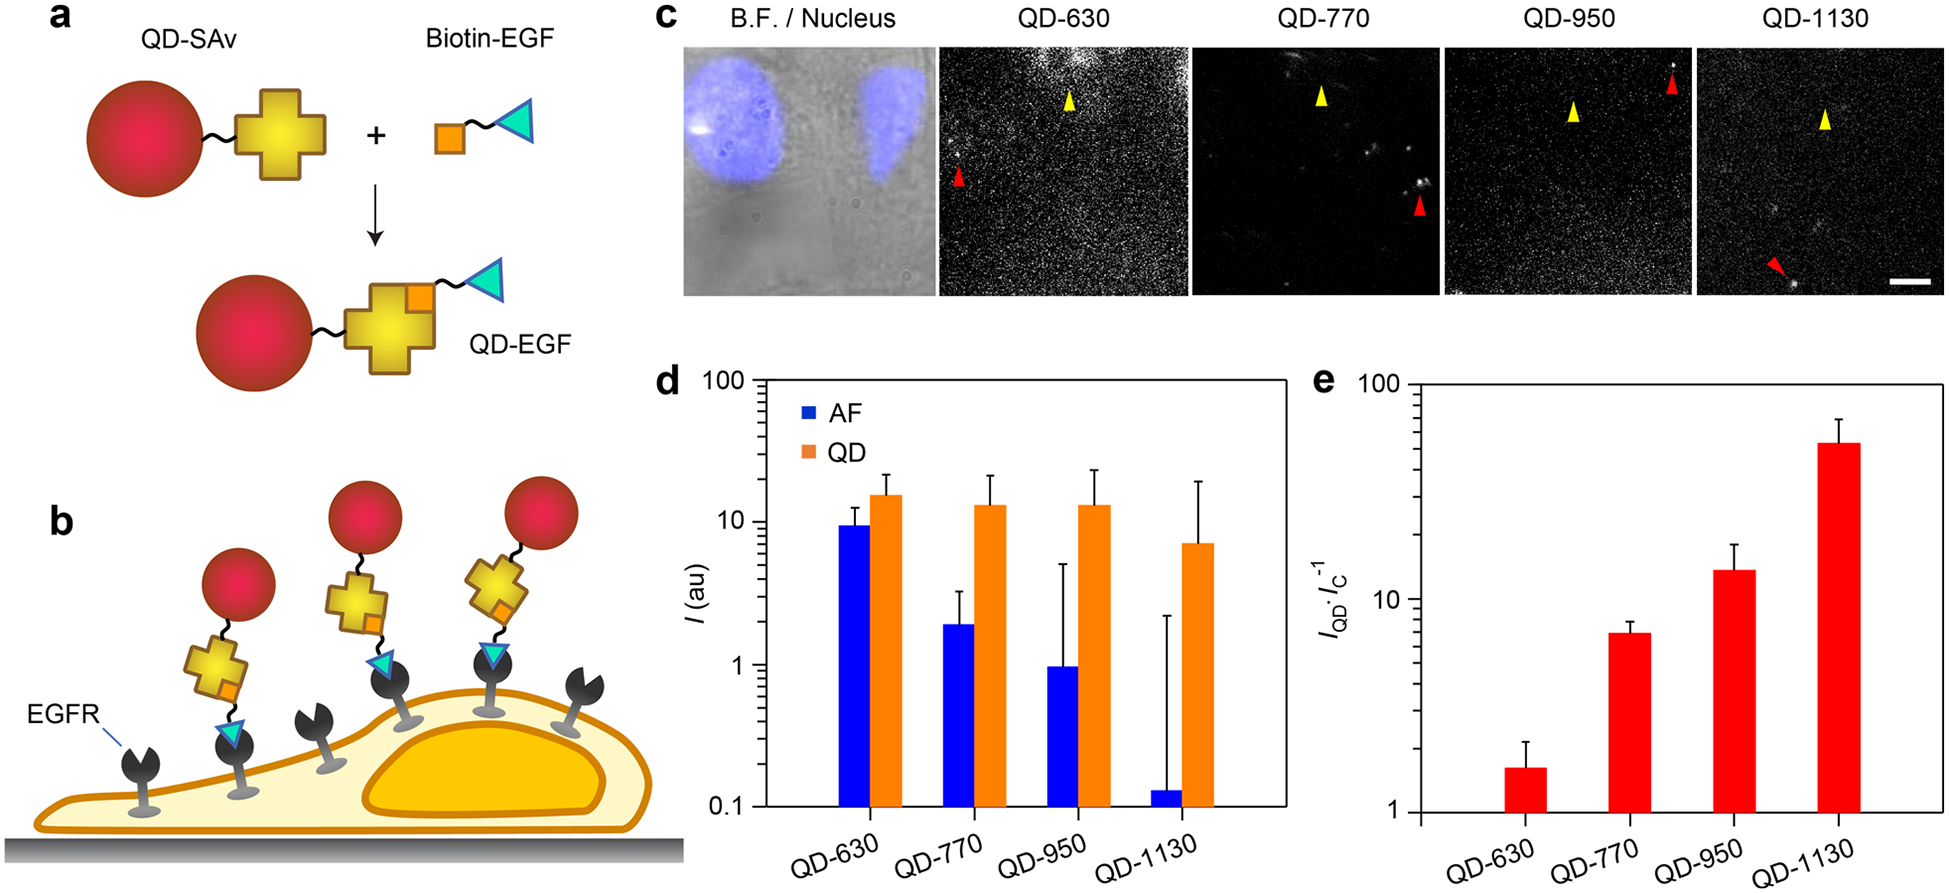
Single-molecule imaging of epidermal growth factor (EGF) on cultured cells using VIR-QDs. (a) Schematic depiction of conjugation between QD-streptavidin (QD-SAv) and biotin-EGF to generate QD-EGF. (b) Schematic depiction of cultured cells expressing epidermal growth factor receptor (EGFR), bound to QD-EGF. (c) MDA-MB-231 cells were incubated with 1 nM QD-630, QD-770, QD-950, and QD-1130 conjugated with EGF. Images show an overlay of brightfield (B.F.) and nucleus label (Hoechst 33342; blue) next to fluorescence images of QD-EGF conjugates with indicated spectral windows. Yellow arrows indicate an example region of high autofluorescence. Red arrows indicate single QDs with 488 nm excitation. Slightly higher background fluorescence is observed in the lower right side due to somewhat uneven illumination of the cells. All images share the same scale bar of 5 μm. (d) Single QD intensity and cellular autofluorescence (AF) intensity for 3 × 3 voxels (N = 3). au = arbitrary units. (e) Signal-to-background ratio for each QD derived from plot in panel d, calculated as the QD intensity (IQD) divided by the intensity of the control autofluorescence regions (IC). Error bars in d and e are standard deviation.
Figure 6c shows example images depicting the same field of view in multiple emission channels collected through bandpass filters. We measured the average intensity of QDs within 3 × 3 pixel areas and compared these values with mean values for the cell regions that did not contain QDs, as shown in Figure 6d. These two values were then divided to determine the signal-to-background ratio, shown in Figure 6e. The visible spectrum QD-630 intensity is only 1.6 times higher than the average cellular autofluorescence intensity, while at 770 and 950 nm, the single QD intensity is 7 and 14 times higher than autofluorescence, respectively. In the SWIR at 1130 nm, the single QD intensity is 55 times higher than cellular autofluorescence, which was close to the baseline intensities in noncellular areas measured using the NIR-CCD, even at the high excitation intensities needed for single-molecule counting. Over these spectral ranges and with the filters used, all of the single QDs exhibited similar intensities (Figure 6d), only differing on average by 1.4-fold. This uniformity was enabled by the maintenance of similar QD core sizes and monodispersity across the QDs. In contrast, the mean autofluorescence intensity decreased by nearly 2 orders of magnitude from the red spectrum to the SWIR. One disadvantage of the NIR-CCD camera in this application was that it exhibited much higher shot noise than the Vis-CCD, even with liquid nitrogen cooling. For these calculations, the shot noise was subtracted from signals to calculate the contribution to signal independent from the measurement instrument. A potential disadvantage of these SWIR QDs for live-cell applications is that increasing wavelength also requires an increase in the mercury content in the nanocrystals. Mercury, like cadmium, is a toxin in its cationic or reduced forms, so off-target effects and cellular damage could result if the nanocrystal deteriorates during the experiment and releases its elemental components.80–82 However, acute treatment over the course of 24 h did not show toxicity measurable by metabolic rate (p > 0.05; Figure S5) for concentrations more than 2 orders of magnitude higher than what are used for typical single-QD experiments, an outcome that we attribute to the robust inorganic shell and the stable coating layers.
Nucleic Acid Imaging in Cells.
Imaging endogenous molecules in cells using fluorescence is particularly challenging when target copy numbers are low. This is a prominent challenge for mRNA, which typically only exists in copies from tens to hundreds per cell,83 requiring molecular amplification for detection above autofluorescence background levels. We recently demonstrated that QDs can be used for accurate labeling and quantification of mRNA through fluorescence in situ hybridization (FISH) when the probes are smaller than ~15 nm, a threshold that enables complete cytoplasmic access in fixed and permeabilized cells.61 We tested the four VIR-QDs described above as labels for glutaraldehyde 3-phosphate dehydrogenase (GAPDH) transcripts using covalent QD-SAv conjugates with the labeling scheme depicted in Figure 7a and 7b. In this methodology, each target is labeled with approximately 10 QDs.61 QD-FISH fluorescence signals were observed for all four VIR-QD labels in fixed HeLa cells (Figure 7c). Unlabeled cells imaged under the same conditions used for QD imaging exhibited significant autofluorescence in the QD-630 and QD-770 channels; however, autofluorescence in deeper infrared windows (used for QD-950 and QD-1130) was similar in intensity to that of noncellular regions (Figure 7d). The specific mRNA FISH signal intensities were comparable across all four of the label channels (Figure 7e), so signal-to-background ratios increased approximately 10-fold when shifting VIR-QD wavelengths from the visible to the SWIR (Figure 7f). Autofluorescence signal is a major problem for current FISH labeling techniques, which are being broadly applied for cell classification in situ.28,84 This background can clearly be largely eliminated in the deep NIR-I and SWIR so that signals are nearly free from autofluorescence. Importantly, some mRNA FISH studies are performed at the single-molecule level83 using counts of individual fluorescence puncta rather than total measured fluorescence intensity which was used here. Our widefield images of GAPDH targets in a single image plane through the cells did not reveal well-isolated diffraction-limited spots. However, these spots could likely be reconstructed through deconvolution or through projections of three-dimensional z stacks.85
Figure 7.
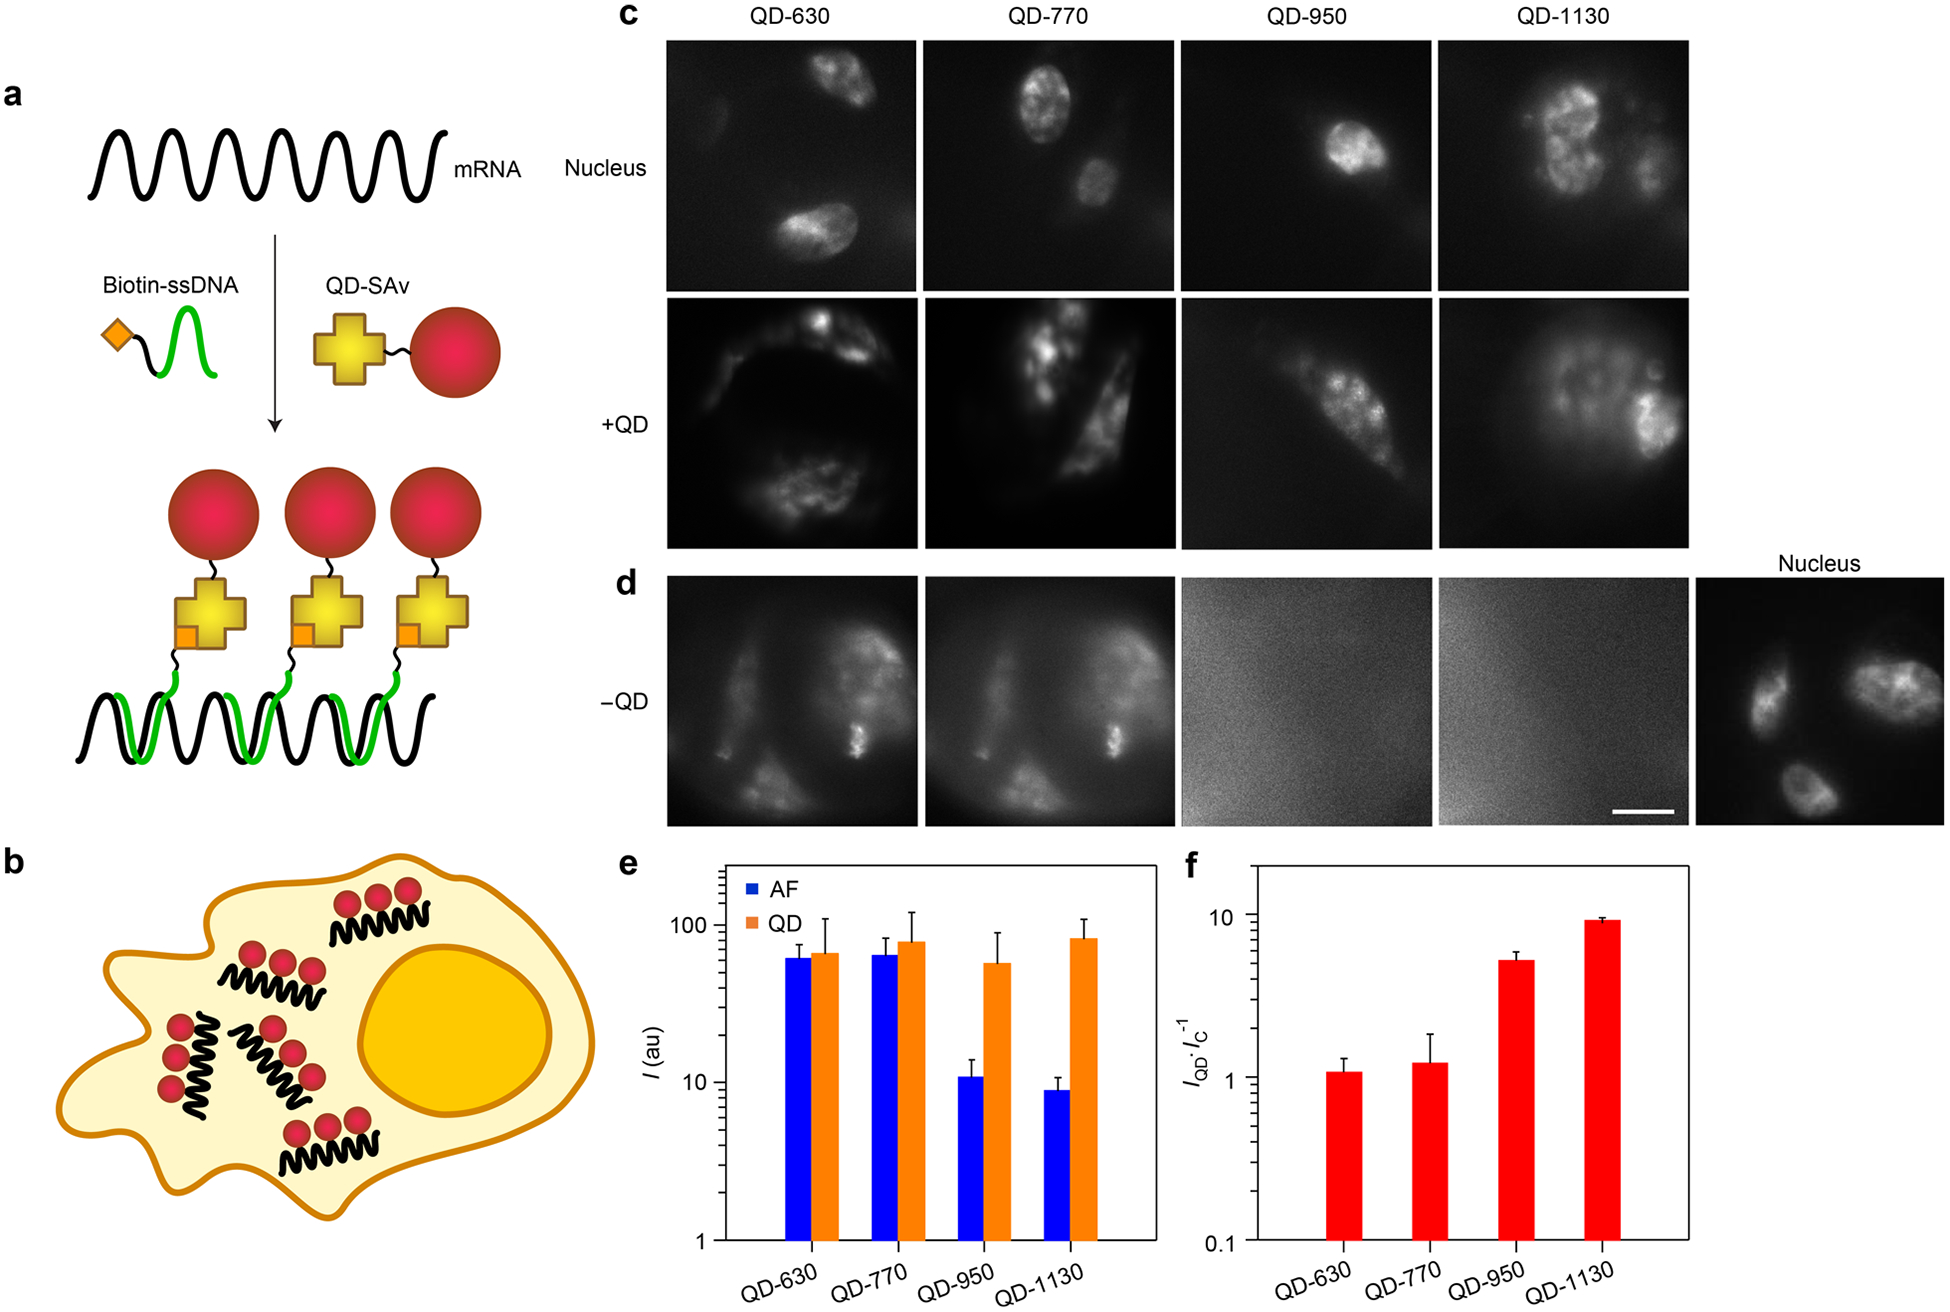
mRNA fluorescence in situ hybridization (FISH) in cultured cells using VIR-QDs. (a) Schematic depiction of the mRNA labeling process in which biotinylated single-stranded DNA (ssDNA) is hybridized with mRNA targets in multiple sequence regions. QD-streptavidin (QD-SAv) then binds to biotin to append multiple QD labels per target. (b) Schematic depiction of cultured HeLa cell expressing cytoplasmic GAPDH mRNA (black) labeled with QDs (red). (c) Images show HeLa cells labeled with both nuclear dye (Hoechst 33342, top row) and each of four colors of VIR-QDs (bottom row), imaged in their respective spectral channels. (d) Images show HeLa cells labeled with Hoechst 33342 alone, without QDs, imaged in the respective QD spectral channels to reveal background autofluorescence levels. All images share the same scale bar of 10 μm. (e) Fluorescence intensity for +QD cells and autofluorescence (AF) intensity from −QD cells (N = 3). au = arbitrary units. (f) Signal-to-background ratio for each QD channel derived from the plot in panel e, calculated as the QD intensity (IQD) divided by the intensity of the control samples for autofluorescence (IC) in each channel. Error bars in e and f are standard deviation.
Immunofluorescent Imaging of Proteins in Fixed Tissues.
Compared with cells grown in a culture, resected tissue from animals and clinical biospecimens exhibit autofluorescence that is substantially more intense and heterogeneous, which makes important applications in biomarker detection particularly challenging and nonquantitative.86 To determine if SWIR emission provides advantages for these applications, we labeled tissue antigens with QD–antibody conjugates. Conjugation was performed by QD self-assembly with recombinant Protein A expressed with a terminal hexahistidine sequence which binds to the QD surface through metal atom chelation without the need for covalent linkages (Figure 1b). Protein A then serves as an adaptor which binds to the Fc domain of certain classes of IgG antibodies (Figure 8a).87 We used QD conjugates of an antibody against α-tubulin, a high copy number cytoplasmic microtubule target (Figure 8b). We labeled 10 μm sections of mouse adipose tissues (Figure 8c) which exhibit distinguishable histological features of microtubule localization due to the absence of the target within cell nuclei or within large adipocyte fat globules. The intensity of autofluorescence was so high in this tissue that QD-630 was not distinguishable above the background levels, resulting in effectively undetec able microtubule signals (Figure 8d). However, autofluorescence was substantially reduced in QD-950 and QD-1130 channels, yielding signal-to-background ratios of 23 and 29, respectively (Figure 8e). The staining patterns for QD-950 and QD-1130 were unlike those of QD-630 and QD-770, with the more red-shifted channels showing an absence of high-intensity signals within cell nuclei, which lack microtubules. The two red-shifted channels also showed image patterns with substantially more submicrometer fibers consistent with the structure of microtubules (Figure S6), despite the slightly lower resolution of diffraction-limited objects at longer wavelength. This trend of increasing signal-to-background ratio when moving from the visible to the NIR-I and to the SWIR is similar to that observed in cultured cells (Figures 6 and 7) and again demonstrates the utility of long-wavelength emission for microscopic molecular detection and imaging in challenging biospecimens. However, in this sample type, autofluorescence is still measurable above background in the SWIR, so improvements in signal-to-background between the NIR-I and the SWIR are smaller than those observed in cultured cells. Notably in this experiment involving dense labeling of microtubules by multicolor QDs, close proximity between multicolor QDs could hypothetically induce energy transfer between adjacent QDs, which could change their relative intensities. However, the effect is expected to be small because the shortest separation distance between QDs is expected to be about 10 nm due to the insulating barriers of the polymeric coating and Protein A, a distance too long for effcient Forster-type energy transfer.79
Figure 8.
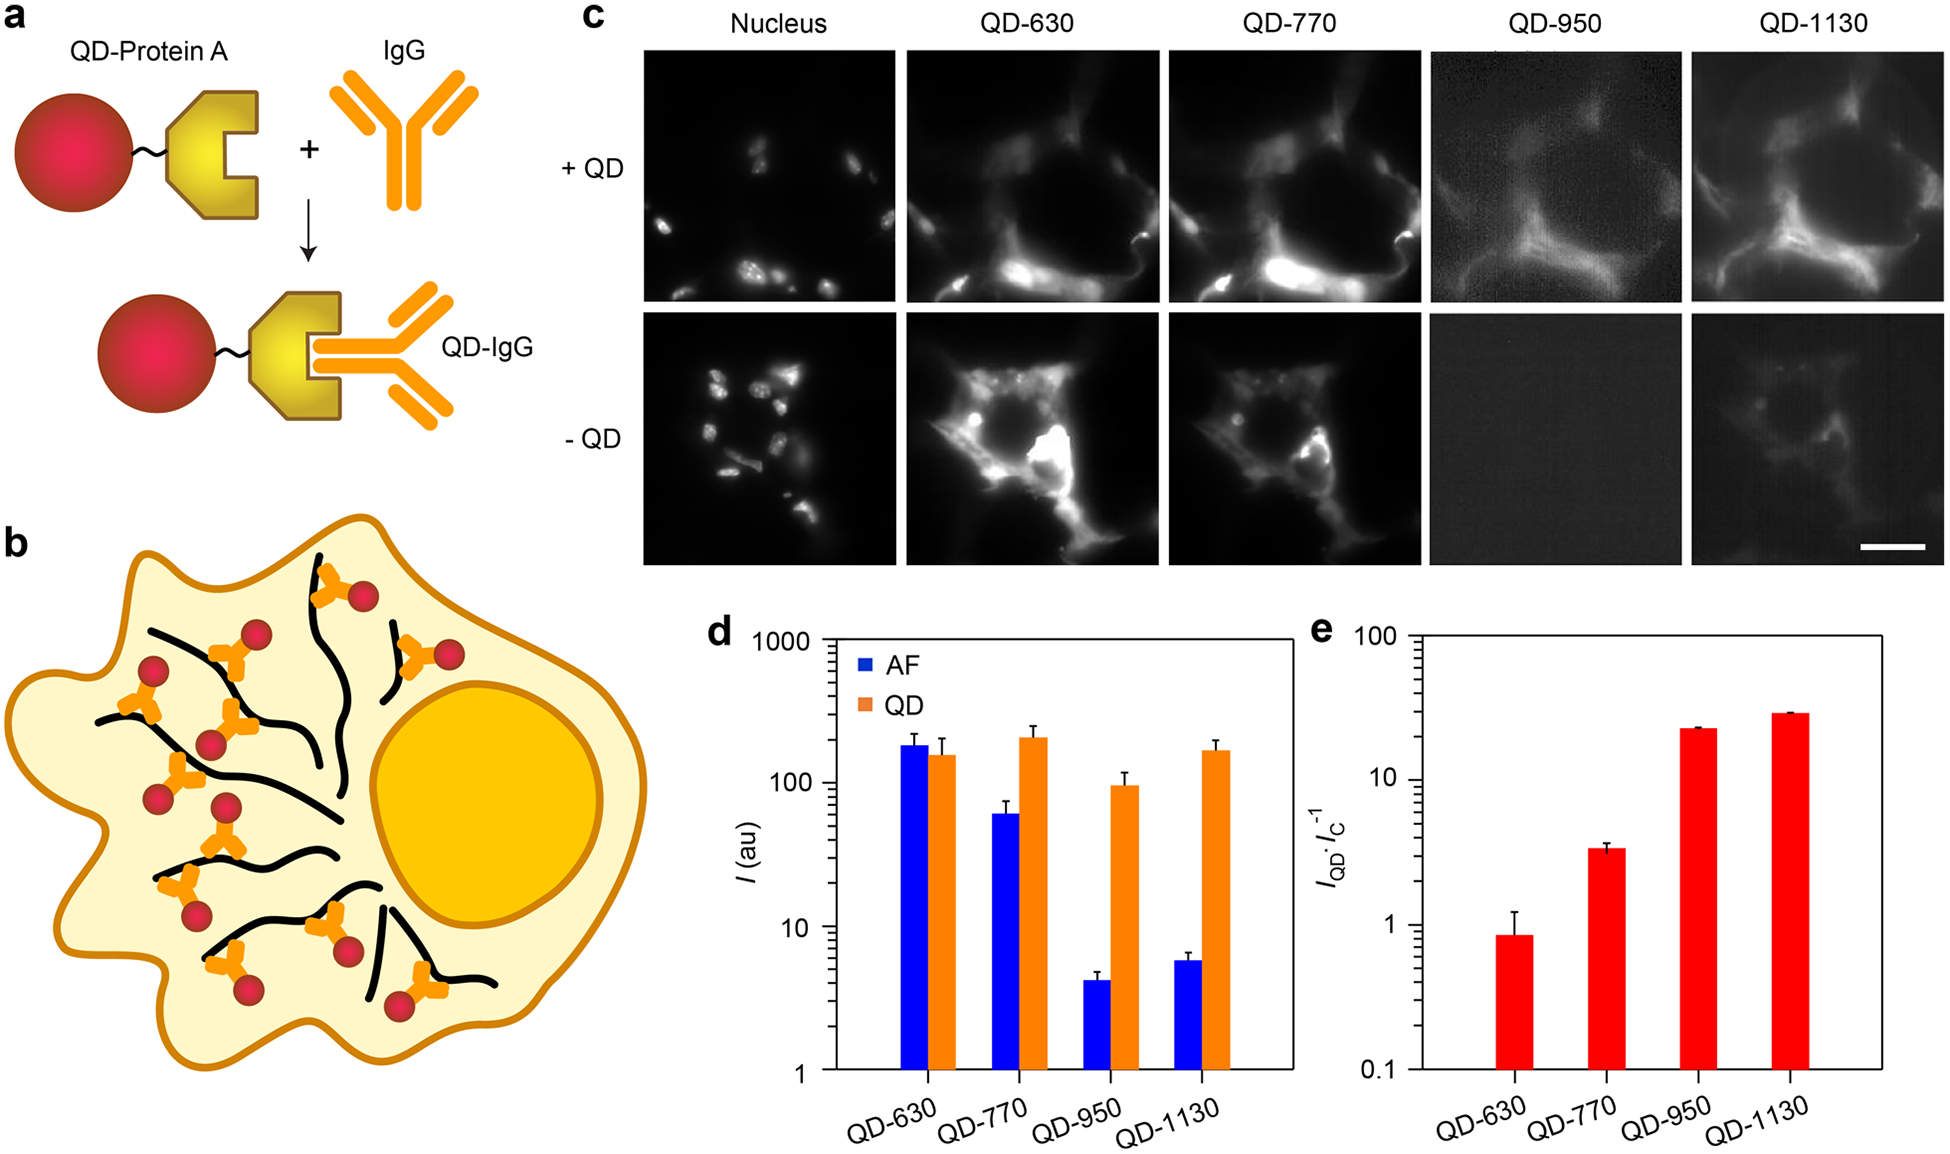
Immunofluorescence staining of fixed adipose tissues using VIR-QDs. (a) Schematic depiction of IgG antibody conjugation to QDs using Protein A adaptor which binds to the Fc domain of IgG. (b) Schematic depiction of QD conjugates (red) of anti-α-tubulin IgG (orange), which labels cytoplasmic microtubules (black). (c) Fluorescence images of mouse adipose tissue are shown with indicated spectral windows, labeled with a nuclear dye (DAPI) and stained with four-QD cocktail (+QD, top row) or no QDs (−QD, bottom row), showing background autofluorescence levels. All images share the same scale bar of 20 μm. Representative expanded images are shown in Figure S6. (d) Intensity of staining for +QD tissues and autofluorescence (AF) intensity for −QD tissues (N = 3). au = arbitrary units. (e) Signal-to-background ratio for each QD derived from plot in panel d, calculated as the QD intensity (IQD) divided by the intensity of the control samples for autofluorescence (IC) in each channel. Error bars in d and e are standard deviation.
■ CONCLUSIONS
Nanomaterials with diverse compositions and structures have recently been developed that absorb and emit light in the SWIR.33 A major advantage of VIR-QDs is that they are based on decades of well-developed and industrialized II–VI chemical processing steps that allow precise tuning of nanomaterial composition, shape, size, and internal structure. Synthetic developments of VIR-QDs now add mercury-based shelling through temperature cycling to the unit processing steps of II–VI materials. With this new shelling method, the emitters can be continuously tuned between visible, NIR-I, and SWIR spectra, and we believe the emission can be pushed even further in the mid-infrared employing the same technique. Because the new alloyed core materials are compatible with well-developed CdxZn1−xS epitaxy methods and hydrophilic coatings, these new QDs are both stable and bright under oxidizing conditions and can be immediately adapted to downstream applications that currently use standard (CdSe)CdxZn1−xS QDs, including bioimaging research and devices. In contrast, new nanomaterials from chemical families outside II–VI may require entirely new coating technologies and extensive testing for applications in complex biological media. The large increase in signal-to-background ratio observed for VIR-QDs with SWIR emission is likely to impact several areas which are critically limited by this parameter. These include FISH assays which are being used to map cell identities across tissues based on signals that often have similar intensities as background signals,61 immunofluorescence-based quantification of clinical biomarkers on resected biospecimens,88,89 and 3-dimensional imaging of intact tissues, for which background autofluorescence often limits the use of fluorescent probes to a narrow red-shifted window suitable for just a single target with high expression.21 These VIR-QDs are also ready to be deployed for single-molecule dynamic imaging in live samples. With red-shifted excitation spectra as well as emission, these QDs may eliminate phototoxicity that currently limits single-photon QD-based live-cell experiments. While SWIR images are fundamentally lower in resolution compared with those in the visible spectrum (here by a margin of 45%), SWIR object resolution may be enhanced for broad categories of samples for which background noise is limiting, such as plants and fixed tissues.90 Beyond SWIR emitters, both upconverting emitters26 and multiphoton excitation25 allow probe detection with reduced autofluorescence due to excitation at wavelengths longer than the emission wavelength. Both modalities are compatible with high quantum effciency visible spectrum detectors, however multiphoton excitation requires specialized, expensive instruments for laser excitation. In addition, the longer history of development of downconverting fluorophores like QDs has resulted in access to smaller probes with continuous and independent tunability of wavelength and brightness, properties not yet available in upconverting materials.66 With the ongoing and concurrent rapid developments of SWIR emitters, upconverting emitters, and novel imaging modalities, it will be fascinating to see which tools are ultimately adopted by the life science communities for specific end-use applications in molecular labeling and imaging.
■ EXPERIMENTAL SECTION
Materials.
Cadmium acetate dihydrate (Cd(Ac)2·2H2O, 98%), selenium dioxide (SeO2, ≥99.9%), sulfur powder (99.98%), mercury acetate (Hg(Ac)2, 99.999%), 1,2-hexadecanediol (HDD, 97%), tetramethylammonium hydroxide solution (TMAH, 25 wt % in methanol), behenic acid (BAc, 99%), 1-octadecene (ODE, 90% tech.), oleylamine (OLA, 70%), 1-octanethiol (OT, 98.5%), and potassium hydroxide (KOH) were purchased from Sigma-Aldrich. Anhydrous cadmium chloride (CdCl2, 99.99%), zinc acetate (Zn(Ac)2, 99.98%), and oleic acid (OAc, 90%) were purchased from Alfa Aesar. Solvents including chloroform, hexane, acetones, diethyl ether, and methanol were purchased from Thermo Fisher Scientific. All reagents were used as purchased.
Cadmium Behenate Synthesis.
Cd(BAc)2 was prepared following modified literature methods.91 BAc (10 mmol) was dissolved in methanol (200 mL) with the addition of TMAH solution (~3 mL), followed by sonication and stirring for 15 min until complete dissolution of BAc. The solution was then centrifuged, and the colorless supernatant was transferred to a beaker and stirred at 60 °C until the odor of TMAH disappeared. In a separate beaker, CdCl2 (5 mmol) was dissolved in a mixture of methanol and water (20 mL, methanol:water = 4:1) and then added dropwise to the BAc solution during vigorous stirring. The reaction mixture was stirred for an additional hour, and the white Cd(BAc)2 precipitate was then collected by vacuum filtration and washed repeatedly with methanol on a filter funnel. The product was dried overnight on the funnel under air.
Mercury Octanethiolate Synthesis.
Mercury octanethiolate, Hg(OT)2, was synthesized following modified literature methods.53 Hg(Ac)2 (2 mmol) was dissolved in methanol (100 mL), filtered, and then added dropwise to a solution of OT (6 mmol) and KOH (6 mmol) in methanol (100 mL) with vigorous stirring. The resulting white Hg(OT)2 precipitate was collected by vacuum filtration and washed repeatedly with methanol before drying overnight under air.
CdSe Core Synthesis.
CdSe cores were synthesized following a previously reported protocol.92 Cd(BAc)2 (140 mg), SeO2 (24 mg), HDD (50 mg), and ODE (5 mL) were added to a 25 mL round-bottom flask, which was degassed at ~120 °C for 1 h. Then the temperature of the solution was raised to 240 °C at a rate of ~20 °C min−1 under nitrogen. After reaching 240 °C, the reaction was allowed to proceed for 1 h, after which the mixture was cooled to ~100 °C, and OAc (1 mL) was injected into the reaction flask. After cooling to room temperature, the crude solution was transferred to a 50 mL centrifuge tube, and the CdSe QDs were precipitated by addition of methanol (5 mL) and acetone (25 mL). After centrifugation, the QDs were redispersed in hexane (5 mL) and again precipitated with methanol and acetone. Finally, the pellet was washed with several milliliters of acetone to ensure complete removal of methanol and then dispersed in hexane. The purified CdSe cores exhibited a first exciton absorption band at 579 nm and fluorescence emission band at 590 nm.
HgxCd1−xSe Synthesis by Mercury Exchange.
A dispersion of CdSe QDs (~100 nmol) in hexane (~2 mL) was mixed with OLA (1 mL) and ODE (5 mL) under nitrogen. Hexane was evaporated completely under vacuum at 50 °C and returned to a nitrogen atmosphere. OT (20 μL) was then added to the reaction mixture followed by a solution of Hg(Ac)2 (0.075–0.150 mmol) in OLA (1 mL). The cation exchange reaction was monitored spectrophoto-metrically while gradually increasing the reaction temperature to 120 °C, with mercury incorporation tuned by both the temperature (50–120 °C) and the time (0–60 min). Once the desired red shift was achieved, OT (300 μL) was swiftly injected to quench the reaction and the mixture was cooled to room temperature. The brown/black dispersion containing HgxCd1−xSe QDs was transferred to a 50 mL centrifuge tube and the QDs were precipitated by addition of methanol (15 mL) and acetone (25 mL). After centrifugation, the precipitate was dispersed in hexane (15 mL) and incubated without stirring for ~15 min. The solution was centrifuged again, and the precipitate was discarded. OLA (200 μL) and OAc (400 μL) were added to the supernatant, and the mixture was vortexed for ~2 min. The QDs were precipitated again with the addition of methanol (~35 mL), centrifuged, and dispersed in a mixture of hexane (15 mL), OLA (200 μL), and OAc (400 μL). The QDs were precipitated and redispersed in this manner at least 5 times to eliminate remaining unreacted mercury salts. Without doing so, shell growth in the following steps led to multiple emission bands due to new nucleation of mercury chalcogenide nanocrystals (Figure S7). Finally, the HgxCd1−xSe QDs were dispersed in hexane (2 mL) without OLA or OAc. Note that the quantity of OT has an important impact on the cation exchange process, as OT binds with high affnity to the nanocrystal surface. OT is necessary to prevent Ostwald ripening, resulting in asymmetric emission bands with low QY when it is absent (Figure S8), but strongly inhibits cation exchange when it is in excess.
Shell Growth Precursors.
Precursor solutions for cadmium, zinc, and mercury with 0.1 M concentration were prepared by dissolving Cd(Ac)2·2H2O, Zn(Ac)2, or Hg(OT)2, respectively, in OLA with sonication under nitrogen. A sulfur precursor solution with 0.1 M concentration was prepared by dissolving sulfur in ODE under nitrogen, using repeated cycles of vortexing and gentle heating with a heat gun.
Epitaxial HgxCd1−xS Deposition.
In a typical reaction to synthesize QDs emitting at 1360 nm, a purified hexane dispersion of HgxCd1−xSe QDs (50 nmol) was prepared as described above using 0.15 mmol of Hg(Ac)2 with 1 h of annealing at 120 °C. The QD suspension was then transferred to a 50 mL round-bottom flask with ODE (2 mL) and OLA (1 mL) and evacuated at 50 °C until hexane fully evaporated. Under nitrogen at 50 °C, the Hg(OT)2 precursor solution was added to the reaction mixture in a quantity corresponding to 0.1 monolayers (ML) of thickness of a HgxCd1−xS shell. The mixture was then heated to 120 °C, and the reaction was allowed to proceed for 5–10 min. The sulfur precursor was then added in an amount corresponding to 0.2 ML. After 10 min, the temperature was increased to 130 °C and 0.2 ML of the cadmium precursor was added. After 10 min of reaction, the solution was cooled to 50 °C and the process was repeated, with 0.1 ML mercury precursor added at 50 °C with ~10 min of reaction at 130 °C, 0.2 ML sulfur precursor added at 140 °C with ~10 min of reaction, and 0.2 ML cadmium precursor added at 150 °C with ~10 min of reaction. Finally, the temperature was reduced to 50 °C, 0.2 ML of mercury precursor was added, and the temperature was raised to 150 °C for ~10 min. Note that in these reactions, maintaining an excess of cations and adding mercury precursors at low temperature are critical to avoid new nucleation.
Epitaxial CdxZn1−xS Deposition.
Layer-by-layer shell growth was performed using a modification of previous protocols.66 For (HgxCd1−xSe)HgyCd1−yS QDs, shell growth was performed on QDs after cation exchange without purification. For QDs without a HgyCd1−yS shell, purified HgxCd1−xSe cores (50 nmol) in hexane (2 mL) were transferred to a 50 mL round-bottom flask with ODE (2 mL) and OLA (1 mL), and the mixture was evacuated at 50 °C until the hexane evaporated entirely, at which point the atmosphere was switched to nitrogen. In all cases, shell growth was initiated at 120 °C and layers were grown in 0.8 ML increments beginning with the dropwise addition of the sulfur precursor over 3–5 min followed by 15 min of reaction. Next, the same amount of cadmium precursor was added in a similar manner and allowed to react for 15 min to complete the first 0.8 ML of CdS shell growth. The reaction temperature was raised by ~10 °C between each precursor addition until reaching a maximum of ~190 °C. After each cycle of growth, an aliquot (20 μL) was collected and diluted 100-fold in hexane to measure the absorption and emission spectra. The shell growth process was repeated until growing 2–3 ML of CdS shell for HgxCd1−xSe cores or 0.8 ML of CdS for (HgxCd1−xSe)HgyCd1−yS cores. In both cases, 1.6 ML of ZnS was grown after the CdS shell using the zinc and sulfur precursors. Finally, the reaction was cooled to room temperature, and the QDs were purified by precipitation with methanol and acetone before dispersion in hexane.
Supplementary Material
Figure 3.
Progression of VIR-QD optical properties during a typical synthesis. (a) Absorption coeffcient (ϵ) spectra show CdSe cores (red), HgxCd1−xSe resulting from cation exchange (brown), and (HgxCd1−xSe)HgyCd1−yS/CdzZn1−zS VIR-QDs (yellow). Calculation methods are described in the Supporting Methods. (b) Photo-luminescence (PL) spectra of the QDs in panel a, plotted in arbitrary units and normalized at the band maxima. au = arbitrary units.
■ ACKNOWLEDGMENTS
This work was supported by funds from the National Institutes of Health (R01NS100019 and R01NS097610 to P.R.S. and A.M.S.; R01GM131272 to A.M.S.) and the National Science Foundation (PHY 1430124 to P.R.S.). P.L. was supported by the National Institute of Biomedical Imaging and Bioengineering of the National Institutes of Health under Award Number T32EB019944 and the National Science Foundation Grant 0965918 IGERT: Training the Next Generation of Researchers in Cellular and Molecular Mechanics and Bio-Nanotechnology. J.G. was supported by the Beckman Institute for Advanced Science and Technology in the form of a postdoctoral fellowship.
Footnotes
Supporting Information
The Supporting Information is available free of charge at https://pubs.acs.org/doi/10.1021/jacs.9b11567.
Supporting methods; TEM characterization CdSe nanocrystal aggregation due to prolonged mercury exchange; TEM characterization of heterogeneous nucleation during HgxCd1−xS shell growth; emission filters used to collect cell and tissue images; dependence of single-QD point spread function size on emission wavelength; cytotoxicity measurements; fibrillar patterns in tubulin immunostains; optical spectra dependence on HgxCd1−xSe core purification; optical spectra dependence on octanethiol during mercury exchange; elemental analysis of VIR-QDs; emission band widths for VIR-QDs; quantum yields of VIR-QDs; VIR-QD hydro-dynamic diameters measured by dynamic light scattering; supporting references (PDF)
Complete contact information is available at: https://pubs.acs.org/10.1021/jacs.9b11567
The authors declare no competing financial interest.
Contributor Information
Junlong Geng, Micro and Nanotechnology Laboratory and Beckman Institute for Advanced Science and Technology, University of Illinois at Urbana–Champaign, Urbana, Illinois 61801, United States.
Yang Liu, Department of Bioengineering and Micro and Nanotechnology Laboratory, University of Illinois at Urbana–Champaign, Urbana, Illinois 61801, United States;.
Zhiyuan Han, Micro and Nanotechnology Laboratory and Department of Materials Science and Engineering, University of Illinois at Urbana–Champaign, Urbana, Illinois 61801, United States.
Mohammad U. Zahid, Department of Bioengineering and Micro and Nanotechnology Laboratory, University of Illinois at Urbana–Champaign, Urbana, Illinois 61801, United States
Duncan Nall, Department of Physics and Center for the Physics of Living Cells, University of Illinois at Urbana–Champaign, Urbana, Illinois 61801, United States.
Yeoan Youn, Center for the Physics of Living Cells and Center for Biophysics and Quantitative Biology, University of Illinois at Urbana–Champaign, Urbana, Illinois 61801, United States.
Paul R. Selvin, Department of Physics, Center for the Physics of Living Cells, and Center for Biophysics and Quantitative Biology, University of Illinois at Urbana–Champaign, Urbana, Illinois 61801, United States
Andrew M. Smith, Department of Bioengineering, Micro and Nanotechnology Laboratory, Department of Materials Science and Engineering, and Carl R. Woese Institute for Genomic Biology, University of Illinois at Urbana–Champaign, Urbana, Illinois 61801, United States; Carle Illinois College of Medicine, Urbana, Illinois 61801, United States
■ REFERENCES
- (1).Dean KM; Palmer AE Advances in fluorescence labeling strategies for dynamic cellular imaging. Nat. Chem. Biol 2014, 10, 512–523. [DOI] [PMC free article] [PubMed] [Google Scholar]
- (2).Chinen AB; Guan CM; Ferrer JR; Barnaby SN; Merkel TJ; Mirkin CA Nanoparticle probes for the detection of cancer biomarkers, cells, and tissues by fluorescence. Chem. Rev 2015, 115, 10530–10574. [DOI] [PMC free article] [PubMed] [Google Scholar]
- (3).Zhu H; Fan J; Du J; Peng X Fluorescent probes for sensing and imaging within specific cellular organelles. Acc. Chem. Res 2016, 49, 2115–2126. [DOI] [PubMed] [Google Scholar]
- (4).Specht EA; Braselmann E; Palmer AE A critical and comparative review of fluorescent tools for live-cell imaging. Annu. Rev. Physiol 2017, 79, 93–117. [DOI] [PubMed] [Google Scholar]
- (5).Li J-B; Liu H-W; Fu T; Wang R; Zhang X-B; Tan W Recent progress in small-molecule near-IR probes for bioimaging. Trends Chem. 2019, 1, 224–234. [DOI] [PMC free article] [PubMed] [Google Scholar]
- (6).Krutzik PO; Nolan GP Fluorescent cell barcoding in flow cytometry allows high-throughput drug screening and signaling profiling. Nat. Methods 2006, 3, 361–368. [DOI] [PubMed] [Google Scholar]
- (7).Ha T; Tinnefeld P Photophysics of fluorescent probes for single-molecule biophysics and super-resolution imaging. Annu. Rev. Phys. Chem 2012, 63, 595–617. [DOI] [PMC free article] [PubMed] [Google Scholar]
- (8).Yang B; Treweek JB; Kulkarni RP; Deverman BE; Chen CK; Lubeck E; Shah S; Cai L; Gradinaru V Single-cell phenotyping within transparent intact tissue through whole-body clearing. Cell 2014, 158, 945–958. [DOI] [PMC free article] [PubMed] [Google Scholar]
- (9).Giepmans BNG; Adams SR; Ellisman MH; Tsien RY The fluorescent toolbox for assessing protein location and function. Science 2006, 312, 217–224. [DOI] [PubMed] [Google Scholar]
- (10).Vu TQ; Lam WY; Hatch EW; Lidke DS Quantum dots for quantitative imaging: from single molecules to tissue. Cell Tissue Res. 2015, 360, 71–86. [DOI] [PMC free article] [PubMed] [Google Scholar]
- (11).Bilan R; Nabiev I; Sukhanova A Quantum dot-based nanotools for bioimaging, diagnostics, and drug delivery. Chem-BioChem 2016, 17, 2103–2114. [DOI] [PubMed] [Google Scholar]
- (12).Kovtun O; Tomlinson ID; Bailey DM; Thal LB; Ross EJ; Harris L; Frankland MP; Ferguson RS; Glaser Z; Greer J t.; Rosenthal, S. J. Single quantum dot tracking illuminates neuroscience at the nanoscale. Chem. Phys. Lett 2018, 706, 741–752. [DOI] [PMC free article] [PubMed] [Google Scholar]
- (13).Small A; Stahlheber S Fluorophore localization algorithms for super-resolution microscopy. Nat. Methods 2014, 11, 267–279. [DOI] [PubMed] [Google Scholar]
- (14).Sigal YM; Zhou R; Zhuang X Visualizing and discovering cellular structures with super-resolution microscopy. Science 2018, 361, 880–887. [DOI] [PMC free article] [PubMed] [Google Scholar]
- (15).Achimovich AM; Ai H; Gahlmann A Enabling technologies in super-resolution fluorescence microscopy: reporters, labeling, and methods of measurement. Curr. Opin. Struct. Biol 2019, 58, 224–232. [DOI] [PMC free article] [PubMed] [Google Scholar]
- (16).Wang L; Frei MS; Salim A; Johnsson K Small-molecule fluorescent probes for live-cell super-resolution microscopy. J. Am. Chem. Soc 2019, 141, 2770–2781. [DOI] [PubMed] [Google Scholar]
- (17).Liu Z; Lavis LD; Betzig E Imaging live-cell dynamics and structure at the single-molecule level. Mol. Cell 2015, 58, 644–659. [DOI] [PubMed] [Google Scholar]
- (18).Wu B; Buxbaum AR; Katz ZB; Yoon YJ; Singer RH Quantifying protein-mRNA interactions in single live cells. Cell 2015, 162, 211–220. [DOI] [PMC free article] [PubMed] [Google Scholar]
- (19).Shen H; Tauzin LJ; Baiyasi R; Wang WX; Moringo N; Shuang B; Landes CF Single particle tracking: from theory to biophysical applications. Chem. Rev 2017, 117, 7331–7376. [DOI] [PubMed] [Google Scholar]
- (20).Tynan CJ; Clarke DT; Coles BC; Rolfe DJ; Martin-Fernandez ML; Webb SED Multicolour single molecule imaging in cells with near infra-red dyes. PLoS One 2012, 7, e36265. [DOI] [PMC free article] [PubMed] [Google Scholar]
- (21).Richardson DS; Lichtman JW Clarifying tissue clearing. Cell 2015, 162, 246–257. [DOI] [PMC free article] [PubMed] [Google Scholar]
- (22).Wizenty J; Ashraf MI; Rohwer N; Stockmann M; Weiss S; Biebl M; Pratschke J; Aigner F; Wuensch T Autofluorescence: A potential pitfall in immunofluorescence-based inflammation grading. J. Immunol. Methods 2018, 456, 28–37. [DOI] [PubMed] [Google Scholar]
- (23).Soderberg O; Gullberg M; Jarvius M; Ridderstrale K; Leuchowius KJ; Jarvius J; Wester K; Hydbring P; Bahram F; Larsson LG; Landegren U Direct observation of individual endogenous protein complexes in situ by proximity ligation. Nat. Methods 2006, 3, 995–1000. [DOI] [PubMed] [Google Scholar]
- (24).Larsson C; Grundberg I; Soderberg O; Nilsson M In situ detection and genotyping of individual mRNA molecules. Nat. Methods 2010, 7, 395–397. [DOI] [PubMed] [Google Scholar]
- (25).Hou X; Cheng W Detection of single fluorescent proteins inside eukaryotic cells using two-photon fluorescence. Biomed. Opt. Express 2012, 3, 340–353. [DOI] [PMC free article] [PubMed] [Google Scholar]
- (26).Wang F; Wen S; He H; Wang B; Zhou Z; Shimoni O; Jin D Microscopic inspection and tracking of single upconversion nanoparticles in living cells. Light: Sci. Appl 2018, 7, 18007. [DOI] [PMC free article] [PubMed] [Google Scholar]
- (27).Bouccara S; Fragola A; Giovanelli E; Sitbon G; Lequeux N; Pons T; Loriette V Time-gated cell imaging using long lifetime near-infrared-emitting quantum dots for autofluorescence rejection. J. Biomed. Opt 2014, 19, 051208. [DOI] [PubMed] [Google Scholar]
- (28).Moffitt JR; Hao J; Bambah-Mukku D; Lu T; Dulac C; Zhuang X High-performance multiplexed fluorescence in situ hybridization in culture and tissue with matrix imprinting and clearing. Proc. Natl. Acad. Sci. U. S. A 2016, 113, 14456–14461. [DOI] [PMC free article] [PubMed] [Google Scholar]
- (29).Le P; Lim SJ; Baculis BC; Chung HJ; Kilian KA; Smith AM Counting growth factors in single cells with infrared quantum dots to measure discrete stimulation distributions. Nat. Commun 2019, 10, 909. [DOI] [PMC free article] [PubMed] [Google Scholar]
- (30).Bremer C; Ntziachristos V; Weissleder R Optical-based molecular imaging: contrast agents and potential medical applications. Eur. Radiol 2003, 13, 231–243. [DOI] [PubMed] [Google Scholar]
- (31).Rurack K; Spieles M Fluorescence quantum yields of a series of red and near-infrared dyes emitting at 600–1000 nm. Anal. Chem 2011, 83, 1232–1242. [DOI] [PubMed] [Google Scholar]
- (32).Luo SL; Zhang EL; Su YP; Cheng TM; Shi CM A review of NIR dyes in cancer targeting and imaging. Biomaterials 2011, 32, 7127–7138. [DOI] [PubMed] [Google Scholar]
- (33).Hong G; Antaris AL; Dai H Near-infrared fluorophores for biomedical imaging. Nat. Biomed. Engr 2017, 1, 0010. [Google Scholar]
- (34).Ghosh S; Bachilo SM; Simonette RA; Beckingham KM; Weisman RB Oxygen doping modifies near-infrared band gaps in Fluorescent single-walled carbon nanotubes. Science 2010, 330, 1656–1659. [DOI] [PubMed] [Google Scholar]
- (35).Welsher K; Sherlock SP; Dai H Deep-tissue anatomical imaging of mice using carbon nanotube fluorophores in the second near-infrared window. Proc. Natl. Acad. Sci. U. S. A 2011, 108, 8943–8948. [DOI] [PMC free article] [PubMed] [Google Scholar]
- (36).Robinson JT; Hong G; Liang Y; Zhang B; Yaghi OK; Dai H In vivo fluorescence imaging in the second near-infrared window with long circulating carbon nanotubes capable of ultrahigh tumor uptake. J. Am. Chem. Soc 2012, 134, 10664–10669. [DOI] [PMC free article] [PubMed] [Google Scholar]
- (37).Iverson NM; Barone PW; Shandell M; Trudel LJ; Sen S; Sen F; Ivanov V; Atolia E; Farias E; McNicholas TP; Reuel N; Parry NMA; Wogan GN; Strano MS In vivo biosensing via tissue-localizable near-infrared-fluorescent single-walled carbon nanotubes. Nat. Nanotechnol 2013, 8, 873–880. [DOI] [PMC free article] [PubMed] [Google Scholar]
- (38).Dang X; Gu L; Qi J; Correa S; Zhang G; Belcher AM; Hammond PT Layer-by-layer assembled fluorescent probes in the second near-infrared window for systemic delivery and detection of ovarian cancer. Proc. Natl. Acad. Sci. U. S. A 2016, 113, 5179–5184. [DOI] [PMC free article] [PubMed] [Google Scholar]
- (39).Godin AG; Varela JA; Gao Z; Danne N; Dupuis JP; Lounis B; Groc L; Cognet L Single-nanotube tracking reveals the nanoscale organization of the extracellular space in the live brain. Nat. Nanotechnol 2017, 12, 238–243. [DOI] [PubMed] [Google Scholar]
- (40).Wang P; Fan Y; Lu L; Liu L; Fan L; Zhao M; Xie Y; Xu C; Zhang F NIR-II nanoprobes in-vivo assembly to improve image-guided surgery for metastatic ovarian cancer. Nat. Commun 2018, 9, 2898. [DOI] [PMC free article] [PubMed] [Google Scholar]
- (41).Zhang M; Yue J; Cui R; Ma Z; Wan H; Wang F; Zhu S; Zhou Y; Kuang Y; Zhong Y; Pang D-W; Dai H Bright quantum dots emitting at ~ 1,600 nm in the NIR-IIb window for deep tissue fluorescence imaging. Proc. Natl. Acad. Sci. U. S. A 2018, 115, 6590–6595. [DOI] [PMC free article] [PubMed] [Google Scholar]
- (42).Wan H; Yue J; Zhu S; Uno T; Zhang X; Yang Q; Yu K; Hong G; Wang J; Li L; Ma Z; Gao H; Zhong Y; Su J; Antaris AL; Xia Y; Luo J; Liang Y; Dai H A bright organic NIR-II nanofluorophore for three-dimensional imaging into biological tissues. Nat. Commun 2018, 9, 1171. [DOI] [PMC free article] [PubMed] [Google Scholar]
- (43).Miao Q; Xie C; Zhen X; Lyu Y; Duan H; Liu X; Jokerst JV; Pu K Molecular afterglow imaging with bright, biodegradable polymer nanoparticles. Nat. Biotechnol 2017, 35, 1102–1110. [DOI] [PubMed] [Google Scholar]
- (44).Harris DK; Allen PM; Han HS; Walker BJ; Lee JM; Bawendi MG Synthesis of cadmium arsenide quantum dots luminescent in the infrared. J. Am. Chem. Soc 2011, 133, 4676–4679. [DOI] [PubMed] [Google Scholar]
- (45).Zhong Y; Ma Z; Zhu S; Yue J; Zhang M; Antaris AL; Yuan J; Cui R; Wan H; Zhou Y; Wang W; Huang NF; Luo J; Hu Z; Dai H Boosting the down-shifting luminescence of rare-earth nanocrystals for biological imaging beyond 1500 nm. Nat. Commun 2017, 8, 737. [DOI] [PMC free article] [PubMed] [Google Scholar]
- (46).Yang T; Tang Y. a.; Liu L; Lv X; Wang Q; Ke H; Deng Y; Yang H; Yang X; Liu G; Zhao Y; Chen H Size-dependent Ag2S nanodots for second near-infrared fluorescence/photoacoustics imaging and simultaneous photothermal therapy. ACS Nano 2017, 11, 1848–1857. [DOI] [PubMed] [Google Scholar]
- (47).Welsher K; Liu Z; Sherlock SP; Robinson JT; Chen Z; Daranciang D; Dai H A route to brightly fluorescent carbon nanotubes for near infrared imaging in mice. Nat. Nanotechnol 2009, 4, 773–780. [DOI] [PMC free article] [PubMed] [Google Scholar]
- (48).Franke D; Harris DK; Chen O; Bruns OT; Carr JA; Wilson MWB; Bawendi MG Continuous injection synthesis of indium arsenide quantum dots emissive in the short-wavelength infrared. Nat. Commun 2016, 7, 12749. [DOI] [PMC free article] [PubMed] [Google Scholar]
- (49).Bruns OT; Bischof TS; Harris DK; Franke D; Shi Y; Riedemann L; Bartelt A; Jaworski FB; Carr JA; Rowlands CJ; Wilson MWB; Chen O; Wei H; Hwang GW; Montana DM; Coropceanu I; Achorn OB; Kloepper J; Heeren J; So PTC; Fukumura D; Jensen KF; Jain RK; Bawendi MG Next-generation in vivo optical imaging with short-wave infrared quantum dots. Nat. Biomed. Engr 2017, 1, 0056. [DOI] [PMC free article] [PubMed] [Google Scholar]
- (50).Du H; Chen CL; Krishnan R; Krauss TD; Harbold JM; Wise FW; Thomas MG; Silcox J Optical properties of colloidal PbSe nanocrystals. Nano Lett. 2002, 2, 1321–1324. [Google Scholar]
- (51).Allen PM; Bawendi M Ternary I-III-VI quantum dots luminescent in the red to near-infrared. J. Am. Chem. Soc 2008, 130, 9240–9241. [DOI] [PMC free article] [PubMed] [Google Scholar]
- (52).Yarema M; Pichler S; Sytnyk M; Seyrkammer R; Lechner RT; Fritz-Popovski G; Jarzab D; Szendrei K; Resel R; Korovyanko O; Loi MA; Paris O; Hesser G; Heiss W Infrared emitting and photoconducting colloidal silver chalcogenide nanocrystal quantum dots from a silylamide-promoted synthesis. ACS Nano 2011, 5, 3758–3765. [DOI] [PubMed] [Google Scholar]
- (53).Smith AM; Nie S Bright and compact alloyed quantum dots with broadly tunable near-infrared absorption and fluorescence spectra through mercury cation exchange. J. Am. Chem. Soc 2011, 133, 24–26. [DOI] [PMC free article] [PubMed] [Google Scholar]
- (54).Chen G; Ohulchanskyy TY; Liu S; Law WC; Wu F; Swihart MT; Agren H; Prasad PN Core/shell NaGdF4 :Nd3+ / NaGdF4 nanocrystals with efficient near-infrared to near-infrared downconversion photoluminescence for bioimaging applications. ACS Nano 2012, 6, 2969–2977. [DOI] [PMC free article] [PubMed] [Google Scholar]
- (55).Miao S; Hickey SG; Waurisch C; Lesnyak V; Otto T; Rellinghaus B; Eychmuller A Synthesis of monodisperse cadmium phosphide nanoparticles using ex-situ produced phosphine. ACS Nano 2012, 6, 7059–7065. [DOI] [PubMed] [Google Scholar]
- (56).Reinhart CC; Johansson E Colloidal 3-mercaptopropionic acid capped lead sulfide quantum dots in a low boiling point solvent. J. Am. Chem. Soc 2017, 139, 5827–5835. [DOI] [PubMed] [Google Scholar]
- (57).Weissleder R A clearer vision for in vivo imaging. Nat. Biotechnol 2001, 19, 316–317. [DOI] [PubMed] [Google Scholar]
- (58).Smith AM; Mancini MC; Nie SM Second window for in vivo imaging. Nat. Nanotechnol 2009, 4, 710–711. [DOI] [PMC free article] [PubMed] [Google Scholar]
- (59).Lim SJ; Ma L; Schleife A; Smith AM Quantum dot surface engineering: toward inert fluorophores with compact size and bright, stable emission. Coord. Chem. Rev 2016, 320–321, 216–237. [DOI] [PMC free article] [PubMed] [Google Scholar]
- (60).Cai E; Ge P; Lee SH; Jeyifous O; Wang Y; Liu Y; Wilson KM; Lim SJ; Baird MA; Stone JE; Lee KY; Davidson MW; Chung HJ; Schulten K; Smith AM; Green WN; Selvin PR Stable small quantum dots for synaptic receptor tracking on live neurons. Angew. Chem., Int. Ed 2014, 53, 12484–12488. [DOI] [PMC free article] [PubMed] [Google Scholar]
- (61).Liu Y; Le P; Lim SJ; Ma L; Sarkar S; Han Z; Murphy SJ; Kosari F; Vasmatzis G; Cheville JC; Smith AM Enhanced mRNA FISH with compact quantum dots. Nat. Commun 2018, 9, 4461. [DOI] [PMC free article] [PubMed] [Google Scholar]
- (62).Regulacio MD; Han MY Composition-tunable alloyed semiconductor nanocrystals. Acc. Chem. Res 2010, 43, 621–630. [DOI] [PubMed] [Google Scholar]
- (63).Hollingsworth JA Semiconductor Nanocrystal Quantum Dots Encyclopedia of Inorganic and Bioinorganic Chemistry, Scott RA, Ed.; Wiley, 2011. [Google Scholar]
- (64).Reiss P; Protiere M; Li L Core/shell semiconductor nanocrystals. Small 2009, 5, 154–168. [DOI] [PubMed] [Google Scholar]
- (65).Ma L; Tu C; Le P; Chitoor S; Lim SJ; Zahid MU; Teng KW; Ge P; Selvin PR; Smith AM Multidentate polymer coatings for compact and homogeneous quantum dots with efficient bioconjugation. J. Am. Chem. Soc 2016, 138, 3382–3394. [DOI] [PubMed] [Google Scholar]
- (66).Lim SJ; Zahid MU; Le P; Ma L; Entenberg D; Harney AS; Condeelis JS; Smith AM Brightness-equalized quantum dots. Nat. Commun 2015, 6, 8210. [DOI] [PMC free article] [PubMed] [Google Scholar]
- (67).Keuleyan S; Lhuillier E; Guyot-Sionnest P Synthesis of colloidal HgTe quantum dots for narrow mid-IR emission and detection. J. Am. Chem. Soc 2011, 133, 16422–16424. [DOI] [PubMed] [Google Scholar]
- (68).Kuno M; Higginson KA; Qadri SB; Yousuf M; Lee SH; Davis BL; Mattoussi H Molecular clusters of binary and ternary mercury chalcogenides: Colloidal synthesis, characterization, and optical spectra. J. Phys. Chem. B 2003, 107, 5758–5767. [Google Scholar]
- (69).Xie RG; Kolb U; Li JX; Basche T; Mews A Synthesis and characterization of highly luminescent CdSe-Core CdS/ Zn0.5Cd0.5S/ZnS multishell nanocrystals. J. Am. Chem. Soc 2005, 127, 7480–7488. [DOI] [PubMed] [Google Scholar]
- (70).Hong G; Zou Y; Antaris AL; Diao S; Wu D; Cheng K; Zhang X; Chen C; Liu B; He Y; Wu JZ; Yuan J; Zhang B; Tao Z; Fukunaga C; Dai H Ultrafast fluorescence imaging in vivo with conjugated polymer fluorophores in the second near-infrared window. Nat. Commun 2014, 5, 4206. [DOI] [PubMed] [Google Scholar]
- (71).Antaris AL; Chen H; Cheng K; Sun Y; Hong G; Qu C; Diao S; Deng Z; Hu X; Zhang B; Zhang X; Yaghi OK; Alamparambil ZR; Hong X; Cheng Z; Dai H A small-molecule dye for NIR-II imaging. Nat. Mater 2016, 15, 235. [DOI] [PubMed] [Google Scholar]
- (72).Zhu Z-J; Yeh Y-C; Tang R; Yan B; Tamayo J; Vachet RW; Rotello VM Stability of quantum dots in live cells. Nat. Chem 2011, 3, 963–968. [DOI] [PMC free article] [PubMed] [Google Scholar]
- (73).Cremer C; Masters BR Resolution enhancement techniques in microscopy. Eur. Phys. J. H 2013, 38, 281–344. [Google Scholar]
- (74).Nakai K; Hung MC; Yamaguchi H A perspective on anti-EGFR therapies targeting triple-negative breast cancer. Am. J. Cancer Res 2016, 6, 1609–1623. [PMC free article] [PubMed] [Google Scholar]
- (75).Capuani F; Conte A; Argenzio E; Marchetti L; Priami C; Polo S; Di Fiore PP; Sigismund S; Ciliberto A Quantitative analysis reveals how EGFR activation and downregulation are coupled in normal but not in cancer cells. Nat. Commun 2015, 6, 7999. [DOI] [PMC free article] [PubMed] [Google Scholar]
- (76).Zandi R; Larsen AB; Andersen P; Stockhausen MT; Poulsen HS Mechanisms for oncogenic activation of the epidermal growth factor receptor. Cell. Signalling 2007, 19, 2013–2023. [DOI] [PubMed] [Google Scholar]
- (77).Stewart EL; Tan SZ; Liu G; Tsao MS Known and putative mechanisms of resistance to EGFR targeted therapies in NSCLC patients with EGFR mutations – a review. Transl. Lung Cancer Res 2015, 4, 67–81. [DOI] [PMC free article] [PubMed] [Google Scholar]
- (78).Baskin JM; Prescher JA; Laughlin ST; Agard NJ; Chang PV; Miller IA; Lo A; Codelli JA; Bertozzi CR Copper-free click chemistry for dynamic in vivo imaging. Proc. Natl. Acad. Sci. U. S. A 2007, 104, 16793–16797. [DOI] [PMC free article] [PubMed] [Google Scholar]
- (79).Chou KF; Dennis AM Forster resonance energy transfer between quantum dot donors and quantum dot acceptors. Sensors 2015, 15, 13288–13325. [DOI] [PMC free article] [PubMed] [Google Scholar]
- (80).Bucio L; Souza V; Albores A; Sierra A; Chavez E; Carabez A; Guiterrez-Ruiz MC Cadmium and mercury toxicity in a human fetal hepatic cell line (WRL-68 cells). Toxicology 1995, 102, 285–299. [DOI] [PubMed] [Google Scholar]
- (81).Han SG; Castranova V; Vallyathan V Comparative cytotoxicity of cadmium and mercury in a human bronchial epithelial cell line (BEAS-2B) and its role in oxidative stress and induction of heat shock protein 70. J. Toxicol. Environ. Health, Part A 2007, 70, 852–860. [DOI] [PubMed] [Google Scholar]
- (82).Strubelt O; Kremer J; Tilse A; Keogh J; Pentz R Comparative studies on the toxicity of mercury, cadmium, and copper toward the isolated perfused rat liver. J. Toxicol. Environ. Health 1996, 47, 267–283. [DOI] [PubMed] [Google Scholar]
- (83).Chen KH; Boettiger AN; Moffitt JR; Wang S; Zhuang X Spatially resolved, highly multiplexed RNA profiling in single cells. Science 2015, 348, aaa6090. [DOI] [PMC free article] [PubMed] [Google Scholar]
- (84).Shah S; Lubeck E; Schwarzkopf M; He TF; Greenbaum A; Sohn CH; Lignell A; Choi HM; Gradinaru V; Pierce NA; Cai L Single-molecule RNA detection at depth by hybridization chain reaction and tissue hydrogel embedding and clearing. Development 2016, 143, 2862–2867. [DOI] [PMC free article] [PubMed] [Google Scholar]
- (85).Trcek T; Chao JA; Larson DR; Park HY; Zenklusen D; Shenoy SM; Singer RH Single-mRNA counting using fluorescent in situ hybridization in budding yeast. Nat. Protoc 2012, 7, 408–419. [DOI] [PMC free article] [PubMed] [Google Scholar]
- (86).Monici M Cell and tissue autofluorescence research and diagnostic applications. Biotechnol. Annu. Rev 2005, 11, 227–256. [DOI] [PubMed] [Google Scholar]
- (87).Kronvall G; Frommel D Definition of staphylococcal protein A reactivity for human immunoglobulin G fragments. Immunochemistry 1970, 7, 124–127. [DOI] [PubMed] [Google Scholar]
- (88).Lai HM; Liu AKL; Ng HHM; Goldfinger MH; Chau TW; DeFelice J; Tilley BS; Wong WM; Wu W; Gentleman SM Next generation histology methods for three-dimensional imaging of fresh and archival human brain tissues. Nat. Commun 2018, 9, 1066. [DOI] [PMC free article] [PubMed] [Google Scholar]
- (89).Kajimura J; Ito R; Manley NR; Hale LP Optimization of single- and dual-color immunofluorescence protocols for formalin-fixed, paraffin-embedded archival tissues. J. Histochem. Cytochem 2016, 64, 112–124. [DOI] [PMC free article] [PubMed] [Google Scholar]
- (90).Liu R; Liu Y; Liu S; Wang Y; Li K; Li N; Xu D; Zeng Q Three-dimensional superresolution imaging of the FtsZ ring during cell division of the cyanobacterium Prochlorococcus. mBio 2017, 8, e00657. [DOI] [PMC free article] [PubMed] [Google Scholar]
- (91).Chen O; Chen X; Yang Y; Lynch J; Wu H; Zhuang J; Cao YC Synthesis of metal-selenide nanocrystals using selenium dioxide as the selenium precursor. Angew. Chem., Int. Ed 2008, 47, 8638–8641. [DOI] [PubMed] [Google Scholar]
- (92).Greytak AB; Allen PM; Liu WH; Zhao J; Young ER; Popovic Z; Walker BJ; Nocera DG; Bawendi MG Alternating layer addition approach to CdSe/CdS core/shell quantum dots with near-unity quantum yield and high on-time fractions. Chem. Sci 2012, 3, 2028–2034. [DOI] [PMC free article] [PubMed] [Google Scholar]
Associated Data
This section collects any data citations, data availability statements, or supplementary materials included in this article.