

Abstract
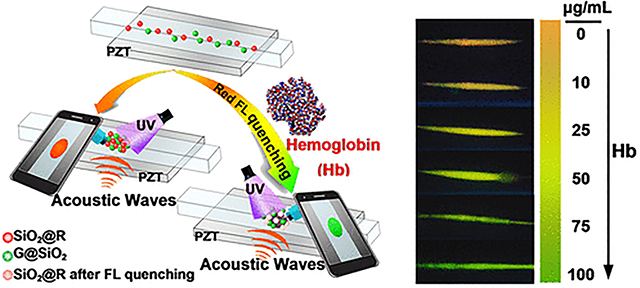
Acoustofluidic methods, with advantages including simplicity of device design, biocompatible manipulation, and low power consumption, have been touted as promising tools for point-of-care (POC) testing. Here, we report a cellphone-based acoustofluidic platform that uses acoustic radiation forces to enrich nanoscale analytes and red and green fluorescence nanoparticles (SiO2@R and G@SiO2) as probes for POC visual testing. Thus, the color signals from the fluorescent probes are enhanced, and colorimetric sensitivity is significantly improved. As a POC demonstration, the acoustofluidic platform is used to detect hemoglobin (Hb) from human blood, resulting in a rapid and straightforward measurement of normal blood Hb levels. Combining an acoustofluidic-based nanoparticle-concentration platform with cell-phone-based colorimetry, our method introduces a potential pathway toward practical POC testing.
Keywords: point-of-care testing, acoustofluidics, colorimetric, fluorescence nanoparticles, nanoparticles enrichment
Graphical Abstract
Point-of-care (POC) testing is a desirable approach to healthcare where clinical testing and analysis are performed at the patient bedside which enables rapid and efcient diagnostics by medical professionals or monitoring by patients themselves.1,2 It is well-known that POC testing has the potential to revolutionize global healthcare, especially in resource constrained or noncentralized settings, owing to the fact that prompt analysis reduces delays caused by clinical sample collection and storage and transport to a central laboratory for analysis and enables earlier disease diagnosis.3,4 All of these factors serve to improve patient care by reducing the time to diagnosis and lowering costs associated with testing as well as providing a more economical and expeditious start to treatment which improves overall patient outcomes. For these reasons, numerous POC diagnostic systems that allow for the assaying of analytes in complex samples have been developed. These platforms have been based on different technologies, such as lateral flow strips,5 optical biosensors,6 microfluidics,7 and many more.8,9 Many of these technologies share benefits such as miniaturization, portability, and disposability, but microfluidic solutions also provide accurate control/manipulation of liquids with small volumes.10 While this benefit may enable unique processing and analysis, the control of fluids and bioparticles inside fluids using traditional microfluidic methods (e.g., capillary forces, electric fields, pressure, or gravity) is generally limited to the microscale.11 In order to manipulate targets within the nanoscale, new technologies need to be integrated with microfluidics to develop POC tools and to healthcare where clinical testing and analysis are broaden their application in bioanalysis and medical diagnosis.
Acoustofluidic technologies, characterized as the fusion of acoustics and microfluidics, provide a solution to this shortcoming. They have attracted considerable attention due to their simple and compact device designs, contactless manipulation, low power consumption, and high biocompatibility.12–16 Over the past decade, advancements in microfluidic and microfabrication techniques have enabled acoustofluidic-based devices to be designed and employed for biomarker isolation,17,18 cell focusing,19–21 cell/nanoparticle separation,22–24 single-molecule analysis,25 and fluid/droplet/particle manipulation26–32 in the areas of bioanalysis and medical diagnostics. Difering from traditional bioanalysis and medical diagnoses, which occur in dedicated centralized laboratories and depend on bulky analytical instruments, most of acoustofluidic-based devices are miniaturized with reduced sample volume requirements and an overall reduction in device footprint. With these advantages, acoustofluidic technologies are emerging as promising tools especially for POC applications. In fact, various acoustofluidic platforms have been developed for potential use at the POC, such as a pumpless acoustofluidic platform for size-selective concentration and separation of microparticles,33 portable acoustofluidic chips for homogenizing and purifying stool samples,34 open source acoustofluidic systems for rotation and manipulation of cells and microorganisms,35 functionalized nanoparticle-assisted acoustofluidic traps for the detection of serum prostate-specific antigen,36 three-dimensional (3D) acoustofluidic tweezers for sorting microparticles and cells,37 and a surface acoustic wave-based nucleic acid testing platform for infectious disease diagnostics.38
However, in order to become practical POC tools, acoustofluidics-based diagnostic devices still face one practical challenge. Acoustofluidic platforms mainly provide for sample preparation or manipulation of micro/nanoscale objects, meaning that they cannot be implemented in POC settings by themselves. This usually means that additional downstream analytical techniques, based on expensive or bulky instrumentation, will still be required for quantitative characterization, signal readout, or medical testing.
To addresses the limitations of acoustofluidics techniques as analytical tool, in this article, we have developed a cell-phonebased acoustofluidic platform that can achieve POC analysis by integrating fluorescent colorimetric detection and cell phone camera-based imaging with acoustofluidic nanoparticle concentration. For colorimetric testing, red and green quantum dots (QDs)-embedded silica nanoparticles (SiO2@R and G@ SiO2) were synthesized and mixed with samples to function as target identifiers and interior labels, respectively. Acoustofluidic-based nanoparticle concentration was utilized to aggregate the QD-embedded nanoparticles in the viewing area and to enhance the intensity of the signals emitted from the QDs. This concentration step ensured that the relatively weak signal could be amplified and imaged using a low-cost and portable cell phone camera, removing the reliance on bulky and expensive optical equipment. Using our system, various colors in the red-green spectrum can be detected depending on the ratio of red and green probes. The ability to visualize this red-green spectrum was used to quantitatively measure the concentration of hemoglobin (Hb). The color at the concentrated spot of nanoparticles observed by a cell phone camera is proportional to the concentration of Hb because of the quenching of red fluorescence, while the green fluorescence remains unchanged regardless of the levels of Hb. This experimentally demonstrated that our platform has the potential to be used for rapid Hb analysis and diagnosis of diseases such as anemia. Although this is only one specific demonstration of the platform, our work in combining cellphone-based fluorescent colorimetric detection with acoustofluidic nanoparticle enrichment has overcome the limitations of previous acoustofluidic techniques with regards to POC diagnosis and provides a method of enhancing the fluorescent signal for quantitative fluorescent colorimetric detection. We believe that this acoustofluidic platform can be a foundation for many other POC testings.
RESULTS AND DISCUSSION
Mechanism of Acoustofluidic Assisted Colorimetric Analysis
The primary function of our device is to use fluorescent colorimetric measurements to determine the concentration of target analytes in a solution. To enable colorimetric-based visual testing in our platform, 600 nm SiO2-based red and green fluorescent probes were synthesized to establish a dual colorimetric fluorescence system. In this system, the red fluorescent probe (SiO2@R) is for sensing, and it has a fluorescent response to the target analyte. The green probe (G@SiO2) acts as an internal standard that is not responsive to the target analyte. When increasing the analyte concentration, the fluorescence of the sensing (red) probe will be quenched, while the standard (green) probe fluorescence will remain constant; as such, the ratio between red and green fluorescent intensities will decrease with an increase in concentration, resulting in a transitionary color evolution based on the target concentration. Even though the signal generation is a fairly straightforward process, the key challenge in this endeavor is visualizing the color change that occurs due to the presence of the target.
It is known that the fluorescence intensity emitted by a group of probes is proportional to their concentration in the medium. In general practice, high concentrations of the probes are usually needed to provide emission light that is strong enough to be easily observed by naked eyes. However, this also causes a decrease in the sensitivity of detection because more target sample is needed to cause the fluorescence change. In order to overcome this challenge, we developed and integrated an acoustofluidic nanoparticle concentration device (Figure 1A) with traditional fluorescent-probe-based testing. In this device a standing bulk acoustic waves (BAWs) with a pressure node at the center of the channel will cause the nanoparticles to aggregate. The nanoparticle concentration function of our chip will greatly improve the sensitivity of the colorimetric analysis because the emission fluorescent signal from concentrated probes will be intensified significantly compared to that from randomly distributed probes. As illustrated in the schematic Figure 1B, when SiO2@R and G@SiO2 nanoparticles are randomly distributed (left) in the capillary of the acoustofluidic chip, it is hard to observe the fluorescence that is emitted from the solution because of the low concentration of nanoparticles. In contrast, once the nanoparticle concentration function is initiated (right) by turning the standing BAWs on, fluorescent nanoparticles aggregate to form a cluster, and different colors can be observed depending on the ratio of red and green fluorescent intensities (Figure 1B, right). Moreover, the resultant color can be used as an indicator for quantifying the target analyte’s concentration, because the red fluorescent intensity of the colorimetric system is related to the concentration of the analyte to be determined. We experimentally verified that 600 nm SiO2 nanoparticles can be successfully aggregated at the center of the capillary once the acoustic waves were activated, as shown in Figure 1C. Further detail of the mechanism for acoustofluidic nanoparticle concentration will be provided below.
Figure 1.

Acoustofluidic-assisted colorimetric analysis. (A) Photo of the acoustofluidic nanoparticle-concentration device. (B) Illustration of visual testing using the acoustofluidic-based nanoparticle-concentration device. The red and green dots represent SiO2@R and G@SiO2 nanoparticles, respectively. With the acoustic signal activated (right), the particles will aggregate in the center of the channel, increasing the intensity of emitted fluorescence. (C) Characterization of the acoustofluidic-based nanoparticle-concentration performance for SiO2 nanoparticles using a microscope with 10× magnification lens when the acoustic transducer has been turned off (left) or on (right) for 2 min.
Acoustofluidic Device Mechanism and POC Platform Design
Figure 2A provides a schematic of the acoustofluidic chip, which is fabricated by bonding a square glass capillary onto the surface of a piezoelectric transducer (PZT). To efficiently generate a pressure node line along the center of the glass capillary (with the inner dimension d = 0.2 mm and the wall thickness of 0.10 mm) for concentrating particles, the acoustic wave frequency should be around 3.625 MHz (f 0 = cf/2d), where cf is the wave speed (~ 1450 m/s) in the fluid loaded in the capillary and d is the inner dimension of the capillary. Hence, we choose a PZT transducer (Steminc, USA) with dimension of 20 mm × 15 mm × 2.1 mm, which has a thickness-direction resonance mode around the frequency f 0 = 3.625 MHz. In our design (Figure 2A), the PZT with a glass capillary attached is mounted onto a glass slide (7.62 cm × 2.54 cm × 1 mm) with two small plastic spacers providing a gap between the PZT and the substrate. The spacers reduce the transmission of acoustic wave energy from the PZT into the glass slide so that the acoustofluidic chip can have a high quality factor at the resonance frequency. The phase curve measured by a network analyzer (VNA 2180) shows the quality factor is nearly 20.3 with the central frequency at fc = 3.361 MHz (Figure S1). The frequency identified by the network analyzer is close to the frequency f 0 = 3.625 MHz; hence, at the central frequency fc = 3.361 MHz, we expect the acoustofluidic chip can efficiently generate a pressure node line along the central of the capillary for concentrating particles.
Figure 2.

Schematics of the cell-phone-based acoustofluidic platform. (A) Schematic of the acoustofluidic device. (B) Simulation results showing the acoustic pressure in the fluid domain within the capillary as well as the displacement amplitude |uz| in the capillary wall. (C) 3D diagram of the portable cell-phone-based acoustofluidic platform.
When an excitation signal is applied to the PZT using a function generator (Tektronix, Model AFG3011C), the electrical energy will be converted to mechanical energy based on the piezoelectric effect. With an activation frequency of 3.361 MHz, the thickness-direction resonating mode of the PZT will be excited; a function generator was used to apply this frequency to the transducer in all experiments presented within this work unless otherwise noted. We would also like to note that although a commercial function generator was utilized in this work, the primary goal of this research was to demonstrate POC acoustofluidic testing and analysis as opposed to the POC operation of an acoustofluidic sample preparation device as shown in our previous work.39–41 Once generated, the acoustic waves travel along the z direction and transmit into the fluid in the glass capillary. Due to the confinement and reflection of acoustic waves at the capillary wall, strong standing BAWs will be formed in the capillary. The inner width of the capillary is 0.2 mm, so that only one pressure node line will be present at the center of the capillary. If there are particles suspended inside the capillary, they will experience an acoustic radiation force resulting from the scattering of the standing BAWs and a drag force induced by acoustic streaming. Particularly, for the nanoparticles used in this study, the acoustic radiation force dominates and the trajectories and positions of nanoparticles mainly depend on the distribution of the acoustic radiation force.
Finite element simulations were performed in Comsol Multiphysics to investigate the trajectories and positions of nanoparticles within the acoustofluidic device. A two-dimensional (2D) model (Figure S2A) of the acoustofluidic chip’s cross section in the y–z plane was used for investigating the pressure field, the acoustic radiation force field, and the particle trajectories. Moreover, our simulation model includes a piezoelectric module for the PZT transducer, a solid mechanic module for the UV epoxy and the glass capillary, and a pressure acoustic module for the fluid. Figure 2B and Figure S2B show the simulation results of the pressure field in the fluid domain and the displacement field in the solid domain at the designed frequency of 3.47 MHz. From the simulation results, it can be seen that a resonant mode in the z direction is excited with the minimum acoustic pressure occurring at the center of the capillary. This single low pressure node in the center of the channel serves as the trapping location for concentrating the nanoparticles. Figure S2D–I shows the phase-dependent variations of the displacement field uz in the capillary wall. The trajectories of 600 nm SiO2 nanoparticles in the fluid domain are given in Figure S2C. An animation of the motion of SiO2 nanoparticles is provided in Movie 1. From the simulation results, it can be seen that all nanoparticles move to the center of the capillary channel and finally aggregate at the center. With the proper mechanism for acoustofluidic nanoparticle concentration established, we next built a platform to house all of the components necessary for POC colorimetric testing.
Figure 2C provides a schematic of the cell-phone-based acoustofluidic platform, which has three key components: (1) an acoustofluidic chip for hosting the sample solution and enriching the fluorescent signal, (2) an ultraviolet (UV) light-emitting diode (LED) with a bandpass filter for providing uniform UV illumination with a peak wavelength at 365 nm, and (3) a cell phone with a 200× magnification lens for capturing fluorescence images of samples in the acoustofluidic chip. Each of these components were integrated into a compact 3D printed chamber (19 cm × 18.5 cm × 13 cm), which not only provides the darkroom to avoid the interference of environment light for fluorescence imaging but also allows for portable usage in the field. Photos of the platform can be found in Figure S3A.
Operation of the acoustofluidic platform has three key steps. The experimental setup in Figure S3B is used for describing the steps. First, the sample solution (200 μL) which includes the target analyte and fluorescent probes is injected into the acoustofluidic chip from the inlet using a syringe. Second, after the solution within capillary channel has stabilized, the acoustofluidic-based nanoparticle concentration function is activated by applying an excitation signal to the PZT. Third, after nanoparticles with fluorescent probes are concentrated, fluorescent images will be taken by the cell phone for detection and quantification of the target analyte. As a proof of concept, we use our platform to detect Hb levels in blood. The platform could also potentially be used for detecting other analytes by changing the colorimetric system.
Characterization of Ratiometric Fluorescent Probes
As explained briefly before, we utilized a dual-color ratiometric fluorescence system with two types of SiO2-based fluorescent probes, SiO2@R and G@SiO2 nanoparticles (Figure 3A), to enable colorimetric-based visual testing in our acoustofluidic platform. These two types of probes were synthesized by surface modification of 600 nm diameter SiO2 nanoparticles with red and green QDs, respectively.
Figure 3.

Preparation and characterization of colorimetric fluorescent probes. (A) Schematic illustrations of the synthesis of fluorescent probes: SiO2@R and G@SiO2 nanoparticles. TEM images of (B) SiO2 nanoparticles, (C) SiO2@R nanoparticles, and (D) G@SiO2 nanoparticles. (E) Fluorescence emission spectra (λex = 365 nm) of SiO2 nanoparticles, SiO2@R nanoparticles, G@SiO2 nanoparticles, and the mixture of SiO2@R and G@SiO2. The inset photos were taken under a 365 nm UV lamp. For SiO2@R and G@ SiO2 particles in isolation, the dilutions were 100 and 200 times, respectively.
Red and green QDs, with the sizes of ~7 nm and ~3 nm, respectively, were prepared in an aqueous phase according to previously reported methods,42 and the surface was covered with –COOH groups due to the modification of 3-mercaptopropionic acid (MPA). To synthesize SiO2@R probes, red QDs were covalently linked onto the surface of the SiO2 particles using a 1-(3-dimethylami-nopropyl)-3-ethylcarbodiimide hydrochloride (EDC)-catalyzed dehydrated reaction between the –COOH groups of the QDs and the –NH2 groups of the SiO2 introduced by 3-aminopropyltriethoxysilane (APTS) modification under anhydrous conditions. To synthesize G@SiO2 probes, a thin APTS layer was coated on the surface of SiO2 after the SiO2 nanoparticles adsorbed green QDs through a hydrogen bond. The coated APTS layers not only fix the green QDs onto the surface of the SiO2 particle but also prevent interaction of the analytes with the green QDs. However, this is different from the hydrolysis of APTS in the SiO2@R synthesis, which forms regular monolayers on the surface of the SiO2 particles through Si–O–Si bonding caused by a one-step reaction between ethoxyl groups from APTS and –Si–OH groups from SiO2 under anhydrous conditions. The presence of a small amount of water during G@SiO2 synthesis causes hydrolysis of APTS to produce –Si–OH groups. The hydrolyzed APTS not only condensates with −Si−OH groups on the surface of SiO2 but also reacts with other hydrolyzed APTS molecules, leading to the formation of irregular multimolecular layers. Figure 3B–D shows the transmission electron microscopy (TEM) images of the SiO2, SiO2@R, and G@SiO2 nanoparticles, respectively. It can be seen that the sizes of SiO2@R and G@SiO2 nanoparticles are nearly the same as the size of the SiO2 supporter except they exhibit subtle changes in the surface roughness. Because the diameter of supporter SiO2 is much larger than those of QDs, the effect of modified QDs on the sizes and mechanical properties of supporter SiO2 can be neglected. Therefore, when SiO2@R and G@SiO2 nanoparticles coexist in the same acoustic field of the standing BAWs, they will experience nearly the same acoustic radiation force and be concentrated at the pressure node line in the developed acoustofluidic chip within the same time frame.
Figure 3E plots the fluorescent spectra of the SiO2, SiO2@R, and G@SiO2 nanoparticles. It can be seen that the fluorescence signal of the supporter SiO2 nanoparticles is nearly zero. Conversely, for the fluorescent probes, strong red and green fluorescence can be observed from SiO2@R and G@ SiO2 solutions under the UV excitation ((b) and (c) in the inset of Figure 3E), and their corresponding fluorescent spectra exhibit emission peaks at 650 and 550 nm, respectively. These emission peaks agree well with those of red and green QDs (Figure S4). The positive agreement indicates that red and green QDs are successfully linked to the surface of supporter SiO2 nanoparticles. In addition, when SiO2@R and G@SiO2 nanoparticles are mixed and the ratio of fluorescent intensities (green to red) was set to 3:2, the fluorescent spectrum of the mixed solution simultaneously exhibits two peaks at 550 and 650 nm, and a green-yellow color was observed under the UV excitation (inset of Figure 3E). This means SiO2@R and G@ SiO2 probes can mix well with each other, and colors in the transition region between green and red can be achieved by tuning the ratio between green and red fluorescent probes. The fluorescence stability of the mixed probes was investigated as well through successive exposure under the 365 nm UV excitation. The fluorescent spectrum of mixed probes was measured at the interval of 10 min. As shown in Figure S5, the intensity ratio between green and red peaks (I550/I650) is nearly a constant within 60 min, suggesting good fluorescence stability of the mixed SiO2@R and G@SiO2 probes.
Acoustofluidic Enrichment and Colorimetric Detection of Fluorescent Nanoprobes
To demonstrate the capability of the developed acoustofluidic platform to achieve fluorescent colorimetric detection, experiments were performed using SiO2@R, G@SiO2, and a mixture of SiO2@R and G@SiO2 nanoparticles. Solutions with different nanoparticles were loaded into the capillary of the acoustofluidic chip using a syringe. A cell phone (Pro2S, Smartisan), which supports full-spectrum color detection in real time, was used to capture the color images of nanoparticle solutions in the capillary.
As shown in Figure 4A, when the acoustic transducer is off, it is hard to observe the fluorescence because the fluorescent intensities of the dispersed nanoprobes are too weak to be detected by the sensing camera. After applying an excitation signal to the PZT, standing BAWs are generated in the capillary, and fluorescent nanoparticles are gradually pushed to the node line at the center of capillary. With an increase in the excitation time of the transducer, nanoparticles gradually migrate to the center, and a large and stable cluster of nanoparticles with a strong fluorescent intensity can be observed after 2 min. The dynamic processes of acoustofluidic-based nanoparticle enrichment for SiO2@R, G@SiO2 and the mixture of these two probes are provided in Movie 2, which was recorded using a microscope with a 10× magnification lens. Concentration spots with different colors can be captured by the cell phone, such as a red spot for SiO2@R nanoparticles, a green spot for G@SiO2 nanoparticles, and an orange spot for the mixture of SiO2@R and G@SiO2 nanoparticles.
Figure 4.

Enrichment and fluorescent colorimetric detection of fluorescent nanoprobes using the acoustofluidic platform. (A) Characterization of the focusing performance using our cell-phone-based acoustofluidic platform with a custom designed lens after the acoustic transducer has been off (left) or on (right) for 2 min. The volume ratio of SiO2@R to G@SiO2 is 1:2 in the combined solution. (B) Fluorescence images of mixed fluorescent probes after nanoparticle concentration using the acoustofluidic device. From top to bottom, the volume ratio of SiO2@R was gradually increased from 5% to 30% at the intervals of 5%. The volume ratio of G@SiO2 particles was kept at 50% for each image, simulating the unquenched green fluorescence during analyte measurements.
In order to quantitatively determine concentrations of target analytes, we must be able to detect a range of colors and correlate this spectrum to the target concentration. With the dual colorimetric system, we can achieve a range of colors across the red-green color spectrum by changing the ratio of SiO2@R to G@SiO2 nanoparticles in the mixture. Figure 4B provides a series of images taken by the cell phone as the volume ratio of the SiO2@R solution gradually increases from 5% to 30%. It can be seen that the color of the concentrated spot changes from green to yellow to orange and finally to red as the volume ratio is gradually increased. These images confirmed that after acoustofluidic nanoparticle enrichment, our cell phone camera-based system was capable of discerning different levels of red and green fluorescence and would enable us to establish a reference color map for visual analyte quantification based on a color change. As stated before, the presence of an analyte in the solution will quench the red fluorescence, causing a shift toward green emission. To quantitatively evaluate the color change, the intensity values of R (red), G (green), and B (blue) for the colors of concentrated nanoparticles in Figure 4B were measured using ImageJ software. With an increase of the SiO2@R percentage in the mixture, the R value shows an increasing trend which gradually exceeds the G value (plot shown in Figure S6A). Figure S6B plots the R/G ratio of R to G values with respect to the percentage of SiO2@R nanoparticles in the solution and depicts a linear relationship with a correlation coefficient (R2) of 0.9725.
Visual Detection of Hemoglobin via the Cell-Phone-Based Acoustofluidic Platform
Once the visualization capabilities of the platform had been verified, we sought to test the colorimetric assays ability to quantify a target analyte. We chose to use Hb as the target for proving that the developed platform can be used for visual detection. The Hb molecule is an iron-containing oxygen-transport metalloprotein in red blood cells, and the amount of Hb in blood is associated with many clinical diseases such as anemia, leukemia, and heart diseases.43–45 The normal level of Hb for males, females, and children is 13.0–18.0 g/dL, 12.0–16.0 g/dL, and 11.0–15.0 g/ dL, respectively.46,47 A Hb amount below those levels may cause anemia, a disease from which approximately 2 billion people suffer worldwide, with a higher prevalence in women and children.48,49 Therefore, rapid determination of Hb levels with a POC apparatus is essential to evaluate the extent of anemia in resource-limited settings. This study develops a cellphone-based acoustofluidic platform, which not only greatly improves the detection sensitivity due to the acoustofluidic-based nanoparticle enrichment function but also avoids using additional analytical instruments. To demonstrate the feasibility for POC visual testing, the developed platform was implemented for dosage-sensitive visual detection of Hb in human blood.
For the SiO2@R nanoprobes in our colorimetric system, the direct interaction of Hb with red QDs on the SiO2 supporter causes significant quenching of red fluorescence (Figure S7A). This is because the iron ion in the Hb can form a complex with the surface –COOH groups of the red QDs.45 In contrast, the G@SiO2 nanoparticles have an APTS layer coated on them which means that the effect of Hb on the quenching of green fluorescence is blocked due to the APTS layer (Figure S7B). The blocking effect is related to the addition of APTS during the synthesis of G@SiO2 nanoparticles, and the optimized APTS volume was found to be near 300 μL (Figure S8) for optimal avoidance of green fluorescence quenching. If the two types of nanoparticles interact with 50 μg/mL Hb, the fluorescence quenching percentage (defined as (I0 − I)/I0) is around 27.4% for the G@SiO2 nanoparticles, and in contrast, the quenching percentage for SiO2@R nanoparticles is much higher at 85.8% (Figure S7C). Such a large difference will be utilized for colorimetric measurement.
To construct a colorimetric fluorescence system for Hb detection, both the G@SiO2 and SiO2@R nanoparticles are used. In the colorimetric system, the SiO2@R nanoparticles are for sensing based on the effective fluorescent quenching response after their interaction with Hb, while the G@SiO2 nanoparticles serve as an internal standard (Figure S9). Figure 5 illustrates the mechanism of our platform for visual detection of Hb. The SiO2@R and G@SiO2 nanoparticles are well dispersed into the test solution and loaded into the capillary of the acoustofluidic chip. When acoustic waves are on, the SiO2@R and G@SiO2 nanoparticles will move to the center of the capillary, and a bright spot of concentrated nanoparticles can be observed from the cell phone screen. After 2 min, when the spot with concentrated nanoparticles becomes stable, an image is taken with the cell phone. In the absence of Hb, the formed spot shows an orange color due to the mixing of red and green fluorescence components. When the Hb molecules are present, they themselves are difficult to be directly concentrated by the acoustic radiation force because the acoustic radiation force on Hb molecules with small diameters (~ 6.4 nm)50 is very weak. Therefore, our method uses the electrostatic interaction between QDs of SiO2@R and Fe ions of Hb to absorb the Hb and then concentrate the SiO2@R. Moreover, the SiO2@R nanoparticles will experience a quenching effect, and as a result, the ratio between red and green fluorescence intensities will drop, causing a shift toward green light for the image captured by the cell phone. Moreover, a series of consecutive colors transiting from orange to green can be observed by the cell phone with a gradual increase in the concentration of Hb.
Figure 5.

Illustration of Hb visual detection using cell-phone-based acoustofluidic platform. In the absence of Hb, the emitted signal will be orange, whereas the signal will shift to green in the presence of Hb.
For ratiometric fluorescence probes, the fluorescence intensity ratio of SiO2@R to G@SiO2 is important for defining the sensitivity of visual testing; the initial ratio must be tuned properly to ensure valid detection across the target concentration range. To explore the effect of the SiO2@R/ G@SiO2 volume ratio on the color change after exposure to Hb, three groups of ratiometric fluorescence probes with different ratios were used to detect Hb from 0 to 100 μg/mL. As shown in Figure 6A, when SiO2@R and G@SiO2 are mixed with the volume ratio of 3:5, the fluorescence emission is seen to be red after the acoustic waves concentrate the particles. Regardless of the concentration of Hb, the color of the spot does not change, instead only the brightness of the spot decreases gradually. While the decrease in intensity could be used as a signifier of concentration, the change of intensity values is not obvious (Figure S10, black line), and it is not well suited to visual observation because the human eye is less sensitive to brightness compared with color variations. In order to reveal an obvious color change, the volume ratio of SiO2@R to G@SiO2 is decreased to 2:5. As shown in Figure 6B, the formed spot exhibits orange fluorescence in the absence of Hb, and with the increase of Hb from 0 to 100 μg/mL, the color of spot changes from orange to yellow to green-yellow, and finally to green. The obvious variations of colors seen via the cell phone image are much more obvious than the fluorescence seen in the corresponding test tubes without enrichment via the acoustic device (Figure 6B, bottom). Simply using the color change, it is easy to perform a quick semiquantitative analysis for the Hb concentration by naked eyes, which is essential for POC testing. In Figure 6C, the volume ratio of SiO2@R to G@SiO2 is further decreased to 1:5, and green fluorescence is observed from the formed spot whether Hb exists or not. This is due to the miniscule amount of SiO2@R not being visible regardless of quenching (Figure S10, red line). Based on the results presented here, the volume ratio of SiO2@R to G@SiO2 is set to 2:5 in the future experiment. In Figure 6D, ImageJ was used to analyze the R/G ratio and quantitatively evaluate the level of Hb present in the samples. The results exhibit a good linear relationship with the concentrations of Hb ranging from 0 μg/mL to 100 μg/mL (R2 = 0.9715). The limit of detection (LOD) toward Hb was estimated at 0.035 μg/mL based on 3σ, where σ is the standard deviation of the blank sample (the sample with an Hb concentration of 0 μg/mL).
Figure 6.

Interaction between Hb and the ratiometric fluorescence probes. (A–C) Top: Fluorescent images captured by the cell phone after acoustofluidic nanoparticle concentration of mixed samples of Hb from 0 to 100 μg/mL with the probes. The fluorescence images of ratiometric fluorescence probes with a volume ratio (SiO2@R to G@SiO2) of (A) 3:5, (B) 2:5, and (C) 1:5 show how the color changes with concentration of Hb. Bottom: Fluorescence images of corresponding test solutions without enrichment via the acoustic device (taken under a 365 nm UV lamp). (D) Plot of R/G ratio as a function of the concentration of Hb from 0 μg/mL to 100 μg/mL.
To test the selectivity of the platform, the colorimetric responses in the presence of various analytes, including bovine serum albumin (BSA), ovalbumin (OVA), glucose, uric acid, NaCl, KCl, MgCl2, CaCl2, CuCl2, FeCl2, and FeCl3 at the concentration of 1 mg/mL, were separately studied. In contrast to our detection of Hb, the color of the concentrated spot did not change with exposure to alternative analytes, except CuCl2, FeCl2, and FeCl3 (Figure S11). Although Cu2+ ions with this high concentration (1 mg/mL) disturbed the detection of Hb, the actual concentration of Cu2+ in human blood is no more than 155 μg/dL,51 meaning that the low concentration will not affect Hb detection, especially for a diluted human blood sample. On the other hand, even though iron ions (Fe2+ or Fe3+) can quench the fluorescence of QDs, most iron ions are in Hb as part of the heme group,52 which is the detection mechanism involved in this work. Additionally, when the human blood was added after a 2000-fold dilution, no color change was observed. This suggests that our method would have a strong aversion to interference during practical detection.
After determining the optimal ratio of fluorescent colorimetric probes and selectivity, we examined the effectiveness and reliability of a cell-phone-based acoustofluidic platform in the analysis of practical samples. As a more realistic sample, fresh human whole blood was purchased, and the content of its Hb was measured to be 11.1 g/dL (1.11 × 10⁵ μg/mL) by a Beckman Coulter Ac·T diff 2 hematology analyzer. In order to correspond to the linear range established in our previous experiments and provide several measurements across this spectrum, the blood was diluted 20,000 times, yielding a baseline concentration of 5.55 μg/mL. This diluted blood was then mixed with different concentrations of Hb, corresponding to a range of 0–60 μg/mL after dilution. The measurement of spiked Hb was found by comparing the R/G fluorescence ratio from ImageJ to the values in Figure 6D. The measured values are in good agreement with the amounts of Hb spiked into the blood samples (Figure 7A and Table S1).
Figure 7.

Evaluation for the effectiveness and reliability of the cellphone-based acoustofluidic platform with a biological sample. (A) The recovery tests (n = 3) of Hb in human blood: sample a, fresh human blood, and samples b–d, human blood spiked with 20, 40, 60 μg/mL Hb, respectively. The blood was diluted 20,000-fold before adding Hb. The recovery of Hb was determined by the linear relation of R/G ratio with the concentration of Hb (Figure 6D). (B) Visual detection of three different human blood samples. Each sample was diluted 2000-fold before testing, and visual color analysis was consistent with the expected fluorescence signature.
Additionally, as a demonstration of potential rapid POC analysis, we conducted direct visual testing of Hb levels (without using ImageJ) from three different blood samples using the acoustofluidic platform. The blood samples were initially measured to have Hb concentrations of 11.0 g/dL, 13.2 g/dL, and 14.8 g/dL, but were diluted 2000-fold before being injected into the glass capillary for testing to align the final concentrations with the working range of the assay and to decrease the concentration of interfering substances (e.g., Cu2+) in the blood. As shown in Figure 7B, the captured fluorescence images exhibit green-yellow or green fluorescence and are consistent with the colors presented by the standard chroma bar. Colors for the scale bar in Figure 7B were established from the experimentation shown in Figure 6B, with the concentration unit being converted from μg/mL to g/dL. These results suggest that the device can give a clear and quick judgment as to whether the levels of Hb in a patient’s blood are at a normal level.
The results of Hb detection show that our cell-phone-based acoustofluidic platform is portable and ready for POC testing, has a low requirement for sample volume (~10 μL), and provides rapid (~2 min) and easy readouts. Compared to previous methods, such as spectrophotometric measurement53,54 and cell phone-assisted Hb quantitation,55,56 the LOD of our method for Hb detection is much lower (Table S2). Moreover, our method is more biosafe than the Drabkin colorimetric assay (the international gold standard for Hb quantification),47 which employs highly toxic reagents (especially potassium cyanide) and generates highly hazardous waste. Additionally, although our method is not as sensitive as electrochemistry,57,58 fluorimetry,59,60 or chemiluminescence methods,61 these methods require bulky, expensive, and complex instruments and/or highly trained operators. Our study provides a low-cost and portable platform with simple operation. With the features mentioned above, our acoustofluidic platform can potentially be used for a wide range of applications in POC testing and rapid on-site monitoring with a LOD that fulfills the requirements of many bioanalysis and diagnostic applications. In addition to Hb detection, our platform can be extended to other POC detection applications that are also based on color changes (or fluorescence intensity changes), such as metabolic syndrome (glucose, triglycerides), cardiovascular disease (vascular endothelial growth factor), cancer (carcinoembryonic antigen), and so on.
CONCLUSION
In summary, we developed an acoustofluidic-based nanoparticle-enrichment platform for POC quantitative visual testing. Two fluorescent nanoprobes, SiO2@R and G@SiO2, were synthesized for fluorescent colorimetric detection, and it has been demonstrated that the two nanoprobes can be focused and enriched within a capillary channel to form a visible fluorescence spot via the acoustic radiation force generated by standing BAWs. At the same time, a cell phone with a custom-designed lens and sample mounting system can clearly image the microchannel and the various fluorescent colors emitted from the samples. As an example of a practical POC application, the acoustofluidic device was successfully used for visualization and quantification of Hb in human blood.
The results reported here demonstrate the accuracy and applicability of our cell-phone-based acoustofluidic platform in real-world applications. Cell phones with high-sensitivity builtin CMOS sensors can be used as powerful outputs toward the development of POC technologies for optical imaging. Especially considering the application of fluorescence imaging, cell phones equipped with high-resolution lenses can provide rapid optical detection of various colors, with no filters needed. This greatly reduces the costs of the diagnostic platform and makes the device more simplistic. In this work, the cell phone is used for image acquisition. In the future, we could develop a cell phone application for computation, communication, and cloud-based medical reporting. Future work will seek to further improve the sensing platform for practical POC testing of Hb levels. Moreover, we will focus on expanding the variety of analytical targets that can be detected and quantified using the developed acoustofluidic platform. Additionally, we plan to create a series of colorimetric particles that can be applied to the analysis of many biological markers (such as glucose, total cholesterol, vascular endothelial growth factor, and carcinoembryonic antigen) to realize different POC applications. Nonetheless, the work presented herein demonstrates the potential that acoustofluidic tools have for real-time analysis at the POC. We imagine that future developments in both acoustofluidic technology and the cell phone industry will give rise to even more successful POC technologies.
EXPERIMENTAL SECTION
Materials
All chemicals were analytical grade and used as received without additional purification. Tetraethyl orthosilicate (TEOS), 3-aminopropyltriethoxysilane (APTS), 3-mercaptopropionic acid (MPA), 1-(3-dimethylami-nopropyl)-3-ethylcarbodiimide hydrochloride (EDC), tellurium (Te) powder, NaBH4, CdCl2, NaOH, ammonium hydroxide (25%), and Hb lyophilized powder from humans were obtained from Sigma-Aldrich. Sulfuric acid (98%) and anhydrous ethanol were supplied by Emsure Merck KGaA. The human whole blood samples from four separate donors were purchased from Zen-Bio, Inc. USA and used immediately upon arrival. Piezoelectric transducers (PZT, part no. SMPL20W15T21R111) was obtained from Steiner&Martins, Inc. Square cross-section glass capillary (0.20 mm ID × 0.10 mm wall) was supplied by VitroCom.
Characterization
Fluorescence spectra were obtained using a Synergy H1 microplate reader (BioTek Instruments Inc., USA). Transmission electron microscopy (TEM) images were collected from FEI Tecnai G2 Twin microscope (FEI Tecnai, USA) with an acceleration voltage of 160 kV. The concentration of Hb in whole blood samples was measured using a Coulter AC·T diff 2 analyzer (Beckman Coulter, Inc., USA). The motion of particles in the glass capillary was recorded using an inverted microscope (Eclipse Ti, Nikon, Japan) with a CCD camera (Nikon DS-Qi2, Nikon, Japan). All acquired images and videos were analyzed using ImageJ (NIH, USA). Since the shape of the concentrated spots varied from sample to sample, the custom selection (wand tool) in ImageJ was used to select the analysis area with a pixel color variation tolerance value of 30. Once the region of interest was selected, the intensity values for R (red), G (green), and B (blue) were calculated using the ImageJ histogram function, yielding a quantitative evaluation of the color change.
Device Fabrication
A simple acoustofluidic-based nanoparticle-enrichment device was fabricated by bonding a square glass capillary onto the surface of a PZT, followed by mounting onto a glass slide. To ensure that acoustic waves propagated into the glass capillary, a thin UV epoxy layer (NOA 61, Norland Optical Adhesive, USA) was used as adhesive and acoustic propagation medium between the capillary and the transducer. At the same time, to reduce the loss of acoustic wave energy from the piezoelectric thin film, two small hard plastic sheets were used as spacers between the PZT and the glass slide to provide a necessary gap between the oscillating structure and the external environment. In addition, both ends of the capillary were connected to a 1.8 mm inner diameter polyethylene tubing to provide an inlet and outlet. To inhibit the interaction between samples and the interlayer of capillary, before use, the microfluidic channel was flushed with 5% F127 and washed by ultrapure water to remove residual F127.
Synthesis of CdTe QDs
Carboxyl-terminated CdTe QDs were prepared following directions from a previous method42 with minor modification. Briefly, 0.06 g of Te powder and 0.1 g of NaBH4 were added to 3 mL of ultrapure water under a nitrogen atmosphere, and the obtained solution was stirred for 8 h in an ice bath to get NaHTe solution (Solution A). Meanwhile, 0.18 g of CdCl2 and 0.21 mL of MPA were dissolved in 125 mL of ultrapure water, and the pH of mixed solution (Solution B) was adjusted to 11 with 1.0 M NaOH, followed by deoxygenation with nitrogen for 30 min. Subsequently, 8 mL of H2SO4 (0.5 M) was injected into Solution A, and the produced H2Te gas was immediately injected into Solution B, whose color transformed from colorless to orange with the increase of absorbed gas. Then, Solution B was refluxed for 8 and 42 h to obtain green and red CdTe QDs with an emission at 550 and 650 nm, respectively.
Synthesis of Monodisperse SiO2 Nanoparticles
Uniform spherical silica particles with a size of 600 nm were prepared by seeded growth based on the Stöber method.62 First, 2 mL of ammonium hydroxide, 20 mL of ethanol, and 10 mL of H2O were mixed completely to obtain a hydrolysis solution. Then, 3 mL of the hydrolysis solution and 0.5 mL of TEOS were added into 50 mL three-necked flasks under an ice bath and rapidly stirred for 10 min to form the seed solution. During the growth process, 12 mL of hydrolysis solution and 12 mL of TEOS/ethanol solution (the ratio of TEOS to ethanol is 3:5 by volume) were simultaneously dropped into the seed solution through different necks at a rate of 100 μL/min. After this addition, the whole mixture was allowed to react for 12 h, and the as-prepared SiO2 dispersions were washed with ethanol by centrifugation (5000 rpm, 15 min) three times. Finally, the SiO2 nanoparticle powder was obtained after drying at 60 °C for 12 h.
Synthesis of Green CdTe QD-Embedded Silica (G@SiO2) Nanoparticles
Typically 30 mg of SiO2 nanoparticles was dissolved into 10 mL of ethanol under magnetic stirring. Then 400 μL of green QDs and 250 μL of APTS were added, and the mixed solution was stirred at room temperature for 8 h. The resultant solution was centrifuged (14,000 rpm, 5 min) and washed with ethanol and ultrapure water two times each. Finally G@SiO2 nanoparticles were redispersed into 8 mL of ultrapure water for further use.
Synthesis of Red CdTe QD-Coated Silica (SiO2@R) Nanoparticles
To obtain SiO2@R nanoparticles, amino-functionalized SiO2 (SiO2–NH2) particles were first synthesized through adding 200 μL of APTS to 10 mL of a SiO2-ethanol solution (3 mg/mL). After reacting for 8 h, the mixture was centrifuged (14,000 rpm, 5 min) and washed with ethanol three times before being dispersed into 4 mL of ultrapure water. Then, 320 μL of red QDs, 20 mg of EDC, and 800 μL of SiO2-NH2 solution were added to 8 mL of ultrapure water, and the mixed solution was shaken for 6 h at room temperature. To remove excess QDs and EDC, the above solution was centrifuged (14,000 rpm, 5 min) and washed with ultrapure water three times. Finally SiO2@R nanoparticles were redispersed into 8 mL of ultrapure water for further use.
Experimental Setup
Except for monitoring the motion of particles in glass capillary, all the experiments were conducted using our cell-phone-based acoustofluidic platform and the fluorescence images were recorded by a smart phone (Pro2S, Smartisan, China). During experiments, the device was mounted on a 3D printed holder, and the inlet tubing was connected to a syringe, from which sample solutions (200 μL) were injected into the fluidic channel. A function generator (AFG3011C, Tektronix, USA) was used to drive the PZT and actuate the acoustofluidic system. A blue LED light (365 nm) was used to provide the fluorescent light source. The resonant frequency of the device was first identified using a network analyzer (Vector Network Analyzer 2180, Array Solutions, USA). Then, the acoustic radiation force intensities in the microchannel within a frequency resolution (±0.001 MHz) around the resonant frequency were compared before choosing the final the driving frequency of 3.361 MHz.
Supplementary Material
Movie 1: Animation of the motion of SiO2 nanoparticles (AVI)
Movie 2: Dynamic processes of acoustofluidic-based nanoparticle-enrichment for SiO2@R, G@SiO2 and the mixture of these two probes (MP4)
ACKNOWLEDGMENTS
We acknowledge support from the National Institutes of Health (UG3TR002978, R01GM135486, R01HD086325, R33CA223908, and R01GM127714) and United States Army Medical Research Acquisition Activity (W81XWH-181-0242). We also acknowledge Dr. G. Arepally (Duke University Medical Center) for providing the testing results of hemoglobin in human blood.
Footnotes
Notes
The authors declare no competing financial interest.
ASSOCIATED CONTENT
Supporting Information
The Supporting Information is available free of charge at https://pubs.acs.org/doi/10.1021/acsnano.9b08349.
Phase curve of the acoustofluidic device (Figure S1), finite element simulations for nanoparticle motion (Figure S2), photographs of cell-phone-based acoustofluidic platform (Figure S3), fluorescence emission spectra of gQDs and rQDs (Figure S4), fluorescence stability of the mixture of SiO2@R and G@SiO2 nanoparticles (Figure S5), red and green fluorescent image analysis after focusing using the acoustofluidic device (Figure S6), fluorescence emission spectra of G@ SiO2 and SiO2@R before and after addition of Hb (Figure S7), optimization of G@SiO2 synthesis (Figure S8), interaction between mixed fluorescence probes and Hb (Figure S9), plot of R/G ratio as a function of the concentration of Hb (Figure S10), selectivity experiment (Figure S11), recovery tests of Hb in human blood (Table S1), comparison of methods for Hb detection (Table S2) (PDF)
Contributor Information
Liying Zhang, School of Pharmacy, Nanjing Medical University, Nanjing, Jiangsu 211166, China; Department of Mechanical Engineering and Material Science, Duke University, Durham, North Carolina 27708, United States.
Zhenhua Tian, Department of Aerospace Engineering, Mississippi State University, Mississippi State, Mississippi 39762, United States; Department of Mechanical Engineering and Material Science, Duke University, Durham, North Carolina 27708, United States.
Hunter Bachman, Department of Mechanical Engineering and Material Science, Duke University, Durham, North Carolina 27708, United States.
Peiran Zhang, Department of Mechanical Engineering and Material Science, Duke University, Durham, North Carolina 27708, United States.
Tony Jun Huang, Department of Mechanical Engineering and Material Science, Duke University, Durham, North Carolina 27708, United States.
REFERENCES
- (1).Kong JE; Wei Q; Tseng D; Zhang J; Pan E; Lewinski M; Garner OB; Ozcan A; Di Carlo D Highly Stable and Sensitive Nucleic Acid Amplification and Cell-Phone-Based Readout. ACS Nano 2017, 11, 2934–2943. [DOI] [PubMed] [Google Scholar]
- (2).Quesada-González D; Merkoçi A Nanomaterial-Based Devices for Point-of-Care Diagnostic Applications. Chem. Soc. Rev 2018, 47, 4697–4709. [DOI] [PubMed] [Google Scholar]
- (3).Sharma S; Zapatero-Rodríguez J; Estrela P; O’Kennedy R Point-of-Care Diagnostics in Low Resource Settings: Present Status and Future Role of Microfluidics. Biosensors 2015, 5, 577–601. [DOI] [PMC free article] [PubMed] [Google Scholar]
- (4).Syedmoradi L; Daneshpour M; Alvandipour M; Gomez FA; Hajghassem H; Omidfar K Point of Care Testing: The Impact of Nanotechnology. Biosens. Bioelectron 2017, 87, 373–387. [DOI] [PubMed] [Google Scholar]
- (5).Brangel P; Sobarzo A; Parolo C; Miller BS; Howes PD; Gelkop S; Lutwama JJ; Dye JM; McKendry RA; Lobel L; Stevens MM A Serological Point-of-Care Test for the Detection of IgG Antibodies against Ebola Virus in Human Survivors. ACS Nano 2018, 12, 63–73. [DOI] [PubMed] [Google Scholar]
- (6).Yoo SM; Lee SY Optical Biosensors for the Detection of Pathogenic Microorganisms. Trends Biotechnol. 2016, 34, 7–25. [DOI] [PubMed] [Google Scholar]
- (7).Li Y; Xuan J; Song Y; Qi W; He B; Wang P; Qin L Nanoporous Glass Integrated in Volumetric Bar-Chart Chip for Point-of-Care Diagnostics of Non-Small Cell Lung Cancer. ACS Nano 2016, 10, 1640–1647. [DOI] [PMC free article] [PubMed] [Google Scholar]
- (8).Hou YH; Wang JJ; Jiang YZ; Lv C; Xia L; Hong SL; Lin M; Lin Y; Zhang ZL; Pang DW A Colorimetric and Electrochemical Immunosensor for Point-of-Care Detection of Enterovirus 71. Biosens. Bioelectron 2018, 99, 186–192. [DOI] [PubMed] [Google Scholar]
- (9).Romeo A; Leung TS; Sánchez S Smart Biosensors for Multiplexed and Fully Integrated Point-of-Care Diagnostics. Lab Chip 2016, 16, 1957–1961. [DOI] [PubMed] [Google Scholar]
- (10).Nge PN; Rogers CI; Woolley AT Advances in Microfluidic Materials, Functions, Integration, and Applications. Chem. Rev 2013, 113, 2550–2583. [DOI] [PMC free article] [PubMed] [Google Scholar]
- (11).Friend J; Yeo LY Microscale Acoustofluidics: Microfluidics Driven via Acoustics and Ultrasonics. Rev. Mod. Phys 2011, 83, 647–704. [Google Scholar]
- (12).Ozcelik A; Rufo J; Guo F; Gu Y; Li P; Lata J; Huang TJ Acoustic Tweezers for the Life Sciences. Nat. Methods 2018, 15, 1021–1028. [DOI] [PMC free article] [PubMed] [Google Scholar]
- (13).Gedge M; Hill M Acoustofluidics 17: Theory and Applications of Surface Acoustic Wave Devices for Particle Manipulation. Lab Chip 2012, 12, 2998–3007. [DOI] [PubMed] [Google Scholar]
- (14).Li P; Huang TJ Applications of Acoustofluidics in Bioanalytical Chemistry. Anal. Chem 2019, 91, 757–767. [DOI] [PMC free article] [PubMed] [Google Scholar]
- (15).Marzo A; Drinkwater BW Holographic Acoustic Tweezers. Proc. Natl. Acad. Sci. U. S. A 2019, 116, 84–89. [DOI] [PMC free article] [PubMed] [Google Scholar]
- (16).Zhang SP; Lata J; Chen C; Mai J; Guo F; Tian Z; Ren L; Mao Z; Huang PH; Li P; Yang S; Huang TJ Digital Acoustofluidics Enables Contactless and Programmable Liquid Handling. Nat. Commun 2018, 9, 2928–2939. [DOI] [PMC free article] [PubMed] [Google Scholar]
- (17).Wu M; Ouyang Y; Wang Z; Zhang R; Huang PH; Chen C; Li H; Li P; Quinn D; Dao M; Suresh S; Sadovsky Y; Huang TJ Isolation of Exosomes from Whole Blood by Integrating Acoustics and Microfluidics. Proc. Natl. Acad. Sci. U. S. A 2017, 114, 10584–10589. [DOI] [PMC free article] [PubMed] [Google Scholar]
- (18).Lee K; Shao H; Weissleder R; Lee H Acoustic Purification of Extracellular Microvesicles. ACS Nano 2015, 9, 2321–2327. [DOI] [PMC free article] [PubMed] [Google Scholar]
- (19).Ohlsson P; Evander M; Petersson K; Mellhammar L; Lehmusvuori A; Karhunen U; Soikkeli M; Seppa T; Tuunainen E; Spangar A; von Lode P; Rantakokko-Jalava K; Otto G; Scheding S; Soukka T; Wittfooth S; Laurell T Integrated Acoustic Separation, Enrichment, and Microchip Polymerase Chain Reaction Detection of Bacteria from Blood for Rapid Sepsis Diagnostics. Anal. Chem 2016, 88, 9403–9411. [DOI] [PubMed] [Google Scholar]
- (20).Jakobsson O; Oh SS; Antfolk M; Eisenstein M; Laurell T; Soh HT Thousand-Fold Volumetric Concentration of Live Cells with a Recirculating Acoustofluidic Device. Anal. Chem 2015, 87, 8497–8502. [DOI] [PubMed] [Google Scholar]
- (21).Xie Y; Bachman H; Huang TJ Acoustofluidic Methods in Cell Analysis. TrAC, Trends Anal. Chem 2019, 117, 280–290. [DOI] [PMC free article] [PubMed] [Google Scholar]
- (22).Ma Z; Zhou Y; Collins DJ; Ai Y Fluorescence Activated Cell Sorting via a Focused Traveling Surface Acoustic Beam. Lab Chip 2017, 17, 3176–3185. [DOI] [PubMed] [Google Scholar]
- (23).Collins DJ; Neild A; Ai Y Highly Focused High-Frequency Travelling Surface Acoustic Waves (SAW) for Rapid Single-Particle Sorting. Lab Chip 2016, 16, 471–479. [DOI] [PubMed] [Google Scholar]
- (24).Mao Z; Li P; Wu M; Bachman H; Mesyngier N; Guo X; Liu S; Costanzo F; Huang TJ Enriching Nanoparticles via Acoustofluidics. ACS Nano 2017, 11, 603–612. [DOI] [PMC free article] [PubMed] [Google Scholar]
- (25).Sitters G; Kamsma D; Thalhammer G; Ritsch-Marte M; Peterman EJG; Wuite GJL Acoustic Force Spectroscopy. Nat. Methods 2015, 12, 47–50. [DOI] [PubMed] [Google Scholar]
- (26).Iranmanesh I; Ohlin M; Ramachandraiah H; Ye S; Russom A; Wiklund M Acoustic Micro-Vortexing of Fluids, Particles and Cells in Disposable Microfluidic Chips. Biomed. Microdevices 2016, 18, 71–77. [DOI] [PMC free article] [PubMed] [Google Scholar]
- (27).Miansari M; Friend JR Acoustic Nanofluidics via RoomTemperature Lithium Niobate Bonding: A Platform for Actuation and Manipulation of Nanoconfined Fluids and Particles. Adv. Funct. Mater 2016, 26, 7861–7872. [Google Scholar]
- (28).Rambach RW; Biswas P; Yadav A; Garstecki P; Franke T Fast Selective Trapping and Release of Picoliter Droplets in a 3D Microfluidic PDMS Multi-trap System with Bubbles. Analyst 2018, 143, 843–849. [DOI] [PubMed] [Google Scholar]
- (29).Destgeer G; Sung HJ Recent Advances in Microfluidic Actuation and Micro-Object Manipulation via Surface Acoustic Waves. Lab Chip 2015, 15, 2722–2738. [DOI] [PubMed] [Google Scholar]
- (30).Melde K; Choi E; Wu Z; Palagi S; Qiu T; Fischer P Acoustic Fabrication via the Assembly and Fusion of Particles. Adv. Mater 2018, 30, 1704507–1704511. [DOI] [PubMed] [Google Scholar]
- (31).Karlsen JT; Augustsson P; Bruus H Acoustic Force Density Acting on Inhomogeneous Fluids in Acoustic Fields. Phys. Rev. Lett 2016, 117, 114504. [DOI] [PubMed] [Google Scholar]
- (32).Tian Z; Yang S; Huang PH; Wang Z; Zhang P; Gu Y; Bachman H; Chen C; Wu M; Xie Y; Huang TJ WavenumberSpiral Acoustic Tweezers for Dynamic and Rconfigurable Manipulation of Particles and Cells. Sci. Adv 2019, 5, No. eaau6062. [DOI] [PMC free article] [PubMed] [Google Scholar]
- (33).Ahmed H; Destgeer G; Park J; Jung JH; Ahmad R; Park K; Sung HJ A Pumpless Acoustofluidic Platform for Size-Selective Concentration and Separation of Microparticles. Anal. Chem 2017, 89, 13575–13581. [DOI] [PubMed] [Google Scholar]
- (34).Zhao S; He W; Ma Z; Liu P; Huang PH; Bachman H; Wang L; Yang S; Tian Z; Wang Z; Gu Y; Xie Z; Huang TJ On-Chip Stool Liquefaction via Acoustofluidics. Lab Chip 2019, 19, 941–947. [DOI] [PMC free article] [PubMed] [Google Scholar]
- (35).Bachman H; Fu H; Huang PH; Tian Z; Embry-Seckler J; Rufo J; Xie Z; Hartman JH; Zhao S; Yang S; Meyer JN; Huang TJ Open Source Acoustofluidics. Lab Chip 2019, 19, 2404–2414. [DOI] [PMC free article] [PubMed] [Google Scholar]
- (36).Cui W; Mu L; Duan X; Pang W; Reed MA Trapping of Sub-100 nm Nanoparticles Using Gigahertz Acoustofluidic Tweezers for Biosensing Applications. Nanoscale 2019, 11, 14625–14634. [DOI] [PubMed] [Google Scholar]
- (37).Wu M; Chen K; Yang S; Wang Z; Huang PH; Mai J; Li ZY; Huang TJ High-Throughput Cell Focusing and Separation via Acoustofluidic Tweezers. Lab Chip 2018, 18, 3003–3010. [DOI] [PMC free article] [PubMed] [Google Scholar]
- (38).Xu G; Gunson RN; Cooper JM; Reboud J Rapid Ultrasonic Isothermal Amplification of DNA with Multiplexed Melting Analysis-Applications in the Clinical Diagnosis of Sexually Transmitted Diseases. Chem. Commun 2015, 51, 2589–2592. [DOI] [PubMed] [Google Scholar]
- (39).Bachman H; Huang PH; Zhao S; Yang S; Zhang P; Fu H; Huang TJ Acoustofluidic Devices Controlled by Cell Phones. Lab Chip 2018, 18, 433–441. [DOI] [PMC free article] [PubMed] [Google Scholar]
- (40).Wu M; Ozcelik A; Rufo J; Wang Z; Fang R; Huang TJ Acoustofluidic Separation of Cells and Particles. Microsyst Nanoeng. 2019, 5, 32–49. [DOI] [PMC free article] [PubMed] [Google Scholar]
- (41).Li S; Ren L; Huang PH; Yao X; Cuento RA; McCoy JP; Cameron CE; Levine SJ; Huang TJ Acoustofluidic Transfer of Inflammatory Cells from Human Sputum Samples. Anal. Chem 2016, 88, 5655–5661. [DOI] [PMC free article] [PubMed] [Google Scholar]
- (42).Huang X; Zhou Y; Liu C; Zhang R; Zhang L; Du S; Liu B; Han MY; Zhang Z A Single Dual-Emissive Nanofluorophore Test Paper for Highly Sensitive Colorimetry-Based Quantification of Blood Glucose. Biosens. Bioelectron 2016, 86, 530–535. [DOI] [PubMed] [Google Scholar]
- (43).Barati A; Shamsipur M; Abdollahi H Hemoglobin Detection Using Carbon Dots as a Fluorescence Probe. Biosens. Bioelectron 2015, 71, 470–475. [DOI] [PubMed] [Google Scholar]
- (44).Pourreza N; Golmohammadi H Hemoglobin Detection Using Curcumin Nanoparticles as a Colorimetric Chemosensor. RSC Adv. 2015, 5, 1712–1717. [Google Scholar]
- (45).Wang X; Yu S; Liu W; Fu L; Wang Y; Li J; Chen L Molecular Imprinting Based Hybrid Ratiometric Fluorescence Sensor for the Visual Determination of Bovine Hemoglobin. ACS Sens. 2018, 3, 378–385. [DOI] [PubMed] [Google Scholar]
- (46).Wirth JP; Ansumana R; Woodruff BA; Koroma AS; Hodges MH Association Between Sickle Cell and β-thalassemia Genes and Hemoglobin Concentration and Anemia in Children and Non-Pregnant Women in Sierra Leone: Ancillary Analysis of Data from Sierra Leone’s 2013 National Micronutrient Survey. BMC Res. Notes 2018, 11, 43–47. [DOI] [PMC free article] [PubMed] [Google Scholar]
- (47).Nestel P; Taylor H Anemia Detection Methods in Low-Resource Settings: a Manual for Health Workers; PATH, Seattle, WA, 1997. [Google Scholar]
- (48).Stoltzfus RJ Defining Iron-Deficiency Anemia in Public Health Terms: A Time for Reflection. J. Nutr. 2001, 131, 565S–567S. [DOI] [PubMed] [Google Scholar]
- (49).Gebre A; Mulugeta A Prevalence of Anemia and Associated Factors among Pregnant Women in North Western Zone of Tigray, Northern Ethiopia: A Cross-Sectional Study. J. Nutr. Metab 2015, 2015, 165430. [DOI] [PMC free article] [PubMed] [Google Scholar]
- (50).Hu DH; Wu HM; Liang JG; Han HY Study on the Interaction Between CdSe Quantum Dots and Hemoglobin. Spectrochim. Acta, Part A 2008, 69, 830–834. [DOI] [PubMed] [Google Scholar]
- (51).Prohaska C; Pomazal K; Steffan I Determination of Ca, Mg, Fe, Cu, and Zn in Blood Fractions and Whole Blood of Humans by ICP-OES. Fresenius’ J. Anal. Chem 2000, 367, 479–484. [DOI] [PubMed] [Google Scholar]
- (52).Alayash AI Hemoglobin-Based Blood Substitutes: Oxygen Carriers, Pressor Agents, or Oxidants? Nat. Biotechnol 1999, 17, 545–549. [DOI] [PubMed] [Google Scholar]
- (53).Pollard J; Rifaie-Graham O; Raccio S; Davey A; Balog S; Bruns N Biocatalytically Initiated Precipitation Atom Transfer Radical Polymerization (ATRP) as a Quantitative Method for Hemoglobin Detection in Biological Fluids. Anal. Chem 2020, 92, 1162–1170. [DOI] [PubMed] [Google Scholar]
- (54).Liu C; Xu BJ; Zhou L; Sun Z; Mao HJ; Zhao JL; Zhang L; Chen X Graphene Oxide Functionalized Long Period Fiber Grating for Highly Sensitive Hemoglobin Detection. Sens. Actuators, B 2018, 261, 91–96. [Google Scholar]
- (55).Ghatpande NS; Apte PP; Joshi BN; Naik SS; Bodas D; Sande V; Uttarwar P; Kulkarni PP Development of a Novel Smartphone-Based Application for Accurate and Sensitive on-field Hemoglobin Measurement. RSC Adv. 2016, 6, 104067–104072. [Google Scholar]
- (56).Guo T; Patnaik R; Kuhlmann K; Rai AJ; Sia SK Smartphone Dongle for Simultaneous Measurement of Hemoglobin Concentration and Detection of HIV Antibodies. Lab Chip 2015, 15, 3514–3520. [DOI] [PubMed] [Google Scholar]
- (57).Han GC; Su X; Hou J; Ferranco A; Feng XZ; Zeng R; Chen Z; Kraatz HB Disposable Electrochemical Sensors for Hemoglobin Detection Based on Ferrocenoyl Cysteine Conjugates Modified Electrode. Sens. Actuators, B 2019, 282, 130–136. [Google Scholar]
- (58).Mozammal Hossain MD; Moon JM; Gurudatt NG; Park DS; Choi CS; Shim YB Separation Detection of Hemoglobin and Glycated Hemoglobin Fractions in Blood using the Electrochemical Microfluidic Channel with a Conductive Polymer Composite Sensor. Biosens. Bioelectron 2019, 142, 111515–111521. [DOI] [PubMed] [Google Scholar]
- (59).Yang Q; Li J; Wang X; Xiong H; Chen L Ternary Emission of a Blue-, Green-, and Red-Based Molecular Imprinting Fluorescence Sensor for the Multiplexed and Visual Detection of Bovine Hemoglobin. Anal. Chem 2019, 91, 6561–6568. [DOI] [PubMed] [Google Scholar]
- (60).Barati A; Shamsipur M; Abdollahi H Hemoglobin Detection using Carbon Dots as a Fluorescence Probe. Biosens. Bioelectron 2015, 71, 470–475. [DOI] [PubMed] [Google Scholar]
- (61).Liu Y; Wang Y; Jiang K; Sun S; Qian S; Wu Q; Lin H A Persistent Luminescence-Based Label-Free Probe for the Ultrasensitive Detection of Hemoglobin in Human Serum. Talanta 2020, 206, 120206. [DOI] [PubMed] [Google Scholar]
- (62).Stöber W; Fink A; Bohn E Controlled Growth of Monodisperse Silica Spheres in the Micron Size Range. J. Colloid Interface Sci 1968, 26, 62–69. [Google Scholar]
Associated Data
This section collects any data citations, data availability statements, or supplementary materials included in this article.
Supplementary Materials
Movie 1: Animation of the motion of SiO2 nanoparticles (AVI)
Movie 2: Dynamic processes of acoustofluidic-based nanoparticle-enrichment for SiO2@R, G@SiO2 and the mixture of these two probes (MP4)