

Abstract
Background
Most exacerbations of chronic obstructive pulmonary disease (COPD) are triggered by respiratory tract infections. Adaptive immunity via antibody production is important in preventing infections. Impaired antibody production is reported to be associated with an increased risk of exacerbations of COPD. In the present study, we elucidated whether reduced free light chains (FLCs), which are excessive amounts of light chains produced during antibody synthesis and can be used to estimate systemic antibody production, may be a promising biomarker to predict the risk of exacerbations of COPD.
Methods
We enrolled stable male patients with COPD and prospectively observed them for 2 years. At baseline, serum combined FLC (cFLC; sum of kappa and lambda values) and pulmonary function were evaluated. Exacerbation was defined as a worsening of symptoms requiring treatments with antibiotics, corticosteroids or both.
Results
63 patients with stable COPD were enrolled (72.8±8.1 years, GOLD A/B/C/D=24/28/6/5), and 51 patients completed the 2-year follow-up. Serum cFLC was 31.1 mg·L−1 on average and ranged widely (1.4 to 89.9 mg·L−1). The patients with low cFLC (below the mean−sd, n=6) experienced a significantly shorter time to the first exacerbation of COPD (p<0.0001 by the log-rank test). A multivariate Cox proportional hazard model, including the COPD assessment test score, % predicted forced expiratory volume in 1 s (FEV1 % pred), and number of previous exacerbations demonstrated that low cFLC and low FEV1 % pred were independently and significantly correlated with the risk for exacerbations of COPD.
Conclusion
Low cFLC may be a B-cell-associated novel biomarker associated with risk of COPD exacerbation.
Short abstract
Impaired antibody production is associated with an increased risk for exacerbations of COPD. Low serum free light chain is a novel B-cell-associated biomarker for COPD exacerbations. https://bit.ly/35cgMTC
Introduction
Exacerbations of chronic obstructive pulmonary disease (COPD) are defined as a worsening of symptoms that result in the need for additional therapy [1]. Exacerbations of COPD impose negative impacts on lung function, emphysema, health-related quality of life and prognosis [2–4], and frequent exacerbations may cause progressive deterioration of COPD [5]. Although many studies have identified various clinical features or biomarkers associated with frequent exacerbations of COPD [6–9], the prediction and prevention of exacerbations of COPD are still challenging in clinical settings.
COPD is characterised by chronic inflammation in the airways as well as systemic inflammation. There is accumulating evidence that the adaptive immune response contributes to pathogenesis of COPD [10–12] and might have conflicting properties in both autoimmunity and self-protection. For example, it has been revealed that an anti-elastin autoantibody from B-cells is associated with emphysema [11, 13], and upregulated B-cell-related genes are correlated with emphysema severity [14]. Moreover, increased B-cell infiltration into the walls of small airways is correlated with decreased alveolar attachments in COPD [15]. On the other hand, secretory IgA deficiency in the small airways of COPD is associated with persistent inflammation, fibrotic remodelling and bacterial invasion [16]. In addition, a decrease in the mucosal nontypeable Haemophilus influenzae-specific antibody is associated with greater systemic and airway inflammation and a history of more frequent exacerbations in patients with COPD [17]. Moreover, there is remarkable evidence showing a significant relationship between decreased serum antibodies and frequent exacerbations of COPD, including our previous report [18, 19].
As most exacerbations are triggered by bacterial, viral, or combined infections [20], adaptive immunity by B-cells in COPD may serve for self-protection in preventing exacerbations. To confirm this hypothesis, we focused on free light chains (FLCs) for the assessment of adaptive immunity by B-cells in the present study. FLCs are excessive amounts of light chains relative to heavy chains that are produced during Ig synthesis and secreted into the blood [21] and have been used to estimate systemic B-cell activation in various inflammatory diseases [18, 19]. The aim of the present study was to elucidate whether low serum FLC, which is associated with decreased antibody production, would be a good marker to predict patients with COPD at a risk of future exacerbations.
Methods
Patients and study design
This was a prospective observational study conducted at Kyoto University. Outpatients with stable COPD were enrolled in the study between May 2013 and July 2014. The inclusion criteria were as follows: 1) a smoking history of 10 pack-years or more; 2) a diagnosis of COPD according to the Global Initiative for Chronic Obstructive Lung Disease (GOLD) criteria [22]; and 3) no COPD exacerbations within the past 4 weeks. The exclusion criteria were as follows: 1) α-1 anti-trypsin deficiency; 2) a combination of other respiratory diseases, such as bronchial asthma, interstitial pneumonia, or bronchiectasis; 3) a history of malignant neoplasms other than prostate cancer or endoscopically resected early cancer within the past 5 years; 4) a history of myeloproliferative disorders, including multiple myeloma and monoclonal gammopathy of undetermined significance; 5) comorbid liver cirrhosis; 6) comorbid end-stage renal disease undergoing maintenance dialysis; 7) comorbid autoimmune diseases or vasculitis; or 8) the use of oral corticosteroids or immunosuppressants. The ethics committee of Kyoto University approved this study (approval no. E1664), and all subjects provided written informed consent prior to participating.
Clinical examinations
Symptoms were assessed using questionnaires such as the COPD assessment test (CAT) and the modified Medical Research Council (mMRC) dyspnoea scale. Information about comorbidities and past medical history was verified by interviews and medical records.
A pulmonary function test was performed following the inhalation of bronchodilators (400 µg of salbutamol and 80 μg of ipratropium). Spirometry, lung volume subdivisions, and the diffusion capacity of the lung for carbon monoxide (DLCO) were measured using a Chestac-65V instrument (Chest MI, Inc., Tokyo, Japan). The predicted pulmonary function values were calculated based on Japanese Respiratory Society equations [23].
Blood samples were collected at the time of the clinical examinations. Complete blood cell count, usual blood chemistry tests, and serum immunoglobulins (IgA, IgG, and IgM) were assessed. For the assessment of serum levels of FLCs, the serum was aliquoted and then stored at −80°C until analysis. For the assessment of lymphocyte fractions in peripheral blood mononuclear cells (PBMCs), PBMCs were isolated via gradient centrifugation method using Ficoll-Paque PLUS (GE Healthcare Japan, Tokyo, Japan) according to the manufacturer's manual and were frozen-stocked in Cell Banker 1 (Nippon Zenyaku Kogyo Co., Ltd., Fukushima, Japan) until analysis.
Measurement of FLCs
Serum levels of FLCs were measured via an ELISA using a commercially available kit (Immunoglobulin Free Light Chains Kappa and Lambda Human ELISA; BioVendor, Brno, Czech Republic, catalogue no. RD194088100R) according to the manufacturer's protocol. The amount of kappa chains and lambda chains were measured, and the serum levels of combined free light chains (cFLCs) were presented as the summation of kappa and lambda values.
Flow cytometric analysis of peripheral blood mononuclear cells
PBMCs were stained with anti-CD138-PE (clone; MI15), anti-CD27-APC (M-T271), anti-CD3-BV510 (UCHT1), anti-CD4-APC-H7 (RPA-T4), anti-CD8-PerCP-Cy5.5 (RPA-T8) (BD Bioscience, NJ, USA), anti-CD19-FITC (HIB19) (eBioScience, CA, USA), and anti-IgD-PE-Cy7 (IA6–2) (BioLegend, CA, USA) after being stained with fixable viability stain 450 and (BD Bioscience) blocking with Fc block (BD Bioscience). Cells were analysed using a BD LSRFortessa (BD Bioscience), and data were analysed using FlowJo software (version 7.6.5, Tree Star, CA, USA Bioscience). Naïve B-cells were defined by CD19+CD27−IgD+, nonclass-switched memory B-cells by CD19 CD27+IgD+ and class-switched memory B-cells by CD19+CD27+IgD−.
Exacerbation criteria
Exacerbations of COPD were prospectively identified using a symptom diary as in our previous study [8]. According to previous reports [8, 24], the definition of exacerbation was the worsening of symptoms as follows: two or more occurrences of three major symptoms (i.e., increase in dyspnoea, sputum purulence and increased sputum volume) or any one major symptom with any one minor symptom (i.e., increase in nasal discharge, wheezing, sore throat, cough or fever) for at least 2 consecutive days and requiring treatment with oral corticosteroids or antibiotics or both.
Statistical analysis
The data pertaining to the continuous variables are expressed as the mean±sd unless otherwise specified. All statistical analyses were performed using JMP 10.0.2 (SAS Institute, Inc., NC, USA).
In the present study, patients were subdivided into subgroups using the cut-off value of the mean±sd value. Differences in clinical parameters between subgroups were analysed by the Kruskal–Wallis test for the continuous variables and the Chi-squared test for the categorical variables. The relationship between cFLC subgroups and the time to the first exacerbation of COPD was analysed using Kaplan–Meier curves and log-rank tests. Both univariate and multivariate Cox proportional hazards analyses were performed to investigate the relationship between the clinical parameters, including those in the cFLC subgroups, and the time to the first exacerbation of COPD. The results of the Cox proportional hazards analysis are depicted as hazard ratios (HRs) with 95% confidence intervals (CIs). A p-value <0.05 was considered statistically significant.
Results
Patient characteristics
In total, 66 male patients with COPD agreed to be enrolled in the present prospective study (Figure S1). During the initial examination, three patients were excluded, and in total, 63 patients were included in the follow-up study. During the follow-up, six patients developed malignancy, two patients died due to nonrespiratory diseases or the exacerbation of COPD, and four patients dropped out of the follow-up. Ultimately, 51 patients with COPD completed the 2-year follow-up. The characteristics of the study subjects (n=63) are provided in table 1. The mean age of study participants was 72.8±8.1 years. The number of patients in each GOLD stage was 16 (25.4%), 26 (41.3%), 14 (22.2%) and 7 (11.1%) in GOLD stage I, II, III and IV, respectively, and the mean±sd value of the percentage of the predicted value of forced expiratory volume in 1 s (FEV1 % pred) was 61.4±21.9%. Regarding maintenance inhalation therapy, 27.0% (n=17) of patients were treated with long-acting muscarinic antagonist (LAMA) monotherapy, and 23.8% (n=15) were treated with a regimen including an inhaled corticosteroid (ICS). Additionally, 41.2% (n=26) were not treated with any maintenance inhalation therapy.
TABLE 1.
Patient characteristics (n=63)
| Variable | |
| Sex M/F n | 63/0 |
| Age years | 72.8±8.1 (49–91) |
| Height cm | 165.5±6.5 (149.0–178.0) |
| Weight kg | 59.6±8.7 (39.3–83.0) |
| BMI kg·m−2 | 21.7±2.8 (15.6–27.9) |
| Smoking status former/current n | 55/8 |
| Smoking history pack-years | 67.6±39.1 (17.4–192) |
| Maintenance inhalation therapy | |
| LABA | 2 (3.2) |
| LABA/ICS | 3 (4.8) |
| LAMA | 17 (27.0) |
| LAMA/LABA | 3 (4.8) |
| LAMA/LABA/ICS | 12 (19.0) |
| None | 26 (41.2) |
| Mucolytics n (%) | 15 (23.8) |
| Macrolides n (%) | 3 (4.8) |
| mMRC 0/1/2/3/4 n | 25/24/13/1/0 |
| CAT points | 11.2±7.4 (0–30) |
| Prior exacerbation yes/no n | 17/46 |
| FEV1 L | 1.66±0.68 (0.52–3.21) |
| FEV1 % pred | 61.4±21.9 (20.0–112.0) |
| GOLD stage, I/II/III/IV n | 16/26/14/7 |
| GOLD classification, A/B/C/D n | 24/28/6/5 |
| FVC L | 3.21±0.85 (1.46–5.66) |
| RV/TLC % | 41.5±9.6 (24.6–67.8) |
| DLCO mL·min−1mmHg−1 | 12.67±4.63 (4.09–24.93) |
| DLCO % pred | 53.0±17.9 (16.8–95.4) |
| WBC μL-1 | 6701±1864 (3000–12 800) |
| Neutrophils μL-1 | 4145±1487 (1548–10 714) |
| Lymphocytes μL-1 | 1864±653 (815–3722) |
| Eosinophils μL-1 | 196±115 (0–628) |
| Eosinophils % | 3.0±1.5 (0.0–6.1) |
| Cre mg·L−1 | 0.90±0.20 (0.58–1.87) |
| eGFR mL·min−1·1.73 m−2 | 67.1±15.1 (27.3–100.8) |
| CRP mg·L−1 | 0.22±0.40 (0.0–2.5) |
| IgA mg·L−1 | 254.3±112.1 (96–713) |
| IgG mg·L−1 | 1286.6±267.3 (724–1801) |
| IgM mg·L−1 | 75.7±36.4 (17–192) |
| CD4+ T-cells % of lymphocytes | 44.46±9.57 (22.98–67.50) |
| CD8+ T-cells % of lymphocytes | 17.18±7.97 (3.95–42.55) |
| CD138+ plasma cells % of lymphocytes | 0.20±0.26 (0.01–1.20) |
| CD19+ B-cells % of lymphocytes | 5.81±3.09 (1.06–17.00) |
| CD19+CD27−IgD+ naïve B-cells % of B-cells | 67.33±14.83 (13.20–93.84) |
| CD19+CD27+IgD+ nonswitched memory B-cells % of B-cells | 7.87±4.79 (2.46–34.49) |
| CD19+CD27+IgD− switched memory B-cells % of B-cells | 21.25±11.90 (3.31–61.93) |
| Kappa-FLC mg·L−1 | 13.4±8.9 (0.6–51.5) |
| Lambda-FLC mg·L−1 | 17.7±9.6 (0.8–75.3) |
| cFLC mg·L−1 | 31.1±14.7 (1.4–89.9) |
Data are presented as mean±sd or n (%), unless otherwise stated. BMI: body mass index; LABA: long-acting β2-agonist; ICS: inhaled corticosteroid; LAMA: long-acting muscarinic antagonist; mMRC: modified British Medical Research Council scale; CAT: COPD assessment test; FEV1: forced expiratory volume in 1 s; % pred: % predicted; GOLD: Global Initiative for Chronic Obstructive Lung Disease; FVC: forced vital capacity; RV/TLC: residual volume/total lung capacity ratio; DLCO: diffusing capacity of the lung for carbon monoxide; WBC: white blood cell; Cre: creatinine; eGFR: estimated glomerular filtration rate; CRP: C-reactive protein; FLC: free light chain; cFLC: combined free light chain.
Comparison between patients with low cFLC and those with high cFLC
The average cFLC was 31.1±14.7 mg·L−1 and ranged from 1.4 to 89.9 mg·L−1 (table 1 and figure 1). The patients were subdivided into three subgroups using the cut-off value of the mean±sd value (cFLC=16.4 and 45.8 mg·L−1). Those with low cFLC (n=6) had significantly lower serum IgA (p=0.0091) and lower C-reactive protein (CRP) (p=0.043) levels. There was no significant difference in the proportion of patients with different medications, symptoms, pulmonary functions, eosinophil counts and lymphocyte fractions in PBMCs analysed by flow cytometry (table 2).
FIGURE 1.
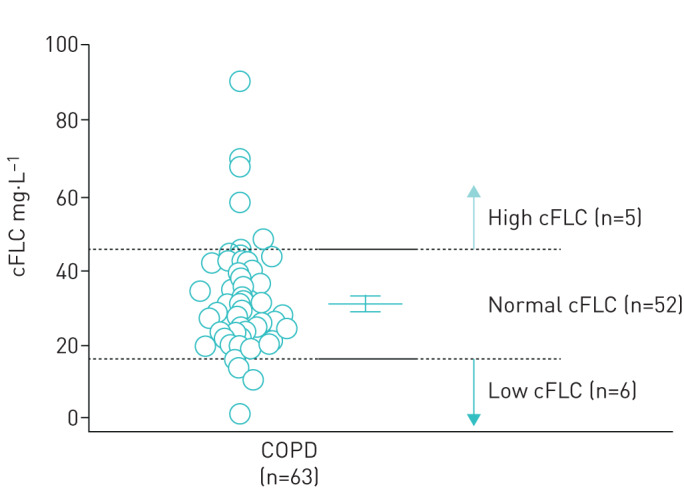
Distribution of combined free light chains (cFLCs) of the study subjects (n=63). The patients were subdivided into subgroups based on distribution of cFLC, and the mean±sd of the study subjects was used as the cut-off value. The bars indicate the mean value (± 95% CI) and sd.
TABLE 2.
Comparison of pulmonary function and laboratory data between patient groups according to level of combined free light chain (cFLC)
| Variable | Low (n=6) | Normal (n=52) | High (n=5) | p-value |
| Age years | 68.5±6.9 | 73.4±8.5 | 71.8±3.1 | 0.2 |
| BMI kg·m−2 | 20.3±2.7 | 22.0±2.9 | 20.2±1.4 | 0.2 |
| Smoking status, former/current | 6/0 | 7/45 | 4/1 | 0.4 |
| Smoking history pack-years | 47.5±18.7 | 71.7±41.4 | 48.4±5.8 | 0.3 |
| ICS use y/n | 1/5 | 13/39 | 1/4 | 0.8 |
| mMRC unit | 0.67±0.82 | 0.87±0.77 | 0.80±1.30 | 0.8 |
| CAT points | 14.3±7.1 | 10.6±7.5 | 13.4±6.8 | 0.3 |
| Prior exacerbation, y/n | 0/6 | 17/35 | 0/5 | 0.1 |
| Prior exacerbation n | 0.0±0.0 | 0.4±0.7 | 0.0±0.0 | 0.2 |
| FEV1 L | 1.56±0.69 | 1.69±0.69 | 1.52±0.61 | 0.6 |
| FEV1 % pred | 55.6±22.3 | 63.0±22.2 | 52.4±19.0 | 0.2 |
| FVC L | 3.34±1.00 | 3.20±0.84 | 3.05±0.98 | 0.6 |
| RV/TLC % | 40.9±14.6 | 41.6±9.2 | 41.0±9.7 | 0.7 |
| DLCO mL·min−1·mmHg−1 | 13.02±6.32 | 12.97±4.45 | 9.15±3.66 | 0.7 |
| WBC μL-1 | 6200±2256 | 6672±1686 | 7606±3137 | 0.8 |
| Neutrophils µL-1 | 3853±1529 | 4067±1226 | 5308±3212 | 0.7 |
| Lymphocytes µL-1 | 1727±750 | 1903±666 | 1625±343 | 0.7 |
| Eosinophils μL-1 | 157±124 | 207±114 | 121±87 | 0.3 |
| Eosinophils % | 2.68±2.02 | 3.09±1.38 | 2.16±2.03 | 0.3 |
| Cre mg·dL−1 | 0.81±0.11 | 0.91±0.21 | 0.92±0.13 | 0.4 |
| eGFR mL·min−1·1.73 m−2 | 74.4±10.5 | 66.6±15.8 | 63.6±10.4 | 0.3 |
| CRP mg·dL−1 | 0.05±0.05 | 0.24±0.43 | 1.52±1.93 | 0.043 |
| IgA mg·dL−1 | 152.6±47.0 | 263.8±107.2 | 260.0±168.9 | 0.0091 |
| IgG mg·dL−1 | 1078.4±304.8 | 1315.0±263.9 | 1205.6±189.6 | 0.2 |
| IgM mg·dL−1 | 66.6±37.0 | 77.0±37.1 | 71.6±32.9 | 0.6 |
| CD4+ T-cells µL-1 | 756.4±289.9 | 858.0±392.2 | 796.8±188.0 | 0.9 |
| CD8+ T-cells µL-1 | 294.9±341.7 | 337.9±217.9 | 305.7±137.7 | 0.3 |
| CD138+ plasma cells count µL-1 | 7.1±14.3 | 3.1±3.9 | 1.6±0.9 | 1.0 |
| CD19+ B-cells count µL-1 | 103.0±103.4 | 113.4±73.6 | 82.3±22.1 | 0.6 |
| CD19+CD27−IgD+ naïve B-cells % of B-cells | 67.71±6.11 | 67.23±15.59 | 68.05±13.79 | 1.0 |
| CD19+CD27+IgD+ nonclass-switched memory B-cells % of B-cells | 8.68±3.48 | 7.82±5.10 | 7.23±2.34 | 0.6 |
| CD19+CD27+IgD− class-switched memory B-cells % of B-cells | 19.44±8.05 | 21.66±12.62 | 18.88±8.12 | 0.9 |
Data are presented as mean±sd, unless otherwise stated. BMI: body mass index; ICS: inhaled corticosteroid; mMRC: modified British Medical Research Council scale; CAT: COPD assessment test; FEV1: forced expiratory volume in 1 s; % pred: % predicted; GOLD: Global Initiative for Chronic Obstructive Lung Disease; FVC: forced vital capacity; RV/TLC: residual volume/total lung capacity ratio; DLCO: diffusing capacity of the lung for carbon monoxide; WBC: white blood cell; Cre: creatinine; eGFR: estimated glomerular filtration rate; CRP: C-reactive protein.
Kaplan–Meier curve for the time to first exacerbation based on cFLC subgroups
Kaplan–Meier curves based on the cFLC subgroups are shown in figure 2. The patients with low cFLC showed significantly shorter time to the first exacerbation of COPD than the other patients (p<0.0001 by a log-rank test).
FIGURE 2.
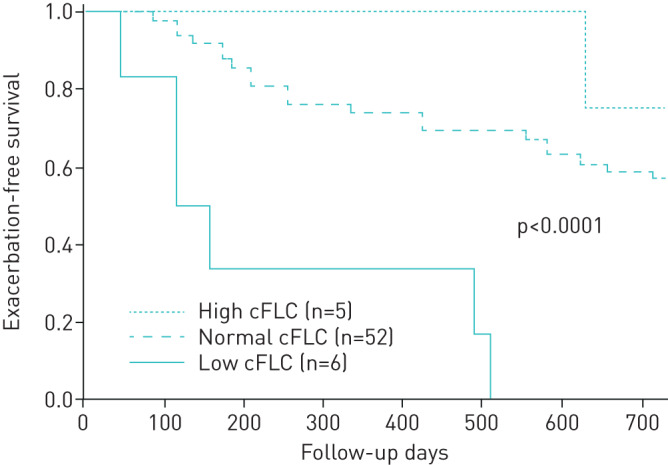
Kaplan–Meier curve for the time to the first moderate/severe exacerbation based on combined free light chain (cFLC) subgroups. The patients with low cFLC (solid line, n=6) showed significantly shorter time to the first exacerbation of COPD than patients with normal (dashed line, n=52) or high cFLCs (dotted line, n=5) (p<0.0001 by log-rank test).
Cox proportional hazards analysis for the time to first exacerbation
The relationships between the time to the first exacerbation and clinical parameters, including cFLC, were evaluated using univariate Cox proportional hazards analysis. A higher mMRC dyspnoea scale score (HR 1.65, p=0.02), a higher CAT score (HR 1.09, p=0.0006), higher number of previous exacerbations (HR 2.17, p=0.0048), a lower FEV1 % pred (HR 0.97, p<0.0001), and a higher residual volume/total lung capacity ratio (RV/TLC) (HR 1.07, p=0.018) were significantly correlated with the time to the first exacerbation, but the eosinophil count was not correlated (table 3). Although cFLC showed only a trend for risk for the first exacerbation (p=0.06); after dichotomising patients into subgroups, patients with low cFLC (<16.36 mg·L−1) showed a significantly higher risk for exacerbation compared with patients with normal or high cFLC (HR 7.42, 95% CI 2.63–18.47, p=0.0005).
TABLE 3.
Univariate Cox proportional hazard analyses for the time to the first exacerbation of COPD
| Variable | HR | 95% CI | p-value |
| Age years | 0.98 | 0.93–1.03 | 0.4 |
| BMI, kg·m−2 | 0.89 | 0.77–1.02 | 0.096 |
| mMRC unit | 1.65 | 1.08–2.50 | 0.02 |
| CAT points | 1.09 | 1.04–1.14 | 0.0006 |
| Prior exacerbation n | 2.17 | 1.29–3.51 | 0.0048 |
| FEV1 L | 0.32 | 0.16–0.60 | 0.0002 |
| FEV1 % pred | 0.97 | 0.95–0.98 | <0.0001 |
| RV/TLC % | 1.07 | 1.02–1.11 | 0.018 |
| DLCO mL·min−1·mmHg−1 | 0.94 | 0.87–1.02 | 0.2 |
| WBC ×100·μL-1 | 0.99 | 0.97–1.01 | 0.5 |
| Neutrophils ×100·μL-1 | 0.99 | 0.96–1.01 | 0.4 |
| Eosinophils ×10·μL-1 | 0.99 | 0.95–1.03 | 0.6 |
| Eosinophils % | 0.94 | 0.72–1.20 | 0.6 |
| eGFR mL·min−1·1.73 m−2 | 1.01 | 0.99–1.04 | 0.4 |
| CRP mg·dL−1 | 0.61 | 0.13–1.55 | 0.4 |
| IgA mg·dL−1 | 0.99 | 0.99–1.00 | 0.34 |
| cFLC mg·dL−1 | 0.97 | 0.94–1.00 | 0.06 |
| cFLC low/normal versus high# | 1.44 | 0.43–9.00 | 0.59 |
| cFLC low versus normal/high# | 7.42 | 2.63–18.47 | 0.0005 |
HR: hazard ratio; CI: confidence interval; BMI: body mass index; mMRC: modified British Medical Research Council scale; CAT: COPD assessment test; FEV1: forced expiratory volume in 1 s; % pred: % predicted; RV/TLC: residual volume/total lung capacity ratio; DLCO: diffusing capacity of the lung for carbon monoxide; WBC: white blood cell; eGFR: estimated glomerular filtration rate; CRP: C-reactive protein; cFLC: combined free light chain. #: Variable was used as the nominal variable.
In the multivariate Cox proportional hazards analyses, we analysed four models, including these established parameters after adjusting for age. In models 1 and 2, FEV1 % pred (HR 0.97, p=0.0012) was significantly correlated with the time to the first exacerbation. In models 3 and 4, cFLC was included as a continuous variable or categorised variable with regard to cFLC values, such as low versus normal/high cFLC.
Both models revealed that FEV1 % pred and cFLC were independently and significantly correlated with the time to the first exacerbation (table 4). In particular, patients with low cFLC showed significant high risk for exacerbation compared with patients with normal/high cFLC (HR 6.74, p=0.0010) independently of FEV1 % pred.
TABLE 4.
Multivariate Cox proportional hazard analyses for the time to the first exacerbation of COPD
| Variable | Model 1 | Model 2 | Model 3 | Model 4 | ||||
| HR | p-value | HR | p-value | HR | p-value | HR | p-value | |
| Age years | 0.95 | 0.044 | 0.95 | 0.040 | 0.10 | 0.09 | ||
| FEV1 % pred | 0.97 | 0.0012 | 0.97 | 0.0027 | 0.96 | <0.0001 | 0.96 | <0.0001 |
| Prior exacerbation n | 0.3 | # | # | # | ||||
| CAT unit | # | 0.07 | # | # | ||||
| cFLC mg·L−1 | # | # | 0.96 | 0.017 | # | |||
| cFLC versus normal or high¶ | # | # | # | 6.74 | 0.0010 | |||
HR: hazard ratio; mMRC: modified British Medical Research Council scale; FEV1 % pred: % predicted forced expiratory volume in 1 s; cFLC: combined free light chain. #: Variables not included in the model; ¶: variable was used as the nominal variable.
Discussion
In this study, we demonstrated that serum FLC might be a good biomarker for identification of patients at a risk of future exacerbations of COPD. While established variables associated with frequent exacerbations of COPD, such as the FEV1, symptom score, mMRC, and previous exacerbations were significant, multivariate Cox proportional hazards analyses interestingly revealed that low serum cFLC was independently associated with the time to first exacerbation (HR 6.74) in addition to the severity of airflow limitation (FEV1 % pred).
We could not confirm that eosinophils are associated with the risk of COPD exacerbation. Conflicting reports exist regarding whether an increased blood eosinophil level is associated with the risk of COPD exacerbation [25–28]. This discrepancy has been speculated to be due to the difference in COPD severity or the variation in eosinophil counts determined by a single measurement [28]. In the present study, no significant relationship was observed between eosinophil count and risk of COPD exacerbation. The mean±sd FEV1 % pred value in the current cohort was 61.4±21.9%, which is higher than the values in the Copenhagen General Population Study [25], COPD Gene study and ECLIPSE study [26]. The preserved lung function in the present cohort might contribute to the low exacerbation rate in the present study (0.66±0.93 per 2 years), which may explain why no association was observed between the eosinophil count and the risk of COPD exacerbation. The eosinophil count was measured only once in the present study. Approximately 40% of patients had eosinophil counts that oscillated across the cut-off value [27]. Because of the small cohort size in the present study, the oscillation in eosinophil counts might weaken the association between the eosinophil count and the exacerbation risk.
Most exacerbations of COPD are reported to be triggered by respiratory infections [20]. Immunoglobulins play a major role in humoral immunity against infections, and the secretary dysfunction of immunoglobulins may lead to various infectious diseases. Secretory IgA deficiency in the small airways of COPD or a decreased mucosal specific antibody have been reported to be associated with airway inflammation, airway remodelling or frequent exacerbations of COPD [18, 19]. Moreover, frequent exacerbations of COPD may be associated with an underlying antibody deficiency syndrome, and Ig replacement therapy is effective for reducing the rate of exacerbations of COPD [29]. Our findings are consistent with those from previous studies, because low cFLC may reflect secretory dysfunction in patients with COPD. Moreover, cFLC may be a more sensitive biomarker than IgA for predicting the risk of future exacerbations because we found only a trend and not a significant difference in serum IgA level. In fact, in a large cohort study, decreased but measurable subnormal serum IgA levels were demonstrated to be associated with a higher risk for exacerbations of COPD [30]. Moreover, if patients were dichotomised according to the mean−1×sd of the serum IgA value, the univariate analysis confirmed that patients with low serum IgA demonstrated a trend for a shorter time to the first exacerbation of COPD (p=0.087, data not shown). Therefore, these results might be due to the small sample size included in the present study.
During Ig synthesis, excess amounts of FLCs are produced and secreted into the blood [21]. High cFLC levels are observed in several autoimmune and inflammatory conditions, and cFLC levels are thought to reflect the systemic antibody production activity of B-cells [18, 19]. Not only IgA but also IgG subclass deficiency is reported to be associated with an increased risk of exacerbations of COPD [31]. Because cFLC has a shorter clearance time than IgA, IgG and IgM [32], cFLC might clearly reflect decreased antibody production.
However, the roles of FLCs in pathogenesis and pathophysiology are not yet well known. Some reports have shown different associations with pathophysiology and pathogenesis in COPD. Braber et al. [30] reported that patients with COPD showed higher levels of FLCs than control subjects. In addition, FLCs may exert biological functions, such as the inhibition of apoptosis [33] and the activation of neutrophils [30]. In the present study, the patients with low cFLC showed significantly lower CRP levels than those with high cFLC. This finding suggests that cFLC may be produced in the context of systemic inflammation in COPD. Systemic inflammation itself may lead to high risks of mortality, comorbidities or exacerbations in COPD patients [9, 34–36], and it is probable that extremely high FLC levels may be associated with the risk of mortality or comorbidities [37, 38]. It is possible that due to differences in the study population, we could not confirm such a biphasic association in COPD patients. In fact, patients with a high cFLC seem to be associated with a low risk for exacerbations of COPD (figure 2). This might also be due to the small number of the study population. In addition, decreased antibody production might be more important than systemic inflammation in predicting the risk of exacerbations of COPD.
A previous report demonstrated that current smokers had higher percentages of class-switched memory B-cells than nonsmokers, irrespective of COPD [16, 29, 39]. We confirmed that among the study subjects, current smokers with COPD demonstrated a higher proportion of CD19+CD27+IgD− class-switched memory B-cells than ex-smokers with COPD (current smoker versus ex-smoker; 30.5±14.4 versus 20.0±11.1, p=0.027). In addition, patients with COPD are reported to have a lower proportion of memory B-cells than healthy subjects [40]. These findings suggest that cigarette smoke might affect B-cell functions and that there might be unique alterations in patients with COPD compared to healthy subjects.
In the present study, cFLC was not associated with the number of plasma cells or the proportions of B-cells, such as naïve B-cells, nonclass-switched memory B-cells and class-switched memory B-cells (table 2). This observation implies that the peripheral B-cell fraction cannot predict systemic antibody production in patients with COPD or that there might be dysfunctional antibody production in some patients with COPD. It is necessary to explore the exact role of the B-cell response or its involvement in COPD pathogenesis.
In order to further examine the cFLC value, we measured cFLC during an exacerbation of COPD in a limited number of patients. Compared to the stable condition, the cFLC value was significantly higher during exacerbation (data not shown), but the extent of cFLC value elevation varied among individuals. This variation may be informative in determining the mechanisms of systemic reactions and recovery from exacerbation. We did not conduct follow-up evaluations on these patients; therefore, the longitudinal changes of cFLC values are unknown. In addition, regarding reproducibility, only three patients underwent a two-point evaluation in the stable condition. They did not have any exacerbation during the interval (greater than 4 months), and their cFLC value had excellent reproducibility (interclass correlation coefficient=0.96).
From the results of the present study, we could conclude that low cFLC might be associated with the risk of a subsequent exacerbation. However, it is still necessary to conduct further longitudinal evaluation of cFLC values to identify “frequent” exacerbators.
There are several limitations to this study. First, the sample size was small. Female patients were excluded because of the small number of female patients in the cohort. In addition, approximately one-fifth of study subjects did not complete the follow-up, partially due to the relatively older age of the patients. However, the rates of and reasons for discontinuation of follow-up were similar among the cFLC subgroups, and we could confirm the significance of certain established variables, such as FEV1, previous exacerbation, and symptoms. We can speculate that our observation was sufficiently consistent with previous investigations. Second, this study cohort included a variety of patients with COPD, including patients with fairly mild disease. Even when we excluded the patients with mild disease whose FEV1/FVC was higher than the lower limit of normal, low cFLC was significantly associated with an increased risk for exacerbations of COPD. Third, there was no replication cohort and no preliminary information on the distribution of cFLC in normal subjects. To develop an appropriate cut-off value to predict future exacerbations in COPD, it will be necessary to refer to the distribution of cFLC in normal subjects as well. Further investigations using replication cohorts are required. Fourth, we did not evaluate the phenotype or triggers of exacerbation in the present study. In addition, a causal link between low cFLC and an increased risk for exacerbations of COPD was not directly demonstrated in the present study. There might be differences in the causes of exacerbation between the patients with low cFLC and those with normal cFLC. In addition, we could not include the influence of vaccination in the present analysis. In Japan, public support for vaccinations against pneumococcus or influenza virus in older people is available, but no data were provided regarding individual statuses. There are likely certain effects of these vaccinations in the prevention of exacerbation; at the same time, such vaccinations may change the immune profiles, such as those of IgG, IgA, and cFLC. These factors may be confounding influences in the present study. However, our data in this study also imply that patients with low cFLC might require intensive vaccinations.
Conclusions
Low serum cFLC, which is reported to reflect systemic antibody production, was associated with the risk for exacerbations of COPD. Decreased antibody production might be a specific feature related to higher risk for a future exacerbation of COPD within 2 years.
Supplementary material
Please note: supplementary material is not edited by the Editorial Office, and is uploaded as it has been supplied by the author.
FIGURE S1 Flow diagram of the study subjects 00288-2019.figureS1 (448.4KB, jpg)
Acknowledgements
The authors thank Kunihiko Terada, Hirofumi Kiyokawa, Tamaki Takahashi and Yoshinori Fuseya for their help in the preliminary analysis, study design and data acquisition. The authors also thank Itsuto Amano for his help in data analysis. Flow cytometric analysis using the BD LSRFortessa was performed at the Medical Research Support Center, Graduate School of Medicine, Kyoto University, which was supported by the Platform for Drug Discovery, Informatics, and Structural Life Science from the Ministry of Education, Culture, Sports, Science and Technology, Japan.
Footnotes
This article has supplementary material available from openres.ersjournals.com
Author contributions: K. Tanimura designed the study, collected and analysed the data, and wrote the manuscript. S. Sato contributed to the study design, analysed and interpreted the data, and assisted with the editing of the manuscript. N. Tanabe contributed to the analysis and interpretation of the data and editing of the manuscript. A. Sato, K. Hasegawa, K. Uemasu and Y. Hamakawa contributed to the study design and data collection and analysis. T. Hirai contributed to the acquisition of funding and the data interpretation. S. Muro designed the study, contributed to the acquisition of funding, analysed and interpreted the data, and assisted with the editing of the manuscript. S. Sato takes responsibility for the integrity of the project as a whole, from its inception to the manuscript's publication. All authors have approved the final version of the manuscript.
Conflict of interest: K. Tanimura has nothing to disclose.
Conflict of interest: S. Sato has nothing to disclose.
Conflict of interest: A. Sato has nothing to disclose.
Conflict of interest: N. Tanabe has nothing to disclose.
Conflict of interest: K. Hasegawa has nothing to disclose.
Conflict of interest: K. Uemasu has nothing to disclose.
Conflict of interest: Y. Hamakawa has nothing to disclose.
Conflict of interest: T. Hirai has nothing to disclose.
Conflict of interest: S. Muro has nothing to disclose.
Support statement: The present work was supported by the Japan Society for the Promotion of Science (Grants-in-Aid for scientific research number 16 K09536) and the Shimizu Foundation for Immunology and Neuroscience Grant for 2012. Funding information for this article has been deposited with the Crossref Funder Registry.
References
- 1.Global Initiative for Chronic Obstructive Lung Disease. The Global Strategy for the Diagnosis, Management and Prevention of COPD www.goldcopd.com Date last accessed: April 22, 2019.
- 2.Anzueto A, Leimer I, Kesten S. Impact of frequency of COPD exacerbations on pulmonary function, health status and clinical outcomes. Int J Chron Obstruct Pulmon Dis 2009; 4: 245–251. [DOI] [PMC free article] [PubMed] [Google Scholar]
- 3.Tanabe N, Muro S, Hirai T, et al. Impact of exacerbations on emphysema progression in chronic obstructive pulmonary disease. Am J Respir Crit Care Med 2011; 183: 1653–1659. [DOI] [PubMed] [Google Scholar]
- 4.Rothnie KJ, Mullerova H, Smeeth L, et al. Natural history of chronic obstructive pulmonary disease exacerbations in a general practice-based population with chronic obstructive pulmonary disease. Am J Respir Crit Care Med 2018; 198: 464–471. [DOI] [PMC free article] [PubMed] [Google Scholar]
- 5.Wedzicha JA, Brill SE, Allinson JP, et al. Mechanisms and impact of the frequent exacerbator phenotype in chronic obstructive pulmonary disease. BMC Med 2013; 11: 181. [DOI] [PMC free article] [PubMed] [Google Scholar]
- 6.Hurst JR, Vestbo J, Anzueto A, et al. Susceptibility to exacerbation in chronic obstructive pulmonary disease. N Engl J Med 2010; 363: 1128–1138. [DOI] [PubMed] [Google Scholar]
- 7.Le Rouzic O, Roche N, Cortot AB, et al. Defining the “frequent exacerbator” phenotype in COPD: a hypothesis-free approach. Chest 2018; 153: 1106–1115. [DOI] [PubMed] [Google Scholar]
- 8.Terada K, Muro S, Sato S, et al. Impact of gastro-oesophageal reflux disease symptoms on COPD exacerbation. Thorax 2008; 63: 951–955. [DOI] [PubMed] [Google Scholar]
- 9.Thomsen M, Ingebrigtsen TS, Marott JL, et al. Inflammatory biomarkers and exacerbations in chronic obstructive pulmonary disease. JAMA 2013; 309: 2353–2361. [DOI] [PubMed] [Google Scholar]
- 10.Hogg JC, Chu F, Utokaparch S, et al. The nature of small-airway obstruction in chronic obstructive pulmonary disease. N Engl J Med 2004; 350: 2645–2653. [DOI] [PubMed] [Google Scholar]
- 11.Tanabe N, Vasilescu DM, Kirby M, et al. Analysis of airway pathology in COPD using a combination of computed tomography, micro-computed tomography and histology. Eur Respir J 2018; 51: 1701245. [DOI] [PMC free article] [PubMed] [Google Scholar]
- 12.Halper-Stromberg E, Yun JH, Parker MM, et al. Systemic markers of adaptive and innate immunity are associated with chronic obstructive pulmonary disease severity and spirometric disease progression. Am J Respir Cell Mol Biol 2018; 58: 500–509. [DOI] [PMC free article] [PubMed] [Google Scholar]
- 13.Brandsma CA, Kerstjens HA, van Geffen WH, et al. Differential switching to IgG and IgA in active smoking COPD patients and healthy controls. Eur Respir J 2012; 40: 313–321. [DOI] [PubMed] [Google Scholar]
- 14.Faner R, Cruz T, Casserras T, et al. Network analysis of lung transcriptomics reveals a distinct B-cell signature in emphysema. Am J Respir Crit Care Med 2016; 193: 1242–1253. [DOI] [PubMed] [Google Scholar]
- 15.Yerkovich ST, Hales BJ, Carroll ML, et al. Reduced rhinovirus-specific antibodies are associated with acute exacerbations of chronic obstructive pulmonary disease requiring hospitalisation. BMC Pulm Med 2012; 12: 37. [DOI] [PMC free article] [PubMed] [Google Scholar]
- 16.Putcha N, Paul GG, Azar A, et al. Lower serum IgA is associated with COPD exacerbation risk in SPIROMICS. PLoS One 2018; 13: e0194924. [DOI] [PMC free article] [PubMed] [Google Scholar]
- 17.Staples KJ, Taylor S, Thomas S, et al. Relationships between mucosal antibodies, non-typeable Haemophilus influenzae (NTHi) infection and airway inflammation in COPD. PLoS ONE 2016; 11: e0167250. [DOI] [PMC free article] [PubMed] [Google Scholar]
- 18.Lanteri A, Sobanski V, Langlois C, et al. Serum free light chains of immunoglobulins as biomarkers for systemic sclerosis characteristics, activity and severity. Autoimmun Rev 2014; 13: 974–980. [DOI] [PubMed] [Google Scholar]
- 19.Groot Kormelink T, Pardo A, Knipping K, et al. Immunoglobulin free light chains are increased in hypersensitivity pneumonitis and idiopathic pulmonary fibrosis. PLoS ONE 2011; 6: e25392. [DOI] [PMC free article] [PubMed] [Google Scholar]
- 20.Papi A, Bellettato CM, Braccioni F, et al. Infections and airway inflammation in chronic obstructive pulmonary disease severe exacerbations. Am J Respir Crit Care Med 2006; 173: 1114–1121. [DOI] [PubMed] [Google Scholar]
- 21.Hopper JE, Papagiannes E. Evidence by radioimmunoassay that mitogen-activated human blood mononuclear cells secrete significant amounts of light chain Ig unassociated with heavy chain. Cell Immunol 1986; 101: 122–131. [DOI] [PubMed] [Google Scholar]
- 22.Vogelmeier C, Hederer B, Glaab T, et al. Tiotropium versus salmeterol for the prevention of exacerbations of COPD. N Engl J Med 2011; 364: 1093–1103. [DOI] [PubMed] [Google Scholar]
- 23.Kubota M, Kobayashi H, Quanjer PH, et al. Clinical Pulmonary Functions Committee of the Japanese Respiratory S. Reference values for spirometry, including vital capacity, in Japanese adults calculated with the LMS method and compared with previous values. Respir Investig 2014; 52: 242–250. [DOI] [PubMed] [Google Scholar]
- 24.Burge PS, Calverley PM, Jones PW, et al. Randomised, double blind, placebo-controlled study of fluticasone propionate in patients with moderate to severe chronic obstructive pulmonary disease: the ISOLDE trial. BMJ 2000; 320: 1297–1303. [DOI] [PMC free article] [PubMed] [Google Scholar]
- 25.Vedel-Krogh S, Nielsen SF, Lange P, et al. Blood eosinophils and exacerbations in chronic obstructive pulmonary disease. The Copenhagen general population study. Am J Respir Crit Care Med 2016; 193: 965–974. [DOI] [PubMed] [Google Scholar]
- 26.Yun JH, Lamb A, Chase R, et al. Blood eosinophil count thresholds and exacerbations in patients with chronic obstructive pulmonary disease. J Allergy Clin Immunol 2018; 141: 2037–2047. [DOI] [PMC free article] [PubMed] [Google Scholar]
- 27.Casanova C, Celli BR, de-Torres JP, et al. Prevalence of persistent blood eosinophilia: relation to outcomes in patients with COPD. Eur Respir J 2017; 50: 1701162. [DOI] [PubMed] [Google Scholar]
- 28.Zysman M, Deslee G, Caillaud D, et al. Relationship between blood eosinophils, clinical characteristics, and mortality in patients with COPD. Int J Chron Obstruct Pulmon Dis 2017; 12: 1819–1824. [DOI] [PMC free article] [PubMed] [Google Scholar]
- 29.McCullagh BN, Comellas AP, Ballas ZK, et al. Antibody deficiency in patients with frequent exacerbations of chronic obstructive pulmonary disease (COPD). PLoS ONE 2017; 12: e0172437. [DOI] [PMC free article] [PubMed] [Google Scholar]
- 30.Braber S, Thio M, Blokhuis BR, et al. An association between neutrophils and immunoglobulin free light chains in the pathogenesis of chronic obstructive pulmonary disease. Am J Respir Crit Care Med 2012; 185: 817–824. [DOI] [PubMed] [Google Scholar]
- 31.Filho FS L, Ra SW, Mattman A, et al. Serum IgG subclass levels and risk of exacerbations and hospitalizations in patients with COPD. Respir Res 2018; 19: 30. [DOI] [PMC free article] [PubMed] [Google Scholar]
- 32.Nakano T, Matsui M, Inoue I, et al. Free immunoglobulin light chain: its biology and implications in diseases. Clin Chim Acta 2011; 412: 843–849. [DOI] [PubMed] [Google Scholar]
- 33.Cohen G, Rudnicki M, Deicher R, et al. Immunoglobulin light chains modulate polymorphonuclear leucocyte apoptosis. Eur J Clin Invest 2003; 33: 669–676. [DOI] [PubMed] [Google Scholar]
- 34.Miller J, Edwards LD, Agusti A, et al. Comorbidity, systemic inflammation and outcomes in the ECLIPSE cohort. Respir Med 2013; 107: 1376–1384. [DOI] [PubMed] [Google Scholar]
- 35.Agusti A, Edwards LD, Rennard SI, et al. Persistent systemic inflammation is associated with poor clinical outcomes in COPD: a novel phenotype. PLoS ONE 2012; 7: e37483. [DOI] [PMC free article] [PubMed] [Google Scholar]
- 36.Fermont JM, Masconi KL, Jensen MT, et al. Biomarkers and clinical outcomes in COPD: a systematic review and meta-analysis. Thorax 2019; 74: 439–446. [DOI] [PMC free article] [PubMed] [Google Scholar]
- 37.Hampson JA, Stockley RA, Turner AM. Free light chains: potential biomarker and predictor of mortality in alpha-1-antitrypsin deficiency and usual COPD. Respir Res 2016; 17: 34. [DOI] [PMC free article] [PubMed] [Google Scholar]
- 38.Shantsila E, Tapp LD, Lip GY. Free light chains in patients with acute coronary syndromes: relationships to inflammation and renal function. Int J Cardiol 2015; 185: 322–327. [DOI] [PubMed] [Google Scholar]
- 39.Takahashi T, Muro S, Tanabe N, et al. Relationship between periodontitis-related antibody and frequent exacerbations in chronic obstructive pulmonary disease. PLoS ONE 2012; 7: e40570. [DOI] [PMC free article] [PubMed] [Google Scholar]
- 40.Brandsma CA, Hylkema MN, Geerlings M, et al. Increased levels of (class switched) memory B cells in peripheral blood of current smokers. Respir Res 2009; 10: 108. [DOI] [PMC free article] [PubMed] [Google Scholar]
Associated Data
This section collects any data citations, data availability statements, or supplementary materials included in this article.
Supplementary Materials
Please note: supplementary material is not edited by the Editorial Office, and is uploaded as it has been supplied by the author.
FIGURE S1 Flow diagram of the study subjects 00288-2019.figureS1 (448.4KB, jpg)