Abstract
Objective:
To evaluate the biological effectiveness of dose associated with interruption time; and propose the dose compensation method based on biological effectiveness when an interruption occurs during photon radiation therapy.
Methods:
The lineal energy distribution for human salivary gland tumor was calculated by Monte Carlo simulation using a photon beam. The biological dose (Dbio) was estimated using the microdosimetric kinetic model. The dose compensating factor with the physical dose for the difference of the Dbio with and without interruption (Δ) was derived. The interruption time (τ) was varied to 0.1, 0.2, 0.3, 0.4, 0.5, 1, 2, 3, 4, 5, 10, 20, 30, 40, 50, 75, and 120 min. The dose per fraction and dose rate varied from 2 to 8 Gy and 0.1 to 24 Gy/min, respectively.
Results:
The maximum Δ with 1 Gy/min occurred when the interruption occurred at half the dose. The Δ with 1 Gy/min at half of the dose was over 3% for τ >= 20 min for 2 Gy, τ = 10 min for 5 Gy, and τ = 10 min for 8 Gy. The maximum difference of the Δ due to the dose rate was within 3% for 2 and 5 Gy, and achieving values of 4.0% for 8 Gy. The dose compensating factor was larger with a high dose per fraction and high-dose rate beams.
Conclusion:
A loss of biological effectiveness occurs due to interruption. Our proposal method could correct for the unexpected decrease of the biological effectiveness caused by interruption time.
Advances in knowledge:
For photon radiotherapy, the interruption causes the sublethal damage repair. The current study proposed the dose compensation method for the decrease of the biological effect by the interruption.
Introduction
Recent technological advancements in radiation therapy, such as immobilization, the use of a linear accelerator, imaging, a treatment planning system, and the ability to compensate for respiratory motion could utilize intensity-modulated radiation therapy (IMRT). IMRT delivers precise radiation doses to a tumor while minimizing the dose to the surrounding normal tissue. However, these techniques are complex and could require more time to deliver the dose than conventional radiation therapy. IMRT uses several beams and segments (apertures) that are shaped using a multileaf collimator. The dose is delivered either statically or dynamically through the step-and-shoot mode. For multibeam radiation therapy, the delivery time will frequently increase proportionally to the complexity of the treatment technique. For lung or liver cancer patients, respiratory control such as respiratory gating or breath-holding techniques is needed to suppress the organ or tumor motion.1,2 Additionally, linac failure causes unscheduled downtime. In some cases, it was necessary to transfer patients to other linacs.3 Consequently, the doses were delivered intermittently. IMRT could require up to 15 min and stereotactic body radiation therapy requires 30 min or longer.4 Unscheduled downtime increases the interruption time. These interruption periods in treatment significantly increase the possibility of error and intrafraction motion. It could be questioned from the therapeutic point of view whether the radiation dose delivered with interruption is equivalent to that administered without interruption.
The effect of the interruption time was studied by Elkind et al who demonstrated that cell killing tends to decrease with increased delivery time. This effect was primarily related to sublethal damage repair (SLDR).5 Mu et al investigated the effect of interruption time through in vitro experiments. The effect of prolonging the fraction time that includes the beam-on time and interruption times in treatment is underestimated by biological models.6
For the estimation of cell survival and the calculation of the biological equivalent dose, the linear–quadratic (LQ) model has been widely used.7,8 However, the LQ model does not represent the effect of the SLDR by the prolonged delivery time and dose rate effect explicitly. The microdosimetric-kinetic (MK) model is possible to evaluate the surviving fraction in terms of microdosimetry.9,10 The MK model expresses the difference in radiation energy by taking into account the spatial distribution of the energy deposition of radiation.11 Moreover, the MK model is possible to evaluate the biological effect of the SLDR. Matsuya et al evaluated the survival curve with the experimental data and the fitted data by the LQ and MK models. The MK model which incorporated the dose rate expressed the SF accurately.12 Inaniwa et al evaluated the effect of longer periods of dose delivery for carbon-ion radiotherapy using the MK model.13 They demonstrated that the biological effect of a planned dose can decrease by 20% or more than the curative dose if the interruption time extends to 30 min or longer. Although our previous study evaluated the effect of delivery time under a continuous photon beam, the effect of the interruption time was not assessed.14 For photon therapy, the decrease in the biological effect associated with the interruption time, i.e. a decrease in cell killing could also occur.
The current study aims to reveal the effect of biological dose difference with and without interruption by a photon beam. Additionally, two types of dose compensation methods to achieve biologically equivalent dose per fraction with interruption are proposed.
Methods and materials
Survival fraction in the MKM
Hawkins et al proposed the MKM, the surviving fraction of cells can be predicted from the dose by a ‘‘domain’’ that the cell nucleus was divided.10 The specific energy which is the dose absorbed by any individual domain is defined as z. The average of z for the entire population is defined as D which is the macroscopically measured dose. It is assumed that the primary lesions in the domain have two types. Type I is a potentially lethal lesion, which is assumed to correspond to a clustered DNA damage that induces chromosome aberrations and it is difficult to repair. A Type II lesion occurred after the irradiation of the domains. According to their transformations, the Type II lesions are classified into four categories: (1) be converted to a lethal unrepairable lesion at a constant rate a through first-order process; (2) form a lethal unrepairable lesion through second-order process bd by combining with another Type II lesion in the same domain; (3) be repaired at constant rate c through first-order process; and (4) persist for a length of time tr, after which it becomes lethal and unrepairable. Type I and Type II lesions are created with a proportional to the z with the kdI and λd, respectively. These are expressed as following equations:
| (1) |
| (2) |
where and are the mean number of Type I and type lesions per domain at z. Brenner et al assumed that the potentially lethal lesion repair rate, which was defined as (a + c), was equivalent to the primary rate λ which was obtained by the DNA repair half-time T1/2.15
a + c (3)
When a population of cells exposed to D at time t = 0 and a domain absorbs z from this irradiation, Eq. (1) becomes
| (4) |
Inaniwa et al showed that the that is the time derivative of z is given stochastically.16 The average of at t taken over all domains of the irradiated cell population including all values of z, , is estimated stochastically, and the probability of having no lethal lesion in the domain over the population that the survival fraction is then determined by
= (5)
Consider a population of cells exposed to macroscopic dose D at time t = 0 and a domain within the population absorbs z. Kase et al derived the survival fraction of cells after the irradiation.17
| (6) |
The denotes the dose mean specific energy by single energy deposition events. The is the proportional factor to [Gy−1] and is the proportionality factor to D2 [Gy−2], which are obtained by the survival fraction in the LQ model. Additionally, Kase et al converted the to the following equation to measure.17
| (7) |
where , dose mean energy (keV/µm), is given by
| (8) |
| (9) |
where y is the lineal energy, l is the mean chord length expressed as two-thirds times the domain diameter, ε is the energy deposited in a domain. The values of rd and ρ, which are the radius and domain and the density of the domain are 0.23 µm and 1.0 g/cm3, respectively. The domain size was assumed to be composed of spherical sites with diameters from 1 nm to 1 µm. An analytical function was developed based on this result. Okamoto et al obtained the domain size from the slope of the linear function, which was used in the current study.18 The f(y) is the probability density of lineal energy. The lineal energy is a stochastic quantity. When particles interact, they can release different quantities of energy which generate a broad spectrum of the lineal energy with different probabilities. The value of the distribution function, F(y), is the probability that the lineal energy is equal to or less than y. The probability density f(y) is the derivative of F(y) with respect to y.
| (10) |
The linear energy distribution, f(y), is independent of the absorbed dose or dose rate. The dose distribution, d(y), can be determined from the above distribution and is the normalized distribution of the product yf(y) which represents the relative contribution of events with magnitude y to the dose. Let D(y) be the fraction of absorbed dose delivered with lineal energy less than or equal to y, then the dose probability density, d(y), is the derivative of D(y) with respect to y
| (11) |
Lineal energy distribution in PHITS
TrueBeam linear accelerators (Varian Medical Systems, Palo Alto, CA) with a 6 MV X-ray beam was modeled in the Particle and Heavy Ion Transport Code System (PHITS). Phase space files located above the secondary jaw for Monte Carlo users were provided by Varian.19 The below phase-space files were created using BEAMnrc, which is built on the EGSnrc platform.20 These phase-space files created by BEAMnrc were transferred to the PHITS system, which performed dose calculation. The virtual homogeneous phantom (20 × 20 × 20 cm3) was created; the beam was used for a 5 × 5 cm2 field size at SSD = 90 cm using PHITS. For the physical dose calculation, the calculation grid size used was 2 mm. The photon and electron cut-off energies were set to 0.01 and 0.7 MeV, respectively. The number of photon histories was 2.0 × 10⁸ in BEAMnrc and 4.0 × 10⁹ in PHITS, respectively. The validation of the Monte Carlo calculations was performed in our previous study, where we compared simulation and measurement results.21 The Monte Carlo calculation and the corresponding measurement in the chamber matched within 1.0%. Using the T-SED function of PHITS, the y distribution with a 6 MV X-ray beam was calculated.22
Biological dose with MKM for interruption
For continuous irradiation without interruption, Inaniwa et al derived the survival fraction of cells after the irradiation.13
| (12) |
| (13) |
where T is the delivery time during irradiation, which is calculated with the dose rate DR as follows:
| (14) |
The current study simulated the lineal energy distribution and calculate the with PHITS. Thus, Eq. (6) is converted with Eq. (7) as follows:
| (15) |
The survival fraction with interruption is calculated stochastically following steps similar to those described by Inaniwa et al.16 It was calculated as:
| (16) |
where S is the survival fraction that is dependent on the dose. The number of the interruptions is 1. Conventionally, radiotherapy has performed with a total dose of 60–70 Gy in 2 Gy/fr.23 The hypofraction radiotherapy scheme is also used in clinical.24,25 On the other hand, a recent study showed that in addition to the direct cell death, indirect cell death through vascular damage occurs when tumors are exposed to high dose hypofractionated irradiation.26 From these clinical protocols, the current study used the dose per fraction (D) of 2–8 Gy. The D is calculated as:
| (17) |
The and are the physical dose at first and second irradiations. The and in the D are separated using the interrupted dose fraction (IDF), which is defined as:
| (18) |
The IDF was changed from 10%, 30%, 50%, 70%, and 90%.
The and are dose mean specific energies absorbed by a domain in a single event during the first and second irradiations, respectively. The current study used the photon beam which energy loss due to the depth is small. Moreover, the current study simulated the virtual phantom and a single field is used. Thus, the , and are used the same value. Moreover, the survival fraction can be converted with Eq. (9) as follows:
| (19) |
The coefficients , , and are provided by:
| (20) |
| (21) |
| (22) |
where, the and are delivery time at first and second irradiations, which are calculated with the dose rate DR as follows:
| (23) |
| (24) |
In total body irradiation, the dose rate is a factor that influences biological effects, and it is accepted practice to keep the dose rate between 0.05 and 0.10 Gy/min.27 For a flattening filter (FF)-free beam, the dose rates of up to 24 Gy/min could be used.28 From above, the DR ranged from 0.1 to 24 Gy/min. These equations were defined under the condition of Here, the with HSG tumor is used 2.28 h, which is referenced from a previous study.16 The was defined as the interruption time. The range of the τ was assumed the clinical treatment. Kuterdem et al reported the delivery time and beam-on time of the dynamic multi leaf collimation in IMRT and it was an average beam pause duration in dynamic of 7 sec.29 For volumetric modulated arc therapy (VMAT) treatments, mechanical motion time was assumed to be 30 s, accounting for the collimator rotation between gantry arcs.30 Moreover, an interruption could occur from unscheduled downtime with machine failures. Although the interruption might occur over 120 min, the lesion becomes the lethal and unrepairable after the . Thus, the current study assumed that the maximum interruption time is used 120 min which is below the . From above, the interruption time (τ) was varied to 0.1, 0.2, 0.3, 0.4, 0.5, 1, 2, 3, 4, 5, 10, 20, 30, 40, 50, 75, and 120 min.
The biological dose (Dbio) proposed by Inaniwa et al11 was computed as:
| (25) |
Using Eq. 15, Dbio with and without interruption can be converted as follows:
| (26) |
| (27) |
where and are the biological doses without and with interruption, respectively. Table 1 shows the cell parameters of the human salivary gland (HSG) tumor cells which referenced from a previous study and the calculated yD values for the 6 MV X-ray beam, which was the dose-mean lineal energy.18 The HSG tumor cell is a standard reference cell line to compare RBE mutually for proton facilities in Korea, Japan, etc.31 At cell culture, eagle’s minimum essential medium (M4655, Sigma) supplemented with 10% fetal bovine serum and antibiotics (100 U ml−1 penicillin and 100 µg ml−1 streptomycin) was used. Harvested cells were seeded in T25 flasks at about 2.0 × 10⁵ cells/flask with 5 ml of the medium, and incubated in a 5% CO2 incubator at 37°C for 2 days prior to irradiation with 6 MV X-ray photon beam. The depths from the phantom surface to cells was 100 mm water equivalent depth. Okamoto et al counted colonies consisting of more than 50 cells as the number of viable cells. The calculated yD value was agreed with the measurement value in a previous study.18
Table 1.
Calculation parameters [parameters (mean and SD]
| Parameters | Mean | SD |
|---|---|---|
| α0 (Gy -1) | 0.175 | 0.023 |
| β0 (Gy -2) | 0.033 | - |
| T1/2 (min) | 22 | - |
| yD (keV/µm) | 2.32 | 0.04 |
SD, standard deviation.
The α0 is the proportional factor to D[Gy−1], β0 is the proportionality factorto D2 [Gy−2], yD is the dose-mean lineal energy,and T1/2 is the DNA repairhalf-time.
Biological dose difference for interruption
From a previous study, the Dbio for interruption was underestimated when compared with the Dbio without interruption.16 Our study assumed that the underestimated Dbio should be supplied in addition to the prescribed dose when the interruption occurred. Thus, the biological dose difference (Δ) was estimated according to the following definition: the deviation of the Dbio without interruption, and that with interruption, divided by the Dbio with interruption.
| (28) |
Dose compensating factor for the biological dose with interruption
The biological dose with an interruption can be corrected with the ∆ and the biological dose without interruption, as follows;
| (29) |
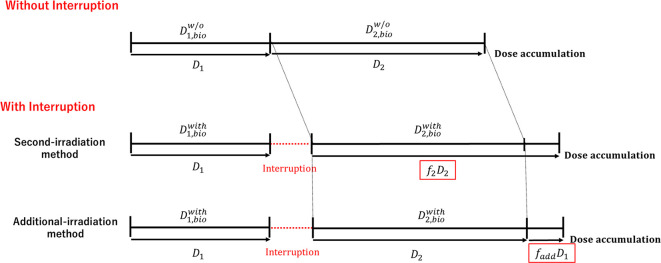
where, the and are the biological dose with interruption at first and second irradiation, respectively. In the photon therapy treatment, the prescription has been performed with the physical dose. Thus, the ∆ should be corrected with the physical dose and the compensating factor (f). The current study suggests the two types of dose compensating methods based on the biological dose difference with and without interruption, as shown in Figure 1. One is that the second-irradiation method in which the compensating is performed for D2 after the first irradiation. The other is the additional dose method which the additional dose with the corrected the D1 immediately after the first and second irradiation is provided.
Figure 1.
Two types of dose compensating methods: One is second-irradiation method that the decrease of the biological effectiveness with interruption is corrected with the D2 in the second irradiation. The other is the additional-irradiation method that the decrease of the biological effectiveness with interruption is compensated with the additional dose.
Dose compensating factor in the second-irradiation method
It was assumed that the biological dose without interruption was equivalent to be the sum of the biological dose at first irradiation with interruption and the biological compensated dose () for second irradiation with interruption.
| (30) |
From the Eqs. (29) and (30), the is derived as:
| (31) |
The can be converted to the physical dose () with Eq. (26), which is given by:
| (32) |
The dose compensating factor based on biological effectiveness at second irradiation with interruption (f2) is derived as:
| (33) |
Dose compensating factor for the additional dose method
It was assumed that the additional dose with the corrected the D1 () was provided immediately after the first and second irradiation to be equivalent to the biological dose without interruption. It can be expressed with Eq. (29).
| (34) |
The can be converted to the physical dose () with Eq. (26), which is given by:
| (35) |
The dose compensating factor based on biological effectiveness at additional-irradiation with interruption (fadd) is derived as:
| (37) |
Results
Survival fraction with a different fraction of the interrupted dose
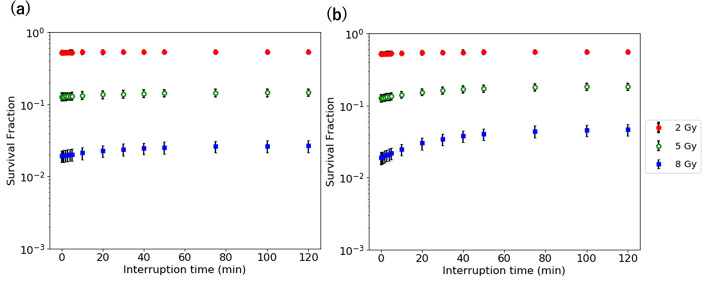
Figure 2 shows the survival fraction as a function of interruption time at the IDF of 10 and 50% with 1 Gy/min for the D of 2–8 Gy. The survival fraction increases with an increase in the interruption time. The survival fraction at the IDF of 50% is larger than that 10%. The difference of the survival fraction at the IDF of 10 and 50% for 8 Gy is larger.
Figure 2.
Survival fraction vs interruption time at the IDF of (a) 10% and (b) 50% for the D of 2–8 Gy. IDF, interrupted dosefraction.
Biological dose difference with different fraction of the interrupted dose
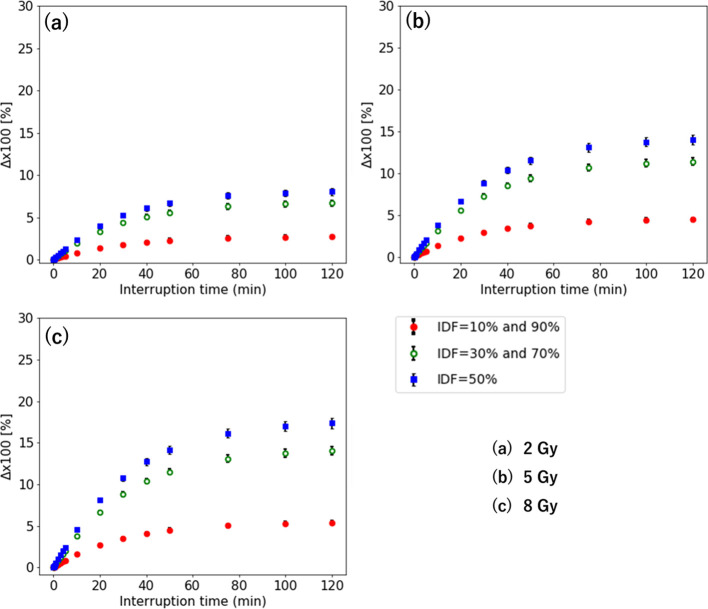
Figure 3 shows the Δ as a function of interruption time with 1 Gy/min for the D of 2–8 Gy. For the IDF of 10–90%, the maximum occurs when the interruption is at an IDF of 50%. The Δ at the IDF of 10 and 30% are identical to that at the IDF of 90 and 70%, respectively. The smallest Δ value occurs when the interruption is at the IDF of 10 and 90%. The maximum Δ is larger with a higher dose. Its largest value is 17.4% at the IDF of 50% for 8 Gy. The minimum interruption time of the that was over 3% occurs with τ = 20 min for 2 Gy, τ = 10 min for 5 Gy, and τ = 10 min for 8 Gy, respectively. For 2 Gy, the is within 10% with an interruption time of 0–120 min. Moreover, the maximum Δ for 5–8 Gy is larger with a higher dose, which is over 10%.
Figure 3.
Δ when the interruption occurs at the IDF of 10–90% for the D of (a) 2 Gy, (b) 5 Gy, and (c) 8 Gy. IDF, interrupted dosefraction.
Biological dose difference with a different dose rate for interruption
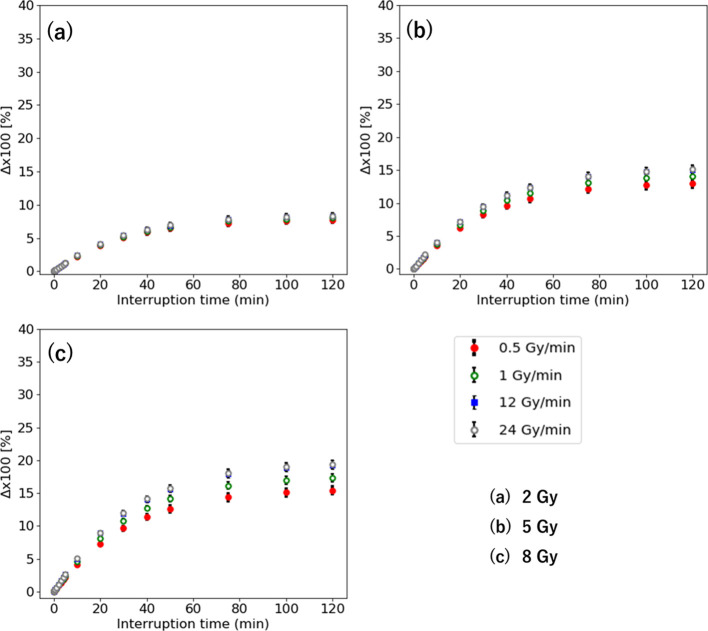
Figure 4 shows the Δ vs interruption time at the IDF of 50% with 0.5–24 Gy/min for the D of 2–8 Gy. The Δ with low-dose rate is smaller. There is a small difference in the with 0.5–24 Gy/min within 3% for 2 and 5 Gy. The maximum difference of the is 4.0% for 8 Gy with τ = 120 for 20 Gy.
Figure 4.
Δ interruption time with 0.5–24 Gy/min for the D of (a) 2 Gy, (b) 5 Gy, and (c) 8 Gy.
Dose compensating factor with different fraction of the interrupted dose
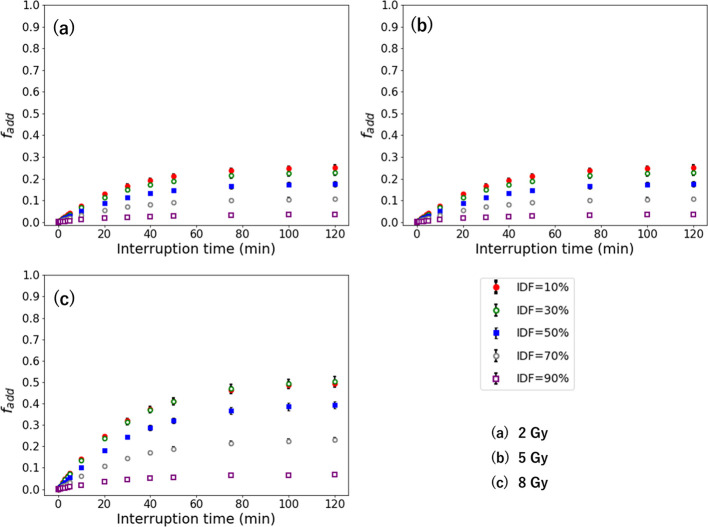
Figures 5 and 6 show the and in the second-irradiation method and additional-irradiation method with 1 Gy/min for the D of 2–8 Gy. The and are larger with a high-dose rate, which indicates a similar result with the Δ. The higher dose has higher and . Its largest values are 1.50 for the at an IDF of 90% and 0.49 for the at an IDF of 10% for 8 Gy. The maximum and are larger with a higher dose per fraction.
Figure 5.
when the interruption occurs at the IDF of 10–90% for the D of (a) 2 Gy, (b) 5 Gy, and (c) 8 Gy. IDF, interrupted dosefraction.
Figure 6.
when the interruption occurs at the IDF of 10–90% for the D of (a) 2 Gy, (b) 5 Gy, and (c) 8 Gy. IDF, interrupted dosefraction.
Dose compensating factor with different dose rate for interruption
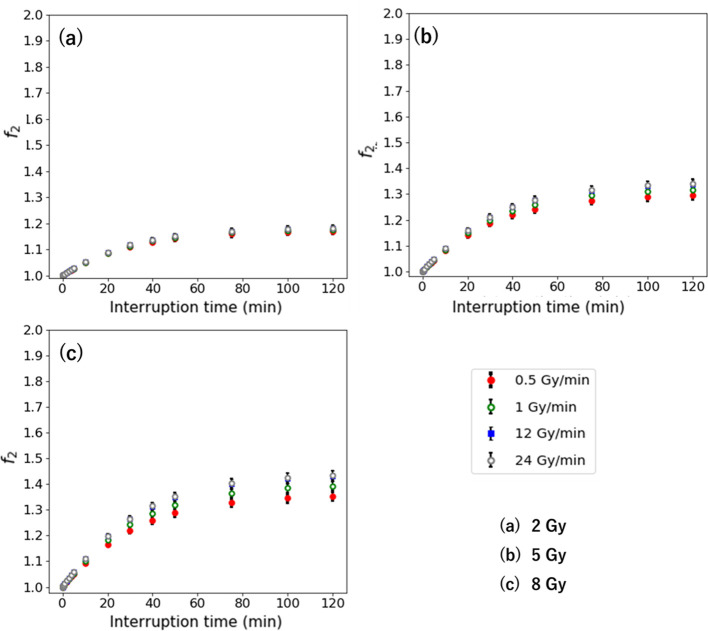
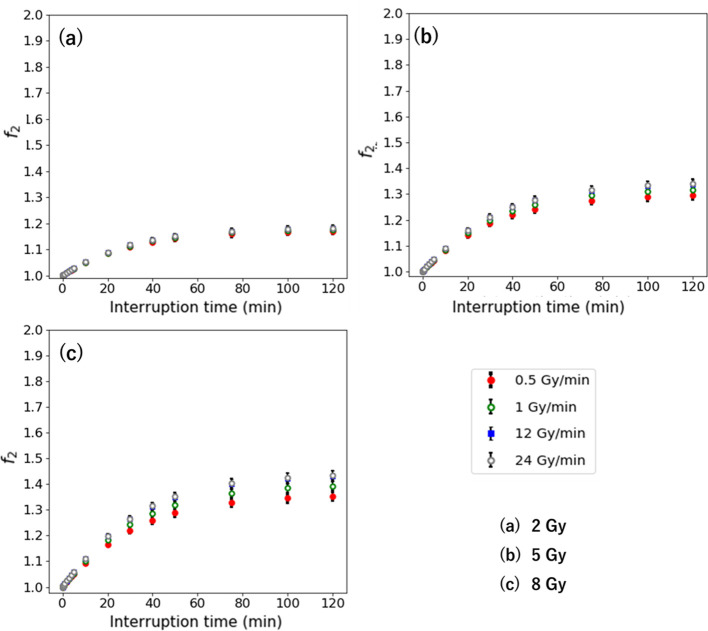
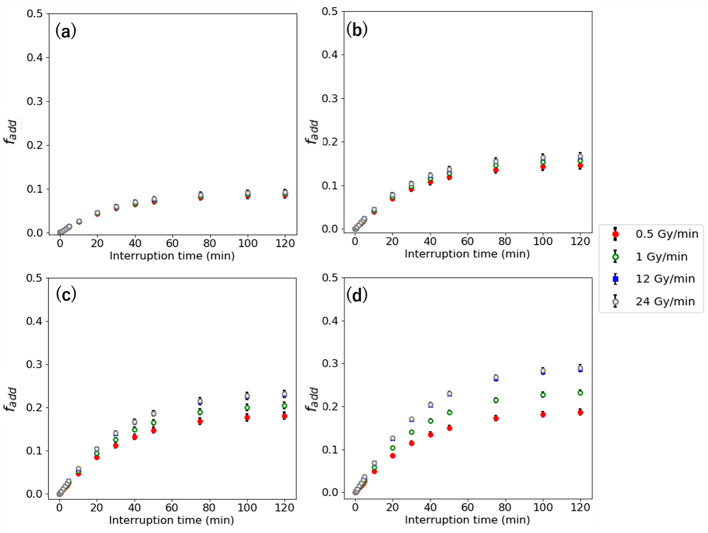
Figures 7 and 8 show the and in second-irradiation method and additional-irradiation method at the IDF of 50% with 0.5–24 Gy/min for the D of 2–8 Gy. The and are larger with high-dose rate, which indicates a similar result with the Δ . The higher D has higher and . Its largest values are 1.43 for the and 0.43 for the at 8 Gy with 24 Gy/min.
Figure 7.
interruption time with 0.5–24 Gy/min for the D of (a) 2 Gy, (b) 5 Gy, and (c) 8 Gy.
Figure 8.
interruption time with 0.5–24 Gy/min for the D of (a) 2 Gy, (b) 5Gy, and (c) 8 Gy.
Discussion
The present study reveals that the biological effect of SLDR due to interruption time during photon radiotherapy was significant. The unexpected decrease of the biological effectiveness, which was compensated with the physical dose that was defined as the dose that should be added after the interruption. A previous study revealed that the SLDR occurred between interruption times of 2–3 min, or longer.32 The current study showed that the biological dose difference with and without interruption was over 3% at the interruption, that is longer than 3 min for all of the D. Benedict et al estimated the biological effectiveness with an interruption for stereotactic radiosurgery in vitro.33 They reported that the effect of radiation decreased by 9–14% at 8 Gy when the treatment time elongates by 30 min. In the current study, a similar decrease in the biological effectiveness occurred. Additionally, the current study showed that the biological dose difference depends on the dose per fraction, dose rate, and the dose before and after interruption.
The interruption time of the biological dose difference with and without interruption at over 3% was 10 min with 8 Gy with 1 Gy/min. For radiation therapy techniques, a previous study reported the dose delivery time for bladder cancer with 2 Gy of dose per fraction, which was 2.25 min with three-dimensional radiotherapy (3DCRT), 4.29 min with IMRT, and 1.14 min with VMAT.34 Thus, the difference of the biological dose with and without interruption was within 3% with 2 Gy for all of the radiotherapy techniques. Ong et al reported that the dose delivery time was 11.6 min for 3DCRT, 12 min for IMRT, and 3.9 min for VMAT for hypofraction radiotherapy.35 Although the delivery time includes the beam-on time and interruption time, the difference of the biological dose with and without interruption for VMAT is within 3% even if the delivery time is almost composed of the interruption time. On the other hand, the biological dose difference with and without interruption is possible to be over 3% for 3DCRT and IMRT in hypofraction radiotherapy. Moreover, the interruption could occur once if there are issues with the machine, hardware, and patient in clinical practice. For the decrease of the biological effectiveness with the interruption by complexity irradiation method or machine failures, the current study proposed the dose compensation model of the second-irradiation method and additional-irradiation method. Recently, the treatment technique has been advanced and multiple-direction beam with non-uniform beamlets at each segment or doses at each voxel is used in clinical.36 Second-irradiation method was assumed that the dose profile at first irradiation is the same with second irradiation. Thus, it may be difficult to apply the second irradiation method. On the other hand, to apply the additional-irradiation method in clinical, the prompt irradiation that minimized the treatment interruptions after second irradiation.
Recently, FF-free beams have been able to provide improved clinical throughput since they exhibit a high dose rate compared with the FF beams. Turner et al demonstrated that the greater impact of higher dose rates has been confirmed in a study report concerning irradiated mice.37 Although increasing interruption time caused an increase in the delivery time, the effect of the dose rate for the difference of the biological dose with and without interruption was larger with a high dose per fraction. Therefore, the dose compensating model requires adjustment according to the dose rate.
There were limitations in our dose compensating model. Mu et al reported that the prolonged fraction delivery time within the time frame for complex radiotherapy techniques, such as IMRT and hypofraction radiotherapy, can decrease the biological effectiveness.38 The biological effect by the accumulation of the small dose with the interruption could be insignificant. Our study could not evaluate the for certain interruptions; this demands further evaluation and research. Additionally, our simulation was performed with only an HSG tumor cell; thus, it is necessary for the should be evaluated with other tumor or normal cells. The current study incorporated the SLDR. The range of the interruption time is within the tr in which the biological effect of SLDR occurs. The other repair such as potentially lethal damage repair is not considered in the current study. Moreover, Carlson et al investigated the correlation of the cell kill and regions of hypoxia for conventional fractionation and hypofraction radiotherapy.37 The other factors of the biological effects, such as tumor hypoxia and tumor repopulation, are beyond the scope of this study. Although the current study evaluated the biological effectiveness due to the SLDR by the interruption in a simulation study, portions of it are in agreement with previous experimental studies. For clinical purposes, the biological effectiveness due to interruption is difficult because existing treatment planning systems could not perform the biological dose calculation using MKM. Our proposed model with physical dose can be compensated for the biological dose difference without biological dose calculating if the decrease of the biological effect occurs due to interruption. Although the current study focused on the point prescription method, IMRT uses volume prescription that the dose was accumulated at each of voxels.39 To apply the biological dose compensation model in volume prescription, a further study which assesses the compensating factor at each of voxel in the voxel is needed.
Conclusions
The interruption caused the loss of biological effect. The dose compensation model could correct an unexpected decrease of the biological effectiveness with interruption time.
Contributor Information
Daisuke Kawahara, Email: daika99@hiroshima-u.ac.jp.
Hisashi Nakano, Email: daika999@hiroshima-u.ac.jp.
Shuichi Ozawa, Email: daika99999@hiroshima-u.ac.jp.
Yasushi Nagata, Email: daika999999@hiroshima-u.ac.jp.
REFERENCES
- 1. Hoogeman MS, Nuyttens JJ, Levendag PC, Heijmen BJM. Time dependence of intrafraction patient motion assessed by repeat stereoscopic imaging. Int J Radiat Oncol Biol Phys 2008; 70: 609–18. doi: 10.1016/j.ijrobp.2007.08.066 [DOI] [PubMed] [Google Scholar]
- 2. Linthout N, Bral S, Van de Vondel I, Verellen D, Tournel K, Gevaert T, et al. Treatment delivery time optimization of respiratory gated radiation therapy by application of audio-visual feedback. Radiother Oncol 2009; 91: 330–5. doi: 10.1016/j.radonc.2009.03.019 [DOI] [PubMed] [Google Scholar]
- 3. Vladimir D, Ivana H. Evaluation of downtime of linear accelerators Installed at radiotherapy departments in the Czech Republic. World Congress on Medical Physics and Biomedical Engineering 2018;: 351–4. [Google Scholar]
- 4. Physical considerations in the use of intensity modulated radiotherapy to produce three-dimensional conformal dose distributions. J Jpn Soc Ther Radiol Oncol 2000; 12: 191–203. [Google Scholar]
- 5. Elkind MM, Sutton H. Radiation response of mammalian cells grown in culture. 1. repair of X-ray damage in surviving Chinese hamster cells. Radiat Res 1960; 13: 556–93. doi: 10.2307/3570945 [DOI] [PubMed] [Google Scholar]
- 6. Mu X, Löfroth P-O, Karlsson M, Zackrisson B. The effect of fraction time in intensity modulated radiotherapy: theoretical and experimental evaluation of an optimisation problem. Radiother Oncol 2003; 68: 181–7. doi: 10.1016/S0167-8140(03)00165-8 [DOI] [PubMed] [Google Scholar]
- 7. Curtis SB. Lethal and potentially lethal lesions induced by radiation--a unified repair model. Radiat Res 1986; 106: 252–70. doi: 10.2307/3576798 [DOI] [PubMed] [Google Scholar]
- 8. Tobias CA. The repair-misrepair model in radiobiology: comparison to other models. Radiat Res Suppl 1985; 8: S77–95. doi: 10.2307/3583515 [DOI] [PubMed] [Google Scholar]
- 9. Hawkins RB. A statistical theory of cell killing by radiation of varying linear energy transfer. Radiat Res 1994; 140: 366–74. doi: 10.2307/3579114 [DOI] [PubMed] [Google Scholar]
- 10. Hawkins RB. A microdosimetric-kinetic model of cell death from exposure to ionizing radiation of any let, with experimental and clinical applications. Int J Radiat Biol 1996; 69: 739–55. doi: 10.1080/095530096145481 [DOI] [PubMed] [Google Scholar]
- 11. Rossi HH, Zaider M, Turner JE. Microdosimetry and its Applications. Berlin: Springer; 1996. [Google Scholar]
- 12. Matsuya Y, Ohtsubo Y, Tsutsumi K, Sasaki K, Yamazaki R, Date H, et al. Quantitative estimation of DNA damage by photon irradiation based on the microdosimetric-kinetic model. J Radiat Res 2014; 55: 484–93. doi: 10.1093/jrr/rrt222 [DOI] [PMC free article] [PubMed] [Google Scholar]
- 13. Inaniwa T, Kanematsu N, Suzuki M, Hawkins RB. Effects of beam interruption time on tumor control probability in single-fractionated carbon-ion radiotherapy for non-small cell lung cancer. Phys Med Biol 2015; 60: 4105–21. doi: 10.1088/0031-9155/60/10/4105 [DOI] [PubMed] [Google Scholar]
- 14. Nakano H, Kawahara D, Ono K, Akagi Y, Hirokawa Y. Effect of dose-delivery time for flattened and flattening filter-free photon beams based on microdosimetric kinetic model. PLoS One 2018; 13: e0206673. doi: 10.1371/journal.pone.0206673 [DOI] [PMC free article] [PubMed] [Google Scholar]
- 15. Brenner DJ, Hlatky LR, Hahnfeldt PJ, Huang Y, Sachs RK. The linear-quadratic model and most other common radiobiological models result in similar predictions of Time-dose relationships. Radiat Res 1998; 150: 83–91. doi: 10.2307/3579648 [DOI] [PubMed] [Google Scholar]
- 16. Inaniwa T, Suzuki M, Furukawa T, Kase Y, Kanematsu N, Shirai T, et al. Effects of dose-delivery time structure on biological effectiveness for therapeutic carbon-ion beams evaluated with microdosimetric kinetic model. Radiat Res 2013; 180: 44–59. doi: 10.1667/RR3178.1 [DOI] [PubMed] [Google Scholar]
- 17. Kase Y, Kanai T, Matsumoto Y, Furusawa Y, Okamoto H, Asaba T, et al. Microdosimetric measurements and estimation of human cell survival for heavy-ion beams. Radiat Res 2006; 166: 629–38. doi: 10.1667/RR0536.1 [DOI] [PubMed] [Google Scholar]
- 18. Okamoto H, Kanai T, Kase Y, Matsumoto Y, Furusawa Y, Fujita Y, et al. Relation between lineal energy distribution and relative biological effectiveness for photon beams according to the microdosimetric kinetic model. J Radiat Res 2011; 52: 75–81. doi: 10.1269/jrr.10073 [DOI] [PubMed] [Google Scholar]
- 19. Constantin M, Perl J, LoSasso T, Salop A, Whittum D, Narula A, et al. Modeling the truebeam linac using a CAD to Geant4 geometry implementation: dose and IAEA-compliant phase space calculations. Med Phys 2011; 38: 4018–24. doi: 10.1118/1.3598439 [DOI] [PubMed] [Google Scholar]
- 20. Rogers DW, Walters B, Kawrakow I, manual Busers. National Research Council of Canada Report PIRS-0509(A) revL. Ottawa, Canada: NRCC; 2016. [Google Scholar]
- 21. Kawahara D, Nakano H, Ozawa S, Saito A, Kimura T, Suzuki T, et al. Relative biological effectiveness study of lipiodol based on microdosimetric-kinetic model. Phys Med 2018; 46: 89–95. doi: 10.1016/j.ejmp.2018.01.018 [DOI] [PubMed] [Google Scholar]
- 22. Sato T, Watanabe R, Niita K. Development of a calculation method for estimating specific energy distribution in complex radiation fields. Radiat Prot Dosimetry 2006; 122(1-4): 41–5. doi: 10.1093/rpd/ncl407 [DOI] [PubMed] [Google Scholar]
- 23. Ma L, Men Y, Feng L, Kang J, Sun X, Yuan M, et al. A current review of dose-escalated radiotherapy in locally advanced non-small cell lung cancer. Radiol Oncol 2019; 53: 6–14. doi: 10.2478/raon-2019-0006 [DOI] [PMC free article] [PubMed] [Google Scholar]
- 24. Shen G, Wang Y-J, Shen W-J, Zhou Z-S, Wang J-L, Sheng H-G, et al. Stereotactic body radiation therapy for centrally-located lung tumors. Oncol Lett 2014; 7: 1292–6. doi: 10.3892/ol.2014.1815 [DOI] [PMC free article] [PubMed] [Google Scholar]
- 25. Uematsu M, Shioda A, Suda A, Fukui T, Ozeki Y, Hama Y, et al. Computed tomography-guided frameless stereotactic radiotherapy for stage I non-small cell lung cancer: a 5-year experience. Int J Radiat Oncol Biol Phys 2001; 51: 666–70. doi: 10.1016/S0360-3016(01)01703-5 [DOI] [PubMed] [Google Scholar]
- 26. Kocher M, Treuer H, Voges J, Hoevels M, Sturm V, Müller RP, et al. Computer simulation of cytotoxic and vascular effects of radiosurgery in solid and necrotic brain metastases. Radiother Oncol 2000; 54: 149–56. doi: 10.1016/S0167-8140(99)00168-1 [DOI] [PubMed] [Google Scholar]
- 27. Ravichandran R, Binukumar JP, Davis CA, Al Rahbi Z, Balakrishnan R, Al Mandhari Z, et al. Total body irradiation (TBI): preliminary experience on clinical implementation. J Med Phys 2013; 38: 210–1 1. doi: 10.4103/0971-6203.121200 [DOI] [PMC free article] [PubMed] [Google Scholar]
- 28. Dubois L, Biemans R, Reniers B, Bosmans G, Trani D, Podesta M, et al. High dose rate and flattening filter free irradiation can be safely implemented in clinical practice. Int J Radiat Biol 2015; 91: 778–85 1. doi: 10.3109/09553002.2015.1068457 [DOI] [PubMed] [Google Scholar]
- 29. Kuterdem H, Cho PS, Marks P, et al. Comparison of leaf sequencing techniques: dynamic vs multiple static segments.. Wide Area Networking for Radiotherapy Services: 213–5. [Google Scholar]
- 30. McCarroll R, Youssef B, Beadle B, Bojador M, Cardan R, Famiglietti R, et al. Model for estimating power and downtime effects on teletherapy units in low-resource settings. J Glob Oncol 2017; 3: 563–71. doi: 10.1200/JGO.2016.005306 [DOI] [PMC free article] [PubMed] [Google Scholar]
- 31. Ando K, Furusawa Y, Suzuki M, Nojima K, Majima H, Koike S, et al. Relative biological effectiveness of the 235 MeV proton beams at the National cancer center Hospital East. J Radiat Res 2001; 42: 79–89. doi: 10.1269/jrr.42.79 [DOI] [PubMed] [Google Scholar]
- 32. Shibamoto Y, Ito M, Sugie C, Ogino H, Hara M. Recovery from sublethal damage during intermittent exposures in cultured tumor cells: implications for dose modification in radiosurgery and IMRT. Int J Radiat Oncol Biol Phys 2004; 59: 1484–90. doi: 10.1016/j.ijrobp.2004.04.039 [DOI] [PubMed] [Google Scholar]
- 33. Benedict SH, Lin PS, Zwicker RD, Huang DT, Schmidt-Ullrich RK. The biological effectiveness of intermittent irradiation as a function of overall treatment time: development of correction factors for linac-based stereotactic radiotherapy. Int J Radiat Oncol Biol Phys 1997; 37: 765–9. doi: 10.1016/S0360-3016(97)00023-0 [DOI] [PubMed] [Google Scholar]
- 34. Foroudi F, Wilson L, Bressel M, Haworth A, Hornby C, Pham D, et al. A dosimetric comparison of 3D conformal vs intensity modulated vs volumetric Arc radiation therapy for muscle invasive bladder cancer. Radiat Oncol 2012; 7: 111. doi: 10.1186/1748-717X-7-111 [DOI] [PMC free article] [PubMed] [Google Scholar]
- 35. Ong CL, Verbakel WFAR, Cuijpers JP, Slotman BJ, Lagerwaard FJ, Senan S, et al. Stereotactic radiotherapy for peripheral lung tumors: a comparison of volumetric modulated Arc therapy with 3 other delivery techniques. Radiother Oncol 2010; 97: 437–42. doi: 10.1016/j.radonc.2010.09.027 [DOI] [PubMed] [Google Scholar]
- 36. Kim T, Zhu L, Suh T-S, Geneser S, Meng B, Xing L, et al. Inverse planning for IMRT with nonuniform beam profiles using total-variation regularization (TVR. Med Phys 2011; 38: 57–66. doi: 10.1118/1.3521465 [DOI] [PMC free article] [PubMed] [Google Scholar]
- 37. Carlson DJ, Keall PJ, Loo BW, Chen ZJ, Brown JM. Hypofractionation results in reduced tumor cell kill compared to conventional fractionation for tumors with regions of hypoxia. Int J Radiat Oncol Biol Phys 2011; 79: 1188–95. doi: 10.1016/j.ijrobp.2010.10.007 [DOI] [PMC free article] [PubMed] [Google Scholar]
- 38. Turner HC, Shuryak I, Taveras M, Bertucci A, Perrier JR, Chen C, et al. Effect of dose rate on residual γ-H2AX levels and frequency of micronuclei in x-irradiated mouse lymphocytes. Radiat Res 2015; 183: 315–24. doi: 10.1667/RR13860.1 [DOI] [PMC free article] [PubMed] [Google Scholar]
- 39. Kukołowicz PF, Mijnheer BJ. Comparison between dose values specified at the ICRU reference point and the mean dose to the planning target volume. Radiother Oncol 1997; 42: 271–7. doi: 10.1016/S0167-8140(97)01905-1 [DOI] [PubMed] [Google Scholar]


