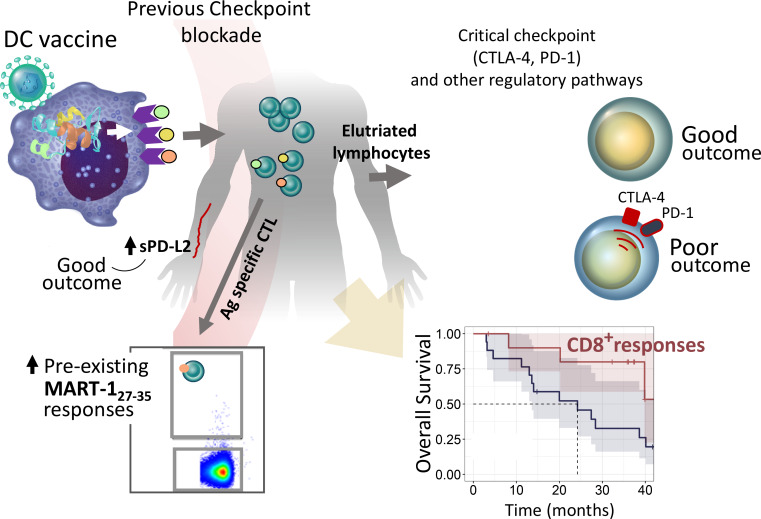
Santos et al. analyze cancer patient vaccine antigen-specific T cells for the importance of immune checkpoint molecule and gene pathway expression. CTLA-4 and PD-1 pathways are significantly correlated to T cell response and clinical outcomes, and sequence of pathway blockade is critical.
Abstract
Immune and molecular profiling of CD8 T cells of patients receiving DC vaccines expressing three full-length melanoma antigens (MAs) was performed. Antigen expression levels in DCs had no significant impact on T cell or clinical responses. Patients who received checkpoint blockade before DC vaccination had higher baseline MA-specific CD8 T cell responses but no evidence for improved functional responses to the vaccine. Patients who showed the best clinical responses had low PD-1 expression on MA-specific T cells before and after DC vaccination; however, blockade of PD-1 during antigen presentation by DC had minimal functional impact on PD-1high MA-specific T cells. Gene and protein expression analyses in lymphocytes and tumor samples identified critical immunoregulatory pathways, including CTLA-4 and PD-1. High immune checkpoint gene expression networks correlated with inferior clinical outcomes. Soluble serum PD-L2 showed suggestive positive association with improved outcome. These findings show that checkpoint molecular pathways are critical for vaccine outcomes and suggest specific sequencing of vaccine combinations.
Graphical Abstract
Introduction
Melanoma represents <1% of skin cancers but is the most lethal. Over 96,000 new cases of melanoma were expected in 2019, a continued increase in incidence for the past 30 yr (Siegel et al., 2019). Checkpoint blockade therapy using monoclonal antibodies against CTLA-4 or PD-1/PD-L1 has shown durable responses as monotherapy, and as CTLA-4+PD-1 combination blockade, responses are seen in more than half of patients treated (Larkin, et al., 2015). However, there is still a significant proportion of patients who do not respond to checkpoint blockade or acquire resistance to these therapies (Sharma et al., 2017). Therefore, the need to develop and promote effective antitumor immunity and rationally design combination approaches is a critical issue.
The aim of dendritic cell (DC) vaccination is to induce or expand functional and long-lived tumor-specific T cell responses. Numerous studies have shown the safety and immunogenicity of DC vaccines in melanoma and other cancers (Santos and Butterfield, 2018; Gross et al., 2017; van der Burg et al., 2016; Carreno et al., 2015; Palucka and Banchereau, 2013). Despite these findings, objective clinical response rates remain low at <15% (Anguille et al., 2014). Thus, there is a need to optimize vaccine design to improve clinical responses by promoting more effective long-term antitumor immunity and to define where vaccination could be fruitfully combined with complementary approaches such as checkpoint blockade.
In this study, CD8 T cells specific for melanoma antigens (MAs) were analyzed from patients who received autologous DCs engineered to express three full-length MAs (tyrosinase, MART-1, and MAGE-A6; Butterfield et al., 2019). The immunological and clinical impacts of key checkpoint molecule expression by the T cells were examined. Differential expression analyses in circulating lymphocytes and tumor samples, performed using a defined subset of cancer and immune-related gene and protein panels, suggest important molecular pathways for modulation and optimal sequencing of future combination trials with vaccines.
Results
Antigen expression level in the DC vaccines has minimal impact
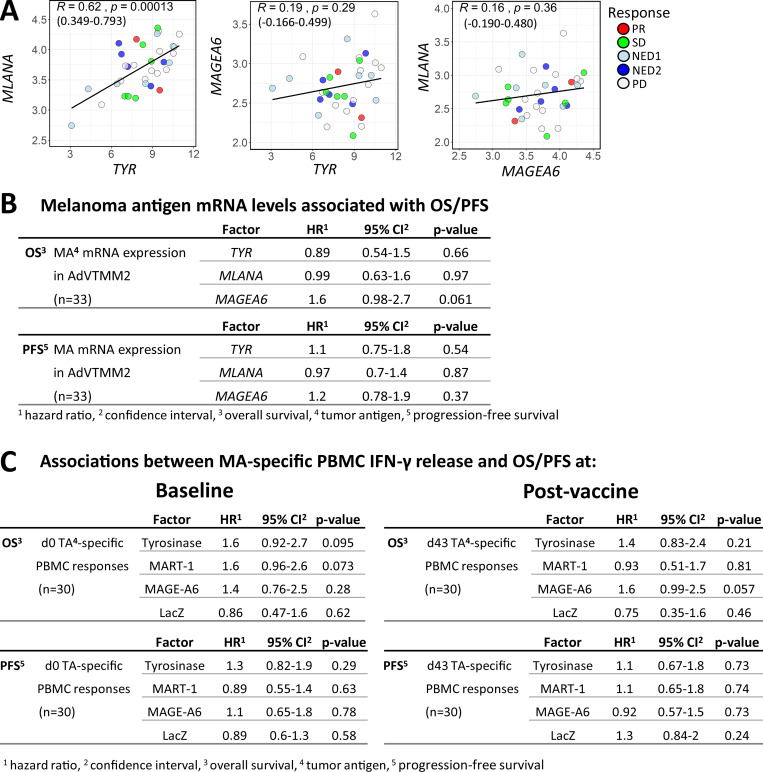
To test the hypothesis that antigen expression levels are important for induction of T cell responses, the vaccines were engineered by a single adenovirus (AdV) to express high levels of tyrosinase, intermediate levels of MART-1, and low levels of MAGE-A6. Tyrosinase and MART-1 mRNAs were driven by the CMV promoter, and their expression was significantly correlated (P = 0.00013). MAGE-A6 mRNA was driven by the Rous sarcoma virus promoter and did not show a statistically significant correlation with the other two antigens (Fig. S1 A). Each patient’s vaccine cells were transduced with differing efficiency; hence, there were individualized levels of each antigen. Cox regression analysis did not reveal significant associations between antigen expression dose in the vaccines and overall survival (OS) or progression-free survival (PFS; Fig. S1 B).
Figure S1.
Associations of MA expression levels in the DC vaccines with survival time and clinical responses. (A) Scatter plots showing correlations between TYR (Tyrosinase) and MLANA (MART-1; in the same expression cassette), TYR and MAGEA6 (MAGE-A6; separate cassettes; equivalence test for R > −0.3 and R < 0.3; P = 0.258) and MLANA and MAGEA6 (separate cassettes; equivalence test for R > −0.3 and R < 0.3; P = 0.215) based on mRNA expression measured in the DC vaccines. Pearson correlation coefficient (R), with P values and 95% confidence intervals indicated. (B) Univariate Cox regression analyses for DC vaccine–MA antigen expression levels and OS and PFS. (C) Univariate Cox regression analysis for associations between MA-specific IFN-γ release (ELISPOT counts) from total PBMCs isolated at baseline (d0) or after vaccine (d43) and OS and PFS.
MA-specific CD8 and CD4 T cell responses
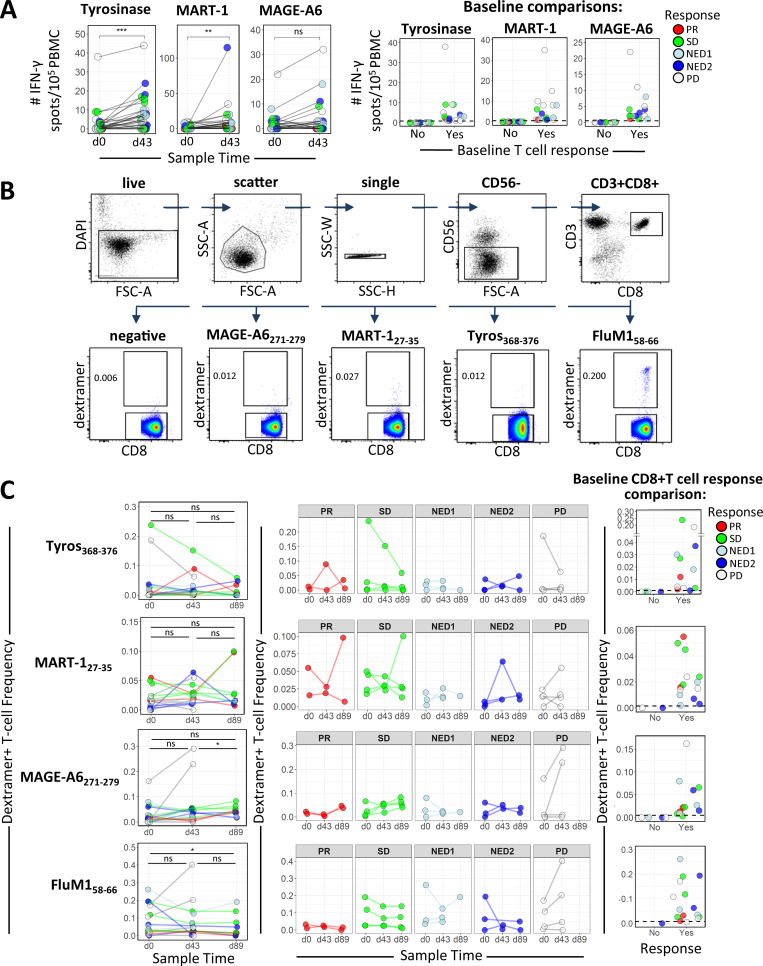
To confirm that the DC vaccines induced and/or activated tumor-specific CTL responses, ex vivo ELISPOT assays from total peripheral blood mononuclear cell (PBMC) cultures demonstrated that 20/31, 19/31, and 14/31 patients showed increases in IFN-γ–producing T cells in response to tyrosinase, MART-1, or MAGE-A6, respectively, indicating successful vaccination (Fig. 1 A, left panel). Furthermore, we show that about half of the patients had preexisting functional T cell responses to MAs before DC vaccination (Fig. 1 A, right panel). There were no significant associations between antigen-specific T cell responses and OS or PFS (Fig. S1 C).
Figure 1.
MA-specific responses before and after DC vaccination. (A) In the left panel, PBMCs from patients before (d0) and after (d43) DC vaccination were tested by ELISPOT assay for IFN-γ–producing T cells with specificities against the indicated MAs encoded in the DC vaccine (n = 31). Changes in influenza (FluM1) peptide-specific T cells are shown for comparison. P values were calculated using the Wilcoxon signed rank test. The right panel shows baseline IFN-γ ELISPOT count distributions separated based on the absence (No) or presence (Yes) of positive responses to individual MA antigens. (B and C) Gating strategy (B) and summary graphs showing the frequency of dextramer-specific CD8 T cells in the peripheral blood of HLA-A2+ patients (C) measured at d0, d43, and d89 as indicated (n = 16). P values for comparisons of frequency distributions between time points were calculated using Wilcoxon signed rank tests. (C) The middle panel shows dextramer-specific CD8 frequencies grouped according to clinical response. Baseline frequency distributions based on the absence (No) or presence (Yes) of positive responses to individual MA antigens are shown in the right panel. Positive responses were detected for 12/16, 12/16, 14/16, and 15/16 patients for Tyros368–376, MART127–35, MAGE-A6271–279, and FluM158–66, respectively. *, P ≤ 0.05; **, P ≤ 0.01; ***, P ≤ 0.001. ns, not significant; Tyros, tyrosinase; FSC-A, forward scatter area; SSC-H, side scatter height; SSC-W, side scatter width; SSC-A, side scatter area.
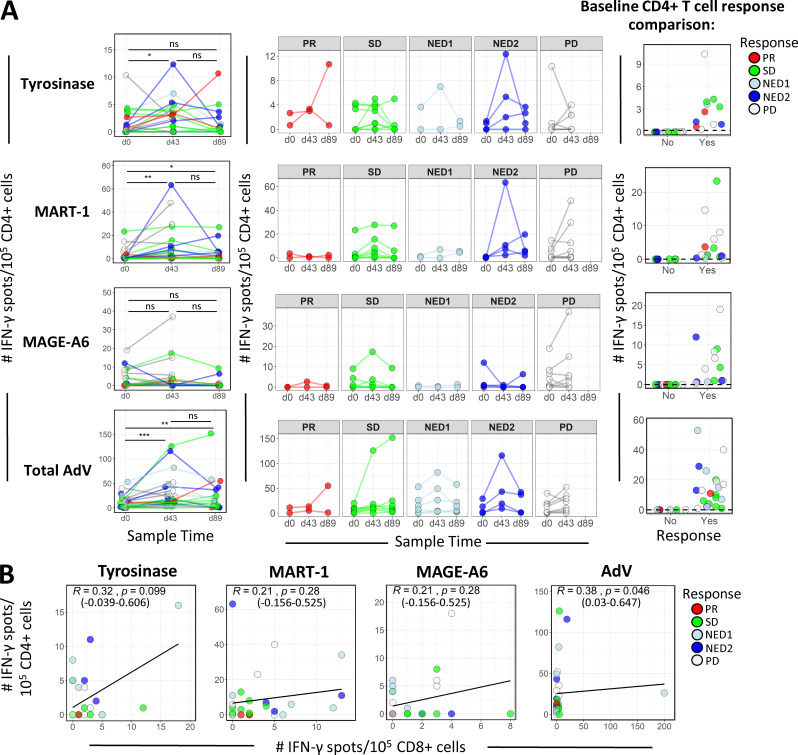
16 patients were HLA-A2+; hence, HLA-A*0201 dextramers were used to identify peptide-specific CD8 T cell responses to Tyros368–376, MAGE-A6271–279, and MART127–35 (Fig. 1 B). As with the trend observed with ELISPOT data, the majority of the 16 patients had dextramer-positive CD8 T cells in the peripheral blood at baseline (Fig. 1 C). As a positive control, nearly all (15/16) patients exhibited baseline reactivity to FluM158–66. Overall, three patients showed increases to three of three peptides, six to two of three peptides, and five to one of three peptides, and two (both progressive disease [PD]) had no frequency increases. Testing CD4 T cells for reactivity to full-length antigens showed a transient increase in postvaccine MA-specific activation of CD4 T cells; MART-1 and AdV-specific responses had the strongest evidence for a difference between baseline and day 43 (d43) measurements (Fig. 2 A). We did not observe any consistent trend in patient CD4 T cell tumor antigen reactivity among the response groups after vaccination. Furthermore, there were no statistically significant correlations between vaccine-induced tumor antigen-specific CD4 and CD8 T cell responses (Fig. 2 B).
Figure 2.
CD4 T cell IFN-γ ELISPOT frequencies and their correlations with CD8 responses. (A) CD4 cells from patients at d0, d43, and d89 were tested by ELISPOT assay for IFN-γ responses specific against the indicated MAs encoded in the DC vaccine (n = 35). P values for comparisons of frequency distributions between time points were calculated using Wilcoxon signed rank tests. The middle panel shows antigen-specific CD4 IFN-γ ELISPOT counts grouped according to clinical response. Baseline frequency distributions based on the absence (No) or presence (Yes) of positive responses to individual MA antigens are shown in the right panel. Positive responses were detected for 11/24, 15/24, 13/24, and 18/24 patients for tyrosinase, MART-1, MAGE-A6, and total AdV, respectively. *, P ≤ 0.05; **, P ≤ 0.01; ***, P ≤ 0.001. (B) Scatter plots showing correlations between CD4 and CD8 after vaccine (d43); IFN-γ ELISPOT counts reactive to full-length antigens: tyrosinase (equivalence test for R > −0.3 and R < 0.3; P = 0.547), MART-1 (equivalence test for R > −0.3 and R < 0 .3; P = 0.305), MAGE-A6 (equivalence test for R > −0.3 and R < 0.3; P = 0.305), and total AdV (equivalence test for R > −0.3 and R < 0.3; P = 0.215). Spearman correlation coefficient (R), P values based on asymptotic t approximation, and 95% confidence intervals are indicated. ns, not significant.
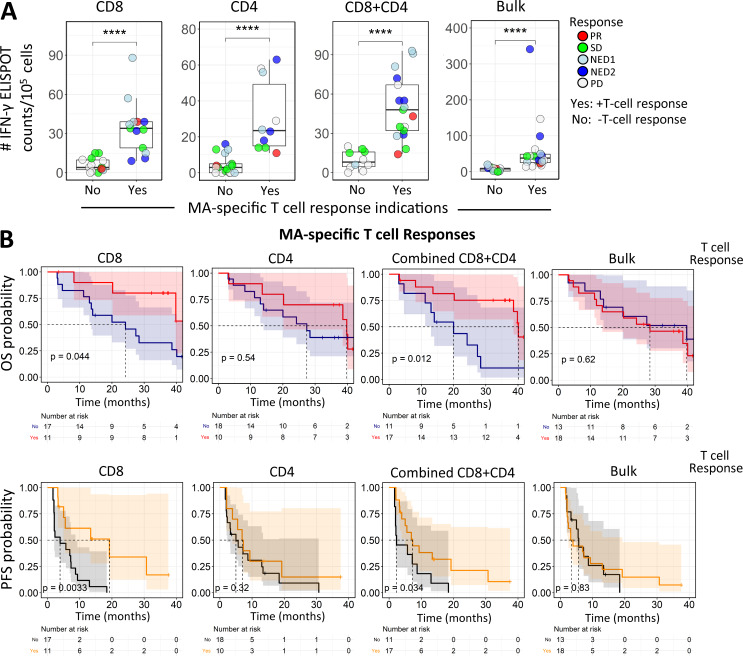
The importance of vaccine antigen-specific responses has been unclear across trials due in part to patient and assay heterogeneity. As shown above, individual antigen responses did not significantly impact OS or PFS. In contrast, when bulk PBMC, purified CD8 or CD4 T cells, or CD8+CD4 T cell responses to all three shared antigens were combined, significant associations with survival could be observed (Fig. 3, A and B). Kaplan-Meier curves comparing patients whose T cells did or did not exhibit antigen-specific responses (to any of the MAs) showed that having a CD8 T cell response was associated with longer OS and PFS, and this association was also apparent when considering the combined CD8 and CD4 T cell responses (Fig. 3 B). This provides evidence that total vaccine-induced T cell responses are important in determining patient outcome.
Figure 3.
Combined totals of individual antigen-specific T cell IFN-γ ELISPOT counts correlate with PFS. (A) Summary graphs for CD8, CD4, total (CD8+CD4), and bulk (total PBMCs) IFN-γ ELISPOT counts (net count total for the three shared antigens at d43) with respect to T cell responses, as defined in Materials and methods. Test groups: CD8+ selected T cells responding to either autologous “iDCs” (immature DCs) transduced with a single MA-encoding AdV or (in HLA-A2+ patients) T2 cells pulsed with well-characterized immunodominant peptides; CD4+ selected T cells responding to autologous iDCs transduced with single MA Adv; and bulk (total PBMCs) T cell responses to autologous iDCs transduced with single MA AdV. ****, P ≤ 0.0001. (B) Kaplan-Meier survival analysis of OS and PFS comparing the survival benefits of positive CD8, CD4, combined CD8+CD4, and bulk responses. The log rank test was used to compare the Kaplan-Meier curves.
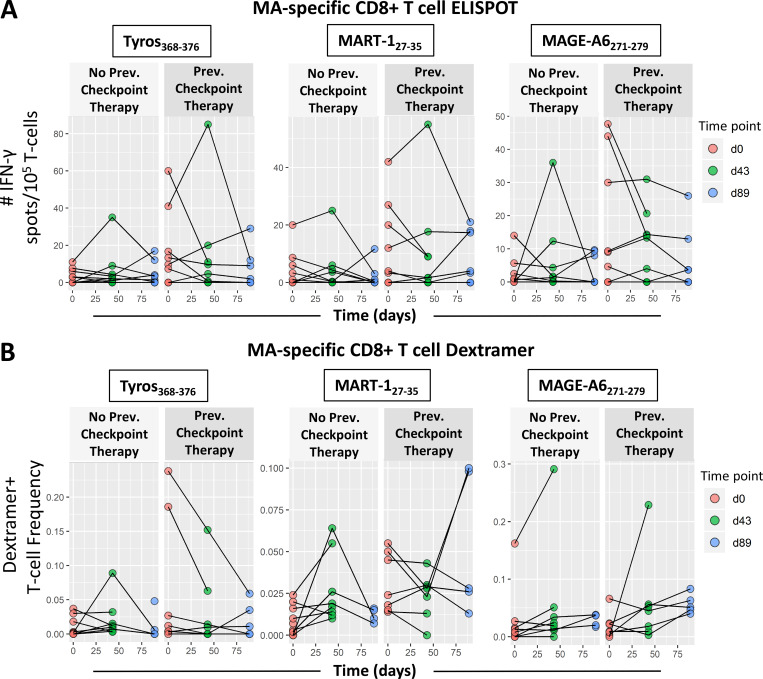
Because this trial allowed enrollment of late-stage disease, 26/35 patients enrolled in the trial had received one or more prior systemic treatments. 15 patients had received CTLA-4 checkpoint blockade, seven of whom also received PD-1 blockade (Table S1; Butterfield et al., 2019). ELISPOT counts and dextramer-positive T cell frequencies used to measure MA-specific T cell responses at multiple time points (Fig. 4) appeared to be higher overall in patients who had received previous α–CTLA-4 and/or α–PD-1 therapies (Table S2). To evaluate this effect along with changes in MA-specific T cell responses over time after vaccination, we used a linear mixed effect model with fixed effects for time and previous checkpoint inhibitor therapy and random intercepts per patient to account for correlation of measurements within individuals. For these 16 HLA-A2+ patients, ELISPOT counts representing IFN-γ response were higher by ∼6 per 105 T cells in patients who had received previous checkpoint inhibitor therapy, and the dextramer frequencies showed a small but significant difference based on previous therapy for MART127–35. These data suggest that blockade of CTLA-4 and/or PD-1 can slightly amplify MA-specific T cells, and this difference can persist through the vaccine time course (day 0–89 [d0–d89]). However, these responses are not amplified by subsequent vaccination. The only antigen-specific T cell response that showed a clear increase over time was the MAGE-A6271–279 dextramer frequency, but not its corresponding functional ELISPOT responses.
Figure 4.
Effect of previous treatment with checkpoint blockade on MA-specific T cell responses. Melanoma patients were plotted separately based on whether patients received checkpoint blockade before trial enrollment and DC vaccination. Patients in the “Previous Checkpoint Therapy” panels received α–CTLA-4 and/or α–PD-1 before DC vaccination. (A) IFN-γ ELISPOT counts for CD8 T cell responses against Tyros368–376, MAGE-A6271–279, and MART-127–35 (n = 28; 15 no blockade, 13 with blockade) were compared between patient groups across the entire time course. (B) Frequencies of dextramer-specific CD8 T cells for Tyros368–376, MAGE-A3271–279, and MART-127–35 (n = 16; 9 no blockade, 7 with blockade) were compared between patient groups across the entire time course. (A and B) Differences were characterized by linear mixed model analysis, with results listed in Table 1. Prev., previous; Tyros, tyrosinase.
Patients with tumor regression have vaccine antigen-specific CD8 T cells with low levels of PD-1 expression
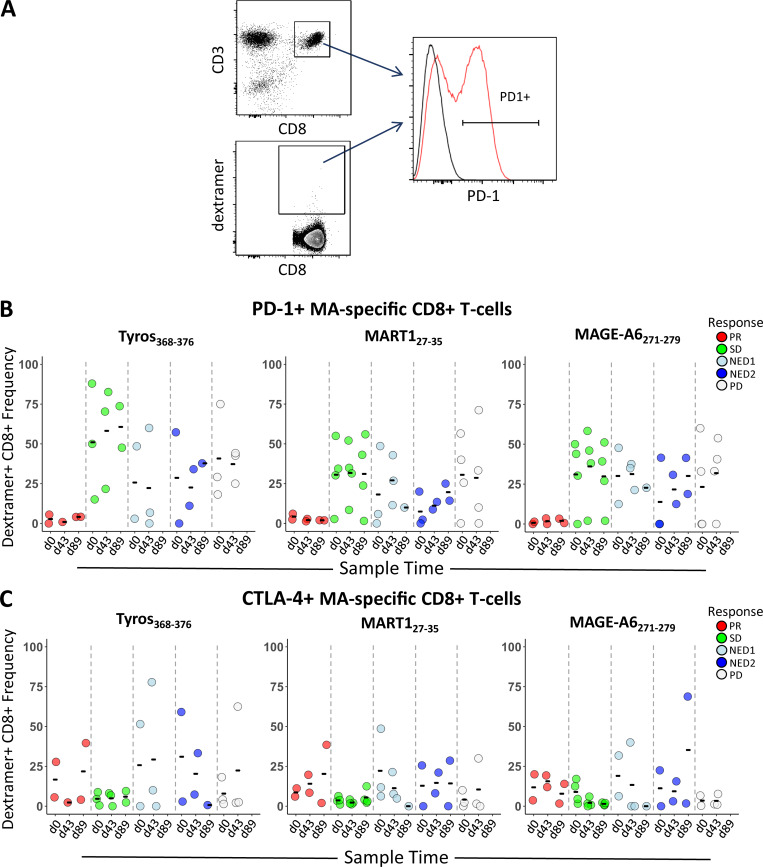
To address the role of activation and exhaustion phenotypes on MA-specific CD8 T cells, surface expression of PD-1, CTLA-4, TIM-3, and LAG-3 was tested (Fig. S2 A). Two partial responders (PRs; patients 10 and 20) had strikingly low frequencies of PD-1–positive total and MA-specific CD8 T cell populations (Fig. 5 A, B). Patient 34 with stable disease (SD) also exhibited low PD-1 expression. Patient 21, a patient who had no evidence of disease (NED) at enrollment and who then progressed at 7 mo, also exhibited low PD-1 expression at baseline but showed 25%–41% positive PD-1 expression by d89. Only patient 34 had received α–PD-1 therapy (the other three patients were treatment naive or had previous CTLA-4 blockade or previous IFN-α). Expression of CTLA-4 (Fig. 5 C) was less frequent than PD-1, and there were no significant correlations observed between clinical outcome and expression of CTLA-4 and/or TIM3 on MA-specific CD8 T cells (TIM3 data not shown). Because PD-1 is also an activation marker, the IFN-γ ELISPOT results for these four patients were examined to evaluate whether there was evidence of MA-specific T cell activation. Three of four had CD8 T cell responses to one to three MAs, but at just over the limit of detection, while the fourth had a total PBMC (CD4 or CD8) response. Thus, the lack of PD-1 protein detection on total and MA-specific CD8 T cells may be due to low activated MA T cell frequency.
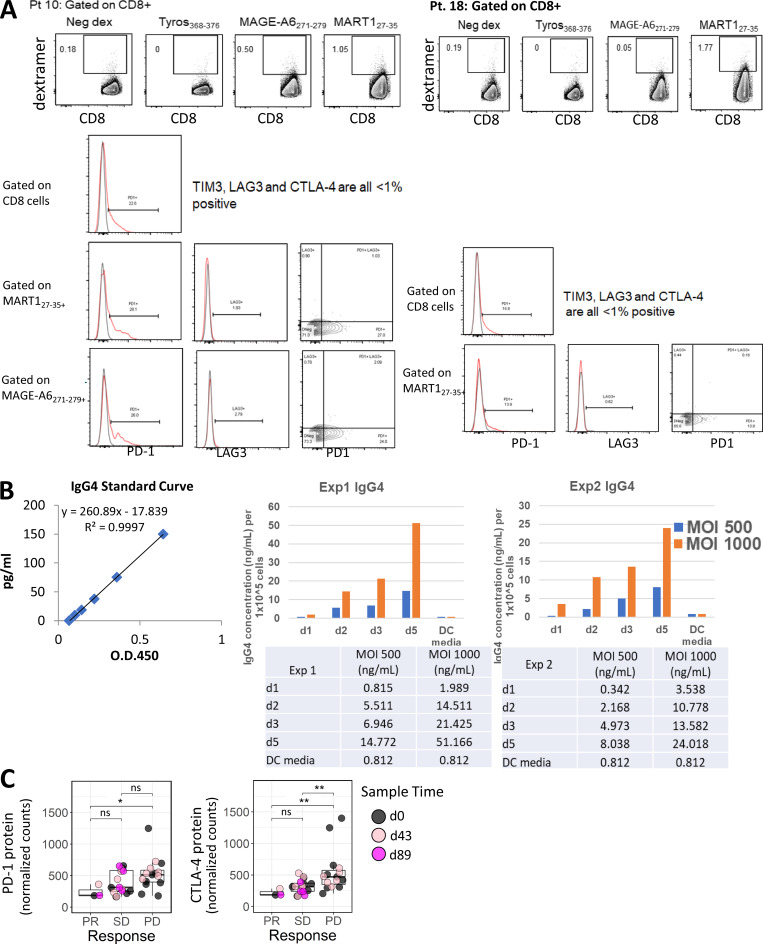
Figure S2.
Post-trial assessment of MA-specific CD8 T cells from two HLA-A2+ patients 1.5–2 yr after DC vaccination. PBMC samples from two patients were used to determine the frequency of circulating dextramer-specific CD8 T cells as well as to examine checkpoint expression in CD8 and MA-specific CD8 T cells for patient 10 and patient 18 (A), 1.5 and 2 yr after DC vaccination, respectively. Frequencies shown for each dextramer were calculated by subtracting the negative control dextramer (Neg dex) frequency for each sample tested. Raw data histograms are shown with isotype controls for coexpression of other proteins as labeled. (B) Measurement of IgG4 in serum-free supernatants of HD DC transduced with Ad5.hPD1Ab. Two different HD monocyte-derived DC preparations were cultured for 5 d, harvested, and transduced with 500 or 1,000 MOI Ad5.hDP1Ab for 3 h before replating using serum-free AIMV media. Supernatant aliquots were taken each day as indicated after DC transduction. The concentration of human IgG4 in supernatants was quantified using a human IgG4 ELISA kit (Invitrogen) per manufacturer’s instructions. (C) Graphs show distribution of PD-1 and CTLA-4 protein expression in circulating lymphocytes grouped according to clinical response. The Wilcoxon rank sum test was used for calculating P values. *, P ≤ 0.05; **, P ≤ 0.01. ns, not significant; Tyros, tyrosinase.
Figure 5.
PD-1 and CTLA-4 expression on CD8 and MA-specific T cells. (A) Gating strategy used to determine dextramer frequencies of PD-1– and CTLA-4–positive MA-specific CD8 T cells from HLA-A2+ patients. (B and C) Shown are distributions of PD-1– (B) and CTLA-4–positive (C) dextramer-specific CD8 T cells from HLA-A2+ patients grouped according to clinical outcome across time points (d0, d43, and d89; n = 16 total; two PR, three SD, three NED1, three NED2, and five PD). Tyros, tyrosinase.
Long-term follow-up of melanoma-specific T cell responses in two patients
Of the 35 patients, 14 (40%) were alive at follow-up assessment. Post-trial PBMC samples were available for HLA-A2+ patients 10 and 18 from 1.5 and 2 yr after DC vaccination, respectively, which were tested for long-term MA-specific CD8 T cell responses (Fig. S2 A). Patient 10 (partial response [PR]) subsequently received pembrolizumab for 5 mo. At 1.5 yr after vaccination, this patient had 166- and 40-fold increases in the frequency of MAGE and MART-1 circulating CD8 T cells (0.50% MAGE-A6271–279+ and 1.00% MART127–35+) compared with d43. There was also higher PD-1 expression on total CD8 and MA-specific T cells (0%–5% vs. 22%–26%). LAG3 was minimal (Fig. S2 A). 4.5 yr after DC vaccination, this patient has multiple soft tissue and muscle metastases.
Patient 18 had NED on initial assessment following the protocol intervention, then progressed within 5 mo and received ipilimumab for 3 mo followed by pembrolizumab. 2 yr after vaccination, this patient had 100-fold higher MART127–35+ CD8 T cells in the periphery. There was 13%–16% PD-1 expression on CD8 and MART127–35–specific T cells (Fig. S2 A), similar to d43 (13.5%–17% PD-1+). There was also minimal LAG3 expression detected. At 4.75 yr from vaccination, this patient has measurable disease and is now in a different clinical trial. These data suggest that postvaccine checkpoint blockade, particularly anti–PD-1, may amplify vaccine-induced T cell responses.
Simultaneous PD-1 blockade and MART-1 antigen expression by DCs
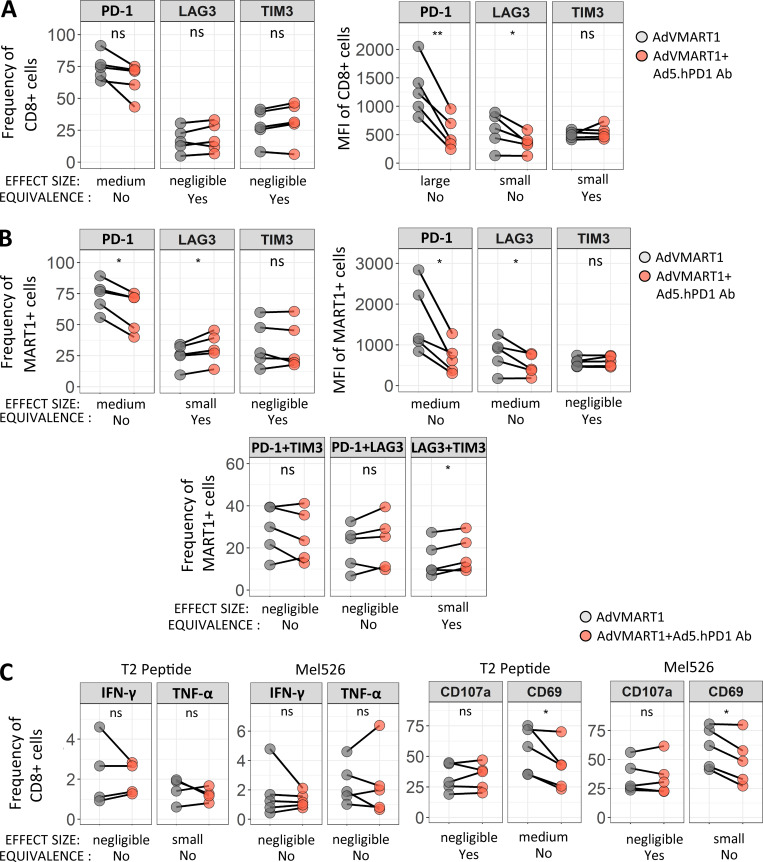
To determine whether enforced PD-1 reduction (Shimizu et al., 2018) at the same time as antigen presentation would enhance T cell responses, patients’ T cells with high PD-1 expression were stimulated in vitro with autologous DCs transduced with AdVMART1 (Butterfield et al., 1998), then restimulated with DCs transduced with AdVMART1 ± Ad5.hPD1Ab (encoding a secreted form of human α–PD-1 with an IgG4 isotype (Garcia-Bates et al., 2016; Fig. S2 B). There were no significant differences in CD8 T cell proliferation or in expansion of MART127–35+ CD8 T cells (data not shown). T cells stimulated with DCs transduced with AdVMART1 + Ad5.hPD1Ab had reduced PD-1+–expressing CD8 and MART127–35+ T cells by frequency and mean fluorescence intensity, suggesting successful PD-1 blockade (Fig. 6, A and B). MART127–35+ T cells stimulated with DCs transduced with both adenoviral constructs also had significantly more LAG3+ as well as LAG3+TIM3+–expressing cells (Fig. 6 B). There were no significant differences in IFN-γ or TNF-α production (Fig. 6 C). T cells that were stimulated with both constructs showed reduced frequency of CD69+ CD8 T cells, suggesting decreased activation upon addition of α–PD-1.
Figure 6.
Effect of stimulating CD8 T cells with DCs transduced with AdVMART1 and Ad5.hPD1Ab in vitro on T cell function. T cells were stimulated with AdVMART1 transduced autologous DCs in vitro followed by restimulation with DCs transduced with AdVMART1 only (gray circles) or in combination with Ad5.hPD1Ab (orange circles). (A and B) Summary graphs showing frequency and mean fluorescence intensity (MFI) of checkpoint molecules CTLA-4, LAG3, PD-1, and TIM3 in CD8 T cells (A) or MART127–35+ CD8 T cells (B). (C) T cells were stimulated with MART127–35+–pulsed T2 or Mel526 and examined for TNF-α, IFN-γ CD107a, and CD69 expression. n = 5; P values shown were calculated using paired t tests. Effect sizes are summarized using Hedges’ g as follows: g < 0.2 (negligible), g < 0.5 (small), g < 0.8 (medium), and g > 0.8 (large). A detailed list of effect sizes, confidence intervals, and equivalence testing results for these data are provided in Table S2. (A–C) *, P ≤ 0.05; **, P ≤ 0.01. ns, not significant.
Protein profiling of circulating lymphocytes
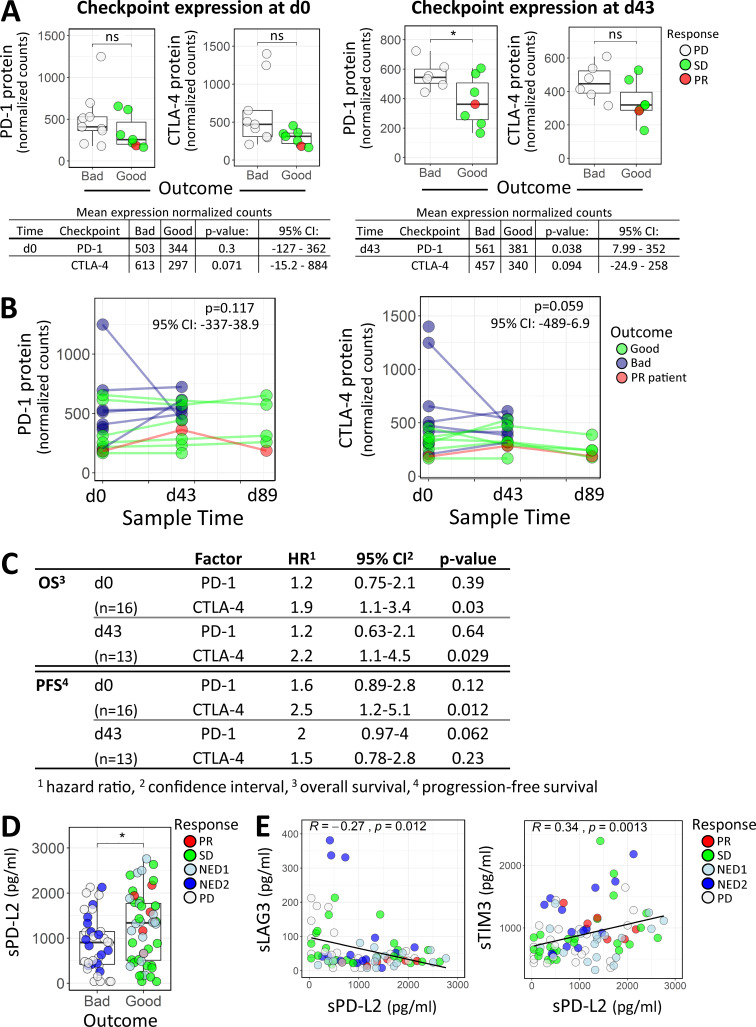
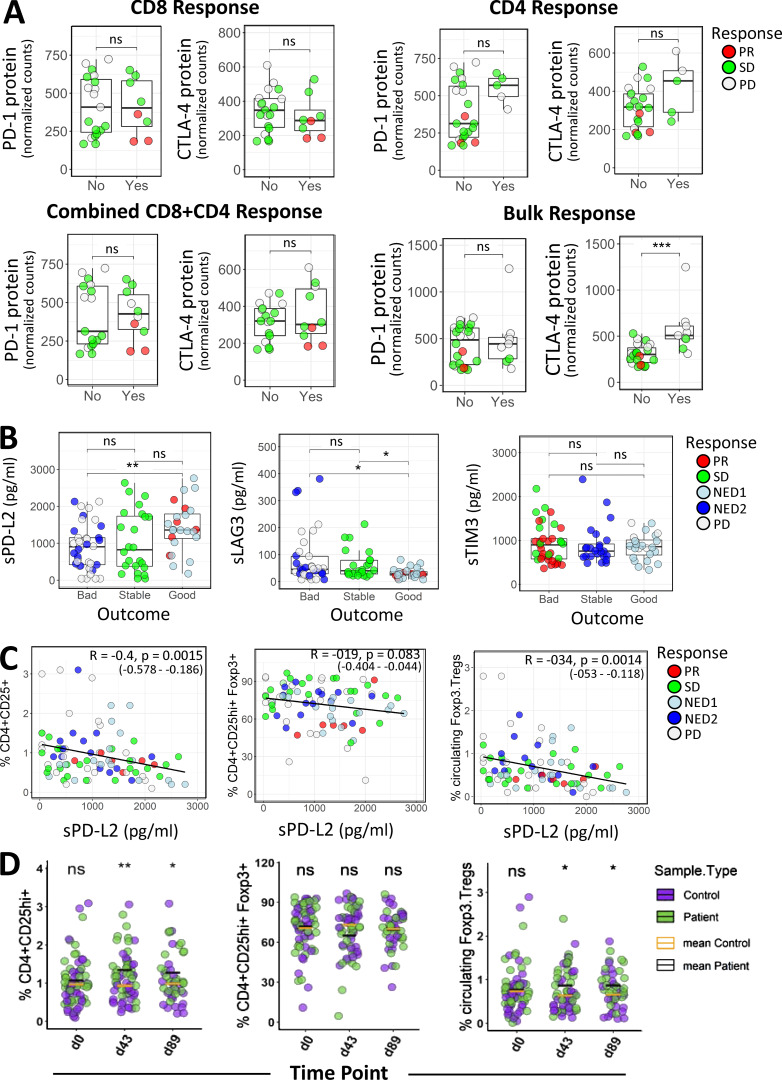
To more broadly examine key immune mechanisms, targeted protein levels in circulating lymphocytes were analyzed using a 30-plex NanoString panel, and differential protein expression was compared between clinical outcomes and functional T cell responses. Table 1 depicts differentially expressed proteins between outcome groups in both baseline and postvaccine samples. With a focus on checkpoint expression, we observed significantly higher PD-1 protein counts in the unfavorable (bad) patient outcome group at d43 (Fig. 7 A). CTLA-4 levels showed similar elevation in the bad outcome groups for both d0 and d43, although these comparisons were not significant at α = 0.05 (d0 mean count difference = 316; d43 mean count difference = 117; Fig. 7 A). Comparing checkpoint expression levels from all time points across the PD, SD, and PR outcome groups shows incrementally higher checkpoint expression in worse outcomes (PR < SD < PD; Fig. S2 C). To further evaluate the differential checkpoint expression between outcome groups over the entire time course (Fig. 7 B), we used a linear mixed effect model with fixed effects for time and outcome and random intercepts per patient to account for correlation of measurements within individuals. The outcome terms in these models did not show P < 0.05 by a likelihood ratio test, but the data nevertheless appear consistent with higher expression levels in the unfavorable outcome group (Fig. 7 B). Furthermore, Cox regression analysis revealed significant inverse associations between baseline CTLA-4 expression and OS and PFS (Fig. 7 C). In postvaccine measurements, higher CTLA-4 levels were associated with lower OS (hazard ratio [HR] of 2.2 based on standardized expression levels; P = 0.03), while higher expression of PD-1 appeared to be associated with worse PFS (HR of 2; P = 0.06; Fig. 7 C). Next, we compared checkpoint expression based on patient-derived MA-specific T cell responses. Significantly higher CTLA-4 protein expression was observed for patients who showed an IFN-γ response in bulk PBMCs, but not in purified T cell subsets (Fig. S3 A). We did not observe significant differences in PD-1 levels for bulk PBMC or purified T cell subsets.
Table 1. Protein profiling in circulating lymphocytes.
| Protein namea | CD name | FCb | Adjusted P valuec |
|---|---|---|---|
| Baseline PD vs. SD/PR | |||
| CTLA-4 | CD152 | 1.8 | 0.388 |
| NCAM | CD56 | 1.66 | 0.388 |
| CD45RO | CD45RO | 1.52 | 0.388 |
| d43 PD vs. SD/PR | |||
| CTLA-4 | CD152 | 1.39 | 0.786 |
| PD-1 | CD279 | 1.59 | 0.743 |
| CD45RO | CD45RO | 1.69 | 0.450 |
| BTLA | CD272 | −1.75 | 0.450 |
| CD19 | CD19 | −1.8 | 0.743 |
| HLA-DRA | HLA-DRA | −1.84 | 0.450 |
| CD40 | CD40 | −2.04 | 0.450 |
NanoString protein profiling was used to test elutriated circulating lymphocytes. n = 16 (at baseline: 1 PR, 6 SD, 9 PD), and n = 11 (at d43: 1 PR, 4 SD, 6 PD). Immune checkpoint molecules are in bold.
Common protein name is listed. CD, cluster of differentiation name. FC, fold change.
Fold change is shown, where positive expression is higher in PD (Bad) compared to SD/PR (good) patient group. Negative correlations are shaded.
False discovery rate adjusted P value was calculated using Benjamini Hochberg correction.
Figure 7.
Immune checkpoint profiling in circulating lymphocytes and patient serum. (A) PD-1 and CTLA-4 protein expression comparisons between outcome groups in baseline (d0) or d43 circulating lymphocytes. The Wilcoxon rank sum test and unpaired Welch’s t test were used for calculating P values at d0 and d43, respectively. *, P ≤ 0.05. (B) A linear mixed effect model was used to evaluate differential PD-1 and CTLA-4 protein expression between outcome groups, accounting for repeated measures of individuals across the three time points (d0, d43, and d89). Statistical significance and 95% confidence intervals (CIs) for the outcome group coefficients are indicated. (C) Univariate Cox regression analysis of PD-1 and CTLA-4 checkpoint protein expression in circulating lymphocytes isolated at baseline (d0) or after vaccine (d43) and their association with OS and PFS. (D) Difference in sPD-L2 expression with respect to good and bad clinical outcome, with P value from Wilcoxon rank sum test. *, P ≤ 0.05. (E) Scatter plots showing correlations between sPD-L2 and sLAG3 (95% CI = −0.457 to −0.06) and sPD-L2 and sTIM3 (95% CI = 0.137–0.516). Spearman correlation coefficient (R) and corresponding P value are indicated on the graphs. ns, not significant.
Figure S3.
Immune checkpoint profiling in circulating lymphocytes and Luminex immune checkpoint profiling in serum. (A) Distributions of checkpoint PD-1 and CTLA-4 protein expression in relation to patient-derived MA-specific CD8, CD4, combined CD8+CD4, and Bulk (Total PBMCs) IFN-γ T cell responses, as defined in Materials and methods. (B) The Human Checkpoint 14-plex assay kit (Procarta Plex) was used to measure serum proteins, including checkpoint, costimulatory, and exhaustion markers in 35 patients profiled at baseline (n = 35), d43 (n = 30), and d89 (n = 20). Shown are distributions of soluble cytokine sPD-L2, sLAG3, and sTIM3 levels across the clinical outcome groups. For A and B, the Wilcoxon rank sum test was used for calculating P values. *, P ≤ 0.05; **, P ≤ 0.01; ***, P ≤ 0.001. (C) Scatter plots showing correlations between FACS T reg cell profiles and sPD-L2 levels. Spearman correlation coefficient (R), P values, and 95% confidence intervals are indicated. (D) Percentage distributions of FACS T reg cells in melanoma patient and normal donor samples. P values denoting significance between patient and healthy samples at indicated time points were calculated using the unpaired Welch’s t test. *, P ≤ 0.05; **, P ≤ 0.01. ns, not significant.
Analysis of soluble cytokines revealed that patients in more favorable outcome groups (PR/SD) exhibited higher levels of soluble PD-L2 (sPD-L2) and lower levels of the exhaustion factor sLAG3 (Fig. 7 E and Fig. S3 B). Expression of sPD-L2 was inversely correlated with sLAG3 and positively correlated with sTIM3 (Fig. 7 E). A Cox regression model incorporating time-dependent covariates was used to evaluate the effect of sPD-L2, as well as sPD-1, sTIM3, and sLAG3, on patient survival. When these soluble proteins were tested in univariate models, sPD-L2 showed the best evidence for association with OS (HR of 0.65; P = 0.08), and higher levels were associated with longer survival (Table S5).
Gene expression analysis of circulating lymphocytes and tumors
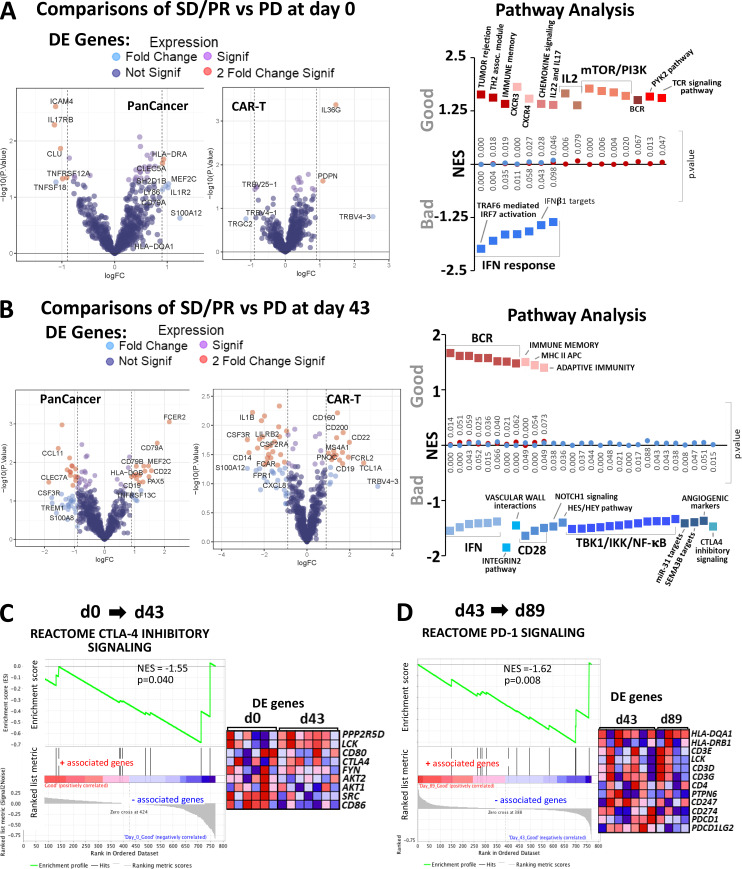
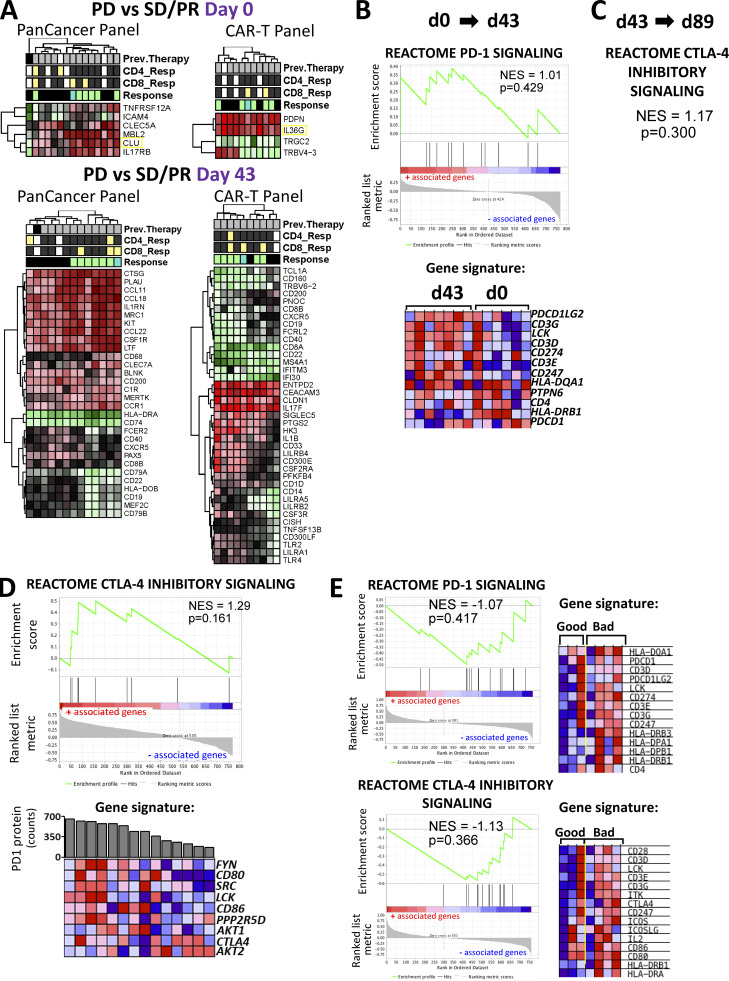
Gene expression analysis of circulating lymphocytes at baseline and d43 revealed 11 and 63 significantly differentially expressed genes, respectively (Fig. 8, A and B; and Fig. S4 A). Differentially expressed genes in the favorable response group at baseline were enriched for immunological pathways pertaining to TCR signaling, chemokine signaling, tumor rejection, and immune memory (Fig. 8 A). Favorable response groups in d43 samples showed enrichment for B cell receptor, adaptive immunity, and class II MHC antigen presentation signaling pathways. Of interest, a cluster of genes in the CTLA-4 inhibitory signaling and CD28 costimulatory pathways were enriched in the unfavorable response group (Fig. 8 B). Unexpectedly, gene sets representing type I IFN responses correlated with inferior clinical response at both baseline and d43 time points (Fig. 8, A and B).
Figure 8.
Differential expression and gene enrichment pathway analysis in circulating lymphocytes. (A and B) Volcano plots show differential gene expression by fold change (logFC) and P value (−log10[p]) for the PanCancer Immune Profiling and CAR-T Characterization NanoString gene panels comparing good (SD/PR) with bad (PD) outcome groups at baseline (d0; A) and d43 (B) in circulating lymphocyte samples. Table S3 lists information about the samples selected for NanoString profiling. Dark blue dots denote nonsignificant genes, purple dots denote significant genes with fold change ≤1.85, light blue dots represent genes with fold change ≥1.85 and P value ≥0.05, and red dots indicate genes with fold change ≥1.85 and P value ≤0.05. Summary of pathways identified by GSEA/MSigDB analysis as showing enrichment among highly differentially expressed genes at d0 (A) and d43 (B). The y axis denotes NES, and the squares represent up-regulated (red, associated with good outcome) and down-regulated (blue, associated with bad outcome) pathways with corresponding gene enrichment P values indicated on the midline. (C) GSEA plot for the CTLA-4 inhibitory pathway and a heatmap of its associated gene set, illustrating enrichment for down-regulation at d43 relative to d0. (D) GSEA plot for the PD-1 signaling pathway and its associated gene set, which is down-regulated at d89 versus d43 in circulating lymphocytes. For C and D, circulating lymphocytes from patients with good clinical outcome were used, as there were no available samples from PD patients. Heatmaps in C and D show the clustered genes in the leading-edge subsets for each pathway category. Gene expression values are represented as colors, where the range of colors (red, pink, light blue, dark blue) shows the range of expression values (high, moderate, low, lowest).
Figure S4.
Differential gene expression and immune checkpoint pathway associations in circulating lymphocytes and tumor/TIL samples. (A) Heatmaps for differentially expressed genes. Shown are heatmaps for differentially expressed genes between clinical response groups that were profiled using the PanCancer Immune Profiling and CAR-T Characterization panels in baseline and d43 circulating lymphocytes. Differential gene expression analysis was conducted using the limma R package as described in the Materials and methods section. Hierarchical clustering of DEGs was conducted using the pheatmap R package. The threshold for DE genes was set to fold change ≥1.85 and P value ≤0.05. Relevant phenotypic patient information associated with each lymphocyte sample is illustrated above the heatmaps. (B) PD-1 signaling pathway enrichment changes from d0 to d43 circulating lymphocytes. Shown is a GSEA plot and associated gene signature for the PD-1 signaling pathway. This figure comes from the same set of analysis and is analogous to the CTLA-4 GSEA plot in Fig. 8 C. (C) CTLA-4 pathway enrichment changes from d43 to d89 circulating lymphocytes. Shown are statistical parameters (NES and P value) for the CTLA-4 inhibitory signaling pathway. This figure comes from the same set of analysis and is analogous to the PD-1 GSEA plot in Fig. 8 D. (D) Results from the GSEA correlation-based enrichment analysis, which used the numeric PD-1 protein expression levels as a continuous phenotype. d43 and d89 (omitting baseline samples) circulating lymphocyte expression sets were used for this analysis. Shown is a representative GSEA plot and heatmap for genes involved in the CTLA-4 inhibitory signaling pathway, which positively correlated with PD-1 protein expression (shown as bar graph above the heatmap) in patient lymphocytes. (E) Immune checkpoint pathways associated with clinical outcomes in tumor biopsies. Shown are GSEA plots for PD-1 signaling and CTLA-4 inhibitory pathways enriched in tumor biopsy specimens from unfavorable (bad) clinical outcome patient groups. The associated gene signatures are presented in the form of heatmaps next to GSEA plots. Heatmaps in B–E show the clustered genes in the leading-edge subsets for each pathway category. Gene expression values are represented as colors, where the range of colors (red, pink, light blue, dark blue) shows the range of expression values (high, moderate, low, lowest). Prev., previous.
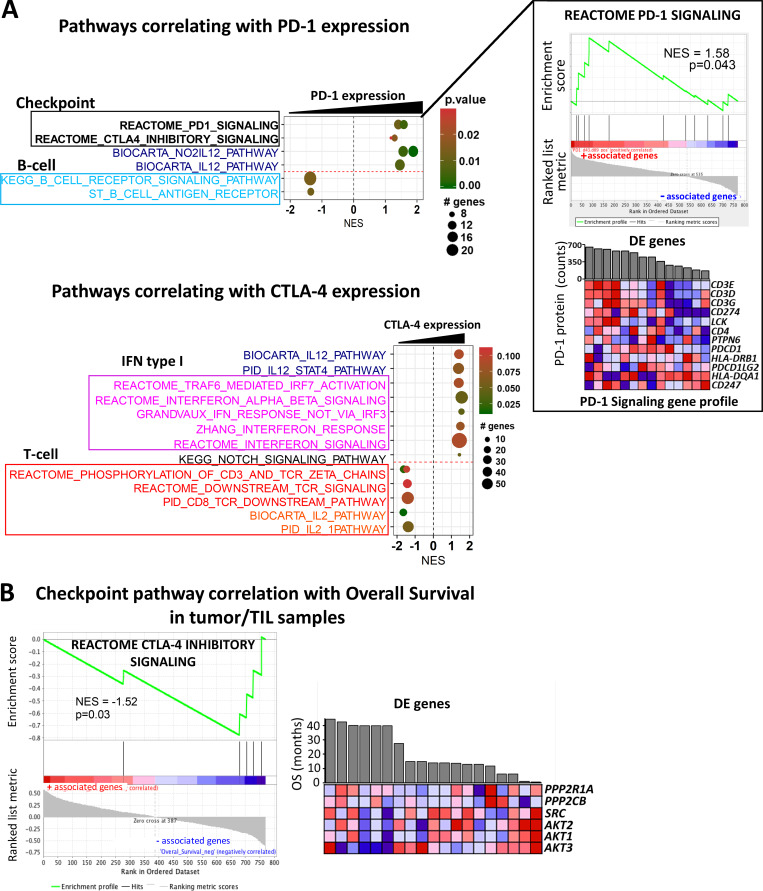
In addition to differences between outcome groups, we examined immune checkpoint pathway changes between vaccine trial sample time points at d43 versus d0 and d89 versus d43. For these analyses, we used circulating lymphocytes from patients with good clinical outcome, as there were no available samples from d89 for poor outcome group patients. Here, we show that the CTLA-4 inhibitory signaling pathway was significantly down-regulated following vaccination (Fig. 8 C). We also surveyed checkpoint pathway changes between d43 and d89 and saw that the PD-1 signaling pathway was primarily down-regulated during this later part of the trial (Fig. 8 D). The analogous pathway results for PD-1 and CTLA-4 are shown in Fig. S4, B and C, respectively. With a focus on immune checkpoint signaling, we used the linear combination method within the gene set enrichment analysis (GSEA) software to determine pathway enrichment based on correlation with PD-1 or CTLA-4 protein expression as a continuous phenotype. With an interest in postvaccine–induced changes, we combined the d43 and d89 (omitting baseline samples) circulating lymphocyte expression sets for this analysis (Fig. 9 A and Fig. S4 D). Interestingly, B cell receptor pathways negatively correlated with elevated PD-1 protein expression, while gene signatures downstream of T cell receptor activation and IL2 signaling showed negative correlations with high CTLA-4 protein expression (Fig. 9 A). Furthermore, increased CTLA-4 protein levels showed strong associations with numerous IFN type I response pathways (Fig. 9 A). As a positive validation, we observed that elevated PD-1 levels correlated well with genes in the PD-1 signaling gene set (Fig. 9 A). CTLA-4 inhibitory signaling showed suggestive but not significant correlation with PD-1 protein levels (Fig. S4 D). The checkpoint pathways for PD-1 (normalized enrichment score [NES] = 0.84; P value = 0.670) and CTLA-4 (NES = 0.87; P value = 0.613) only weakly associated with the CTLA-4 protein continuous phenotype and did not show statistical significance.
Figure 9.
Significantly enriched pathways associated with immune checkpoint expression levels in circulating lymphocytes and clinical outcome in tumor biopsies. (A) Several GSEA pathways correlating with PD-1 and CTLA4 protein expression are represented. Gene sets belonging to different pathway categories are represented as dots, which are organized by their NES score along the x axis. The color and size of the dots indicate the corresponding P values and number of genes associated with the gene set, respectively. Representative GSEA plot and heatmap for genes involved in the PD-1 signaling pathway, which positively correlates with PD-1 protein expression (shown as bar graph above the heatmap) in patient lymphocytes. (B) GSEA plot and clustered heatmap of expression values for leading edge genes in the CTLA-4 inhibitory signaling pathway, which negatively correlates with OS in tumor biopsy samples (n = 19). Refer to Fig. 7 for interpretation of the gene expression values in heatmaps.
In addition to circulating lymphocytes, we further evaluated clinical outcome–related gene expression changes in the CTLA-4 and PD-1 signaling pathways in patient tumor/tumor infiltrating lymphocyte (TIL) samples. Genes in the CTLA-4 and PD-1 pathways showed increased expression primarily in the inferior outcome patient groups, although this did not represent significant enrichment based on GSEA (Fig. S4 E). Additionally, we correlated checkpoint pathways in tumor samples with OS as a continuous phenotype (in months). The PD-1 pathway did not show significant enrichment in this test (NES = 0.86; P value = 0.651), but CTLA-4 inhibitory signaling in the tumor/TIL samples was negatively associated with OS (Fig. 9 B). There was no enrichment found based on correlation with OS for the PD-1 (NES = 0.59; P value = 0.952) or CTLA-4 (NES = −0.95; P value = 0.534) pathways in circulating lymphocytes.
Discussion
Here, we have tested multiple key aspects of the T cell response to cancer vaccination to identify the critical parameters for future success of vaccine approaches. We find that the amount of antigen expressed by the DC does not define the subsequent T cell response to that antigen or the clinical outcome of vaccinated patients. We observed reduced PD-1 on CD8 T cells in the best clinical responders, and we found that blocking PD-1 in the presence of DC T cell stimulation reduces PD-1 surface expression but does not increase antigen-specific T cell activity. These results contrast with those of Hobo et al. (Hobo et al., 2013; Van den Bergh et al., 2017), who found that reducing PD-L1/L2 by siRNA ± IL-15 trans-presentation in DC did improve expansion of MAGE-A3–specific CD8+ T cells in vitro from healthy donors (HDs). One key difference may be that we tested PD-1–high T cells from cancer patients.
Previous checkpoint blockade therapy did amplify vaccine antigen T cell responses, which persisted throughout the course of vaccination. However, our functional IFN-γ ELISPOT results (Fig. 4 A) suggest that previous checkpoint blockade did not prime these patients for higher functional T cell responses. A clear increase in MAGE-A6271–279 dextramer+ frequency over time suggests that expansion of a subset of MA-specific cells was enhanced, which is under further investigation. Two patients who received postvaccine checkpoint therapy had highly amplified MA-specific T cell frequencies, suggesting that the schedule of vaccination and checkpoint therapy is important for optimizing T cell responses. Whether the postvaccine checkpoint therapy triggered functional memory T cell responses in these patients is also under investigation. Protein expression profiling also confirmed increased levels of the checkpoint molecules PD-1 and CTLA-4 in circulating lymphocytes from patients with worse clinical outcome (Fig. 7, A and B; and Fig. S2 C). Along with the inhibitory action on T cell activation, increased expression of these immunosuppressive molecules, primarily CTLA-4 (Wei et al., 2018), is associated with inferior clinical responses, both PFS and OS (Fig. 7 C). Despite this, differences in expression levels for PD-1 and CTLA-4 in circulating lymphocytes did not associate with IFN-γ responses from bulk PBMC or purified T cell subsets. The only significant difference found was higher CTLA-4 protein expression in the group showing an IFN-γ response in bulk PBMCs (Fig. S3 A).
While soluble PD-L1 has been used as a prognostic biomarker in melanoma patients treated with checkpoint blockade therapy (Zhou et al., 2017), the pathophysiological significance of soluble forms of checkpoint molecules including PD-1, PD-L1, and PD-L2 in serum from cancer patients is not yet fully elucidated (Zhu and Lang, 2017; Appleman et al., 2018), but it is beginning to be reported. Our multiplex serum analyses revealed that patients in more favorable outcome groups (PR/SD) exhibited increased levels of sPD-L2. Here, we report for the first time a suggestive association between higher sPD-L2 levels and longer OS in melanoma patients (P = 0.08; Table S5). A recent phase 2 study in hepatocellular carcinoma surveyed PD-L2 as a circulating biomarker but did not find significant correlations with clinical responses (Feun et al., 2019). We also observed that sPD-L2 correlates negatively with soluble LAG3 and positively with soluble TIM3, but the biological significance of these relationships remains to be determined (Fig. 7 E). In this study, we quantified total T cell populations by whole blood PBMC FACS, and we further showed that the amount of regulatory T cells (T reg cells) inversely correlates with sPD-L2 (Fig. S3 C). While the CD4+CD25+CD127low T reg cells did not correlate with sPD-L2 levels, this T cell subtype, known to exhibit anti-proliferative effects on CD4+CD25− T cells (Yu et al., 2012), was significantly elevated in melanoma patients compared with heathy controls at baseline and post–IFN-α treatment (Fig. S3 D). This suggests that sPD-L2 may be an important biomarker in antitumor immune responses, and it will be further explored for use in predicting vaccination efficacy in melanoma patients.
We used gene expression analysis to better define the changes associated with disease outcome and to identify possible vaccine-induced changes in circulating lymphocyte populations. Differential gene expression analysis in baseline lymphocytes showed higher expression of the IL-1 cytokine family member IL36G in favorable outcome patients (Fig. 8 A). IL36G, CXCL19, and CXCL5 were part of the leading gene sets in GSEA for the IL-22 and IL-17 signaling pathways, and in a recent report by Wang et al. (2015), it was demonstrated that IL36γ synergizes with IL12/TCR signaling to promote CD8 T cell function and induce antitumor immune responses. Furthermore, IL36γ promoted the development of tertiary lymphoid organs and increased the efficacy of a DC vaccine to inhibit tumor progression of melanoma tumorigenesis in vivo (Weinstein et al., 2017). Additional gene sets associated with T cell differentiation, tissue chemotaxis, and immunosurveillance and good clinical response are the IL-2 and CXCR3/4 signaling pathways (Ross and Cantrell, 2018). Chemokine receptors play a critical role in lymphocyte-mediated tumor infiltration/regression, and reduced expression of CXCR3/4 chemokine receptors on peripheral CD8 and CD4 T lymphocytes was correlated with increased metastatic properties and widespread dissemination of tumors in melanoma patients (Jacquelot et al., 2016).
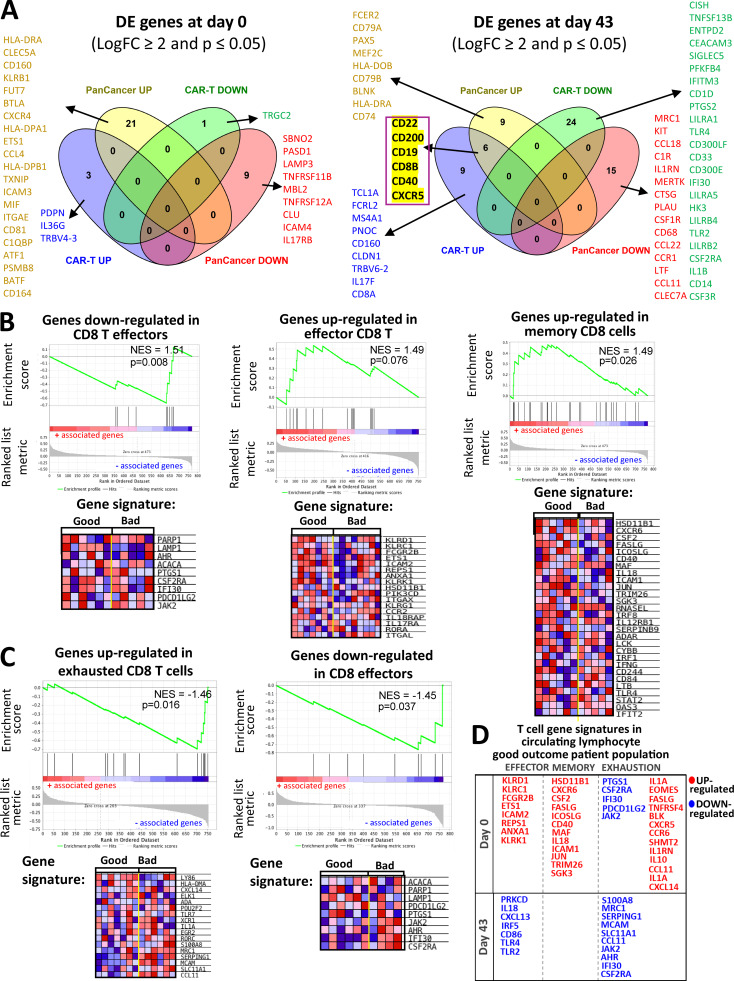
In this study, we used the NanoString PanCancer Immune Profiling and chimeric antigen receptor (CAR)–T Characterization gene expression panels, which share 276 genes in common and include 478 and 494 nonshared genes, respectively. The genes CD22, CD200, CD19, CD8B, CD40, and CXCR5 were shown to be up-regulated in the favorable clinical outcome groups in the postvaccine samples using both gene expression panels (Fig. S5 A). Higher CD40 and CD19 expression in the good response groups was also found at the protein expression level (Table 1). In addition to T cell receptor and costimulatory molecules, elevated expression of CD22, CD19, and CD40 denotes the likely presence of B cells in our circulating lymphocyte population. In fact, using GSEA pathway analysis, we found numerous B cell receptor (BCR) signaling gene signatures that were enriched in lymphocytes from patients with favorable outcome groups (Fig. 8 B). In addition, BCR signaling pathways were inversely associated with elevated PD-1 protein expression (Fig. 9 A). This result supports previous studies arguing for the importance of B cells in antigen-driven humoral immune responses against malignant melanoma (Chiaruttini et al., 2017). As part of the T cell characterization in this report, CD8B and CXCR5 were shown to mark a subset of memory CD4 T cells, which specialize in supporting antibody-mediated immune responses (Chevalier, et al., 2011). Furthermore, a multi-parametric FACS analysis of melanoma-reactive CD4 T cells from stage III malignant melanoma patients revealed elevated CXCR5 expression in a subset of CD4 T cells with enhanced responsiveness to melanoma cell antigen reexposure (Zhang et al., 2016). In addition to its role as a receptor for T cell priming and B cell activation (Elgueta, et al., 2009), functional expression of CD40 was shown in a recent study by Levin et al. (2018) to increase IFN-γ secretion and improve the functional properties of human CD8 cells, CD4 cells, and a subset of TILs in melanoma.
Figure S5.
Comparisons for differentially expressed genes between the NanoString Panels and GSEA analysis of T cell exhaustion gene profiles. (A) Summary of differentially expressed (DE) genes in circulating lymphocytes at d0 and d43. Venn diagrams show differentially expressed genes (LogFC ≥ 2 and P ≤ 0.05) in baseline (left) and d43 lymphocyte samples (right) that are represented in both the PanCancer Immune Profiling and CAR-T Characterization NanoString gene panels used in our study. PanCancer UP/DOWN and CAR-T UP/DOWN groups contain genes that are up-/down-regulated in the PanCancer Immune Profiling and CAR-T Characterization NanoString panel, respectively. Genes from each of the Venn diagram sections are listed in the figure. A set of six genes that are highlighted in yellow denote gene probes that were detected as up-regulated in both NanoString panels. (B and C) Immune checkpoint pathway associations with T cell exhaustion profiles in circulating lymphocytes. Representative GSEA plots for T cell exhaustion-related immune regulatory pathways correlating with good and bad clinical outcome groups in baseline (B) and d43 (C) circulating lymphocytes. T cell exhaustion signatures were obtained using the MSigDB C7 immunological gene database. Heatmaps next to the GSEA plots show clustered genes in the leading-edge subsets for each pathway category. Gene expression values are represented as colors, where the range of colors (red, pink, light blue, dark blue) shows the range of expression values (high, moderate, low, lowest). (D) Effector/memory T cellsversus exhaustion gene signatures in the good outcome patients’ circulating lymphocytes. Here, we provide a table summary for a set of differentially expressed genes at baseline (d0) and in postvaccine samples (43) that are categorized based on their association with a particular T cell phenotype (effector, memory, or exhaustion).
In comparisons of outcome groups at specific time points, we did not detect enrichment of immune checkpoint signaling pathways using differential expression of circulating lymphocytes at baseline (Fig. 8 A). However, GSEA analyses of postvaccine d43 samples revealed enrichment of the CTLA-4 inhibitory signaling pathway in the inferior outcome patient group (Fig. 8 B). We were also interested in changes over time in checkpoint pathway expression for d43 versus d0, and d89 versus d43. Since there were no available samples from d89 for the bad outcome group, for these analyses we used circulating lymphocytes from patients with good clinical outcome. Here, we show that CTLA-4 inhibitory signaling pathway genes were primarily down-regulated after vaccination (d43), while PD-1 signaling was primarily down-regulated later (d89; Fig. 8, C and D).
The CTLA-4 inhibitory signaling gene set showed the same direction of enrichment as gene sets related to CD28 signaling (Fig. 8 B). Expression levels of both of the B-7 family ligands of CD28, CD80, and CD86 were greater in the poor outcome groups (Rudd et al., 2009). Additional genes that, along with CTLA4, showed higher expression in the PD response groups were SRC, FYN, and LCK, which have been shown to modulate cellular trafficking and CTLA-4 receptor signal transduction (Miyatake et al., 1998; Hu et al., 2001). Our gene enrichment pathway analyses and protein profiling suggest that elevated inhibitory signaling from CTLA-4 in poor outcome patients likely plays a significant role in suppressing MA-specific T cell responses to the MA-engineered DC vaccine. A combination of ipilimumab with a DC vaccine has provided encouraging and durable antitumor responses in a phase 2 study in pretreated advanced melanoma (Wilgenhof et al., 2016). Therefore, these data collectively suggest that a future combination approach using CTLA-4 blockade during earlier phases of vaccine administration may facilitate early stages of MA-specific T cell activation and therefore improve patient immune responses.
A clear hallmark of a poor outcome lymphocyte profile included numerous genes associated with the IFN response and TRAF6/3–mediated IRF7 activation pathways (Konno et al., 2009). Down-regulation of IFN-stimulated genes has been previously described in patients with metastatic melanoma (Critchley-Thorne et al., 2007), and importantly, changes in type I/II IFN signaling were shown to be involved in CD8 and CD4 T cell exhaustion (Ou et al., 2001; Crawford et al., 2014), which is a dysfunctional state of chronic antigen exposure in the setting of a pro-inflammatory tumor microenvironment or protracted viral infection (Baitsch et al., 2011; Wherry and Kurachi, 2015). T cell exhaustion gene signatures in the context of chronic viral exposure were well defined in distinct subsets of CD8 and CD4 effector and memory T cell populations (Crawford et al., 2014; Wherry et al., 2007; Doering et al., 2012). We have also observed that IFN-related pathways are enriched for positive association with CTLA-4 protein expression in lymphocytes (Fig. 9 A). While the exact nature of the relationship between IFN pathway genes and bad outcomes in our trial is unclear, we hypothesize that the IFN/TRAF6-IRF7 gene sets up-regulated in the bad clinical outcome groups may be related to the molecular signatures of the T cell exhaustion phenotype. Relevant to these gene expression results, the complexity associated with type I/II IFN signaling in the context of checkpoint therapy resistance and immunosuppression in metastatic melanoma has been recently demonstrated (Benci et al., 2016; Garcia-Diaz et al., 2017). Similar to the exhaustion associated with prolonged antigen exposure, chronic IFN signaling contributes to epigenetic reprograming of tumor cells, leading to up-regulation of inhibitory T cell ligands PD-L1 and PD-L2 on tumor and immune cells, which leads to suppression of immune surveillance and tumor progression after anti–PD-1 therapy (Benci et al., 2016; Garcia-Diaz et al., 2017). Therefore, we further surveyed our gene expression data for differences in T cell exhaustion signatures in baseline and postvaccine lymphocyte samples using the Molecular Signature Database (MSigDB) C7 immunological gene database (Fig. S5, B and C). We found that differentially expressed genes between the two outcome groups showed enrichments in several gene sets defined by contrasting exhausted CD8 T cells with other T cell subsets. The good outcome group showed enrichments for genes that are highly expressed in effector and memory CD8 T cells in contrast to exhausted T cells (Fig. S5, B–D). While it is difficult to attribute a clear exhaustion phenotype to either outcome category, it is important to ask whether the increased expression of effector/memory genes in lymphocytes may correlate with better MA responses and better clinical outcomes in patients. We also note that our analyses considered virally induced T cell exhaustion signatures, which may not fully represent changes associated with tumor-induced exhaustion and that the gene panels used here do not include a comprehensive probe set of exhaustion molecules. Future studies using FACS-based single-cell targeted technology may more precisely characterize the relationships between T cell activation and exhaustion profiles in the MA-specific T cells from distinct patient outcome groups.
In summary, our examination of lymphocyte and tumor gene and protein expression changes from baseline to 1 mo after vaccine confirmed that both immune checkpoint signaling pathways and IFN response gene networks play important roles in the response to cancer vaccines. These data, combined with the checkpoint blockade schedule effects, suggest potential future combination trials.
Materials and methods
Clinical trial and patient samples
A phase 1 single-site study was performed to evaluate the immunological effects of autologous monocyte-derived DCs transduced with tyrosinase, MART-1, and MAGE-A6 genes (by replication-defective AdV AdVTMM2) in 35 subjects with recurrent, unresectable stage III or IV melanoma (Butterfield et al., 2019). The clinical trial reported was fully approved by the University of Pittsburgh protocol review committee and institutional review board (PRO12010416, #UPCI09–021) and had Food and Drug Administration investigational new drug #15044 and NCT01622933 (clinical data finalized April 2018). All patients and donors provided informed consent (Butterfield et al., 2019). Monocytes and lymphocytes were isolated by elutriation of the leukapheresis from each patient. The monocyte fraction was plated and differentiated into DCs with GM-CSF+IL-4 for 5 d, then matured by the addition of IFN-γ+LPS overnight. Patient vaccines were prepared by harvesting matured DCs and transducing them with AdVTMM2. Cells from baseline and after DC vaccination at d43 and after observation or 1 mo of high-dose IFN-α (d89 or 101, hereafter “89”) were cryopreserved in 50% RPMI (Gibco), 40% human AB serum, and 10% DMSO (Sigma-Aldrich). HD blood samples were used as controls and obtained by venipuncture under informed consent (UPCI #04-001). HD PBMCs were purified by Ficoll gradient centrifugation and either used immediately or cryopreserved as above until use. All thawed specimens were >80% viable upon thaw. Peripheral blood flow cytometry was described previously (Butterfield et al., 2019).
Of the 35 patients who were vaccinated, 31 had ELISPOT data for PBMCs from both d0 and d43 (this testing of total PBMCs was used to check for balance in T cell responses between the observation and IFN-α trial arms); four patients progressed before collection of the d43 blood sample. 28 patients had data available from the second ELISPOT assay (testing purified CD4+ and CD8+ subsets), which was performed using samples from all three time points, but only 20 of 28 had d89 specimens due to progression (Butterfield et al., 2019). Patients were only excluded from a particular analysis if there were no specimens available or if they were not able to be tested in the assay (the MHC dextramer analysis used a reagent based on the HLA-A*0201 allele and was only performed for HLA-A2+ patients).
IFN-γ ELISPOT assays
MA-specific T cell responses were examined using total PBMCs at baseline and d43 to test responses to autologous DCs (10 T cells to each DC) transduced with individual antigens AdVTyrosinase, AdVMART1, AdVMAGEA6, AdVLacZ (for the AdV vector backbone response), and controls (Butterfield et al., 2019). Additional ELISPOT assays were performed on purified CD4+ and CD8+ T cells and included responses in HLA-A2+ patients to immunodominant peptides on T2 cells. To quantify specific responses to the melanoma-associated antigens (MA), the AdVLacZ response was subtracted from the AdV-MA response, and positivity was defined as >10 spots counted per well and at least a twofold increase over baseline.
Antibodies, dextramers, and flow cytometry analysis
Antigen-specific CD8 T cells from HLA-A2+ patients were identified using dextramers displaying tyrosinase368–376, MAGE-A6271–279, MART127–35, and influenza (FluM158–66) per manufacturer’s instructions (Immudex). The lower limit of detection was not determined, but frequencies and increases ≥0.003 were counted as positive. Checkpoint expression on CD8 T cells was examined using the following fluorochrome-conjugated antibodies: CD3 (UCHT1), CD8 (SK1), CD56 (NCAM16), CTLA-4 (BNI3), PD-1 (EH12; BD Biosciences), LAG3 (11C3C65; Biolegend), and TIM3 (F38-2E2; Thermo Fisher Scientific). DAPI (Molecular Probes; Invitrogen) was used as a viability dye for dead cell exclusion. FACS analyses were performed using the BD LSR Fortessa II (BD Biosciences), and data were analyzed using FlowJo v10 software.
In vitro co-cultures and intracellular cytokine assay
Monocytes were thawed and cultured for 5 d in AIMV (Gibco) supplemented with 2% human AB serum, 800 U/ml GM-CSF (Sanofi), and 500 U/ml IL4 (Gemini Bio-Products) to generate DCs. DCs were matured on day 6 with 1,000 U/ml IFN-γ (Peprotech) and 250 ng/ml LPS (Sigma-Aldrich). For the first round of stimulation, DCs were collected and transduced with AdVMART1 at 1,000 multiplicities of infection (MOI) for 3–4 h in serum-free AIMV (Butterfield et al., 1998). After transduction, DCs were washed and co-cultured with CD8 enriched T cells using magnetic separation with CD8 microbeads (Miltenyi Biotec). After 8 d, cultured T cells were collected and restimulated with a new batch of DCs transduced with AdVMART1 at 500 MOI with or without Ad5.hPD1Ab (Garcia-Bates et al., 2016) at 2,000 MOI. Cells were collected after 7 d in culture for analyses of checkpoint molecules and MART127–35–specific T cells as described previously. An aliquot of cells from the in vitro cultures was used and stimulated with MART127–35 peptide-pulsed T2 or Mel526 cells in the presence of 10 µg/ml Brefeldin A (Sigma-Aldrich). After 5 h, cells were stained with CD3 (SK7), CD8 (RPA-T8), CD69 (FN50), and CD107a (H4A3; BD Biosciences) and were fixed with 1.5% paraformaldehyde (eBioscience) and subsequently exposed to 1× permeabilization buffer (eBioscience) before intracellular staining with IFN-γ (B27) and TNF-α (Mab11; BD Biosciences).
Multiplex gene expression analysis
Total RNA isolated from circulating lymphocytes and patient tumor biopsies (Table S4) was isolated as described previously (Vujanovic et al., 2019). The NanoString nCounter platform was used for targeted mRNA and protein expression analyses. The NanoString PanCancer Immune Profiling (770 genes) and CAR-T Characterization (780 genes) panels were used to profile gene expression in circulating lymphocytes, and the NanoString PanCancer Progression panel (770 genes plus 30 custom targets) was used for profiling of optimal cutting temperature–embedded melanoma tumor samples. The expression of 30 target proteins was analyzed using the Vantage 3D Protein Solid Tumor Panel. Raw protein count data were preprocessed by applying background thresholding and content normalization in NanoString nSolver 4.0. For gene expression analysis, the R package NanoStringNorm (Waggott et al., 2012; version 1.2.1) was used for preprocessing of the raw count data (background subtraction and normalization to housekeeping genes). Differential gene expression was analyzed using limma (version 3.38.3) with weights generated by the voom function (Law et al., 2014; Ritchie et al., 2015). A log2 fold change of two and P value threshold of 0.05 were used to determine statistical significance. For outcome-based comparisons, samples were grouped into two clinical outcome categories: good (SD, NED1 [recurrence >18 mo], PR) and bad (PD, NED2 [recurrence <18 mo]). GSEA was conducted using gene sets from the MSigDB (version 6.2) in the C2 curated gene category (2005, PNAS 102, 15545–15550). Plots were generated using the R package ggplot2 (version 3.1.1) and the javaGSEA application (version 3.0; all NanoString panels are for research use only, not for use in diagnostic procedures). Patients’ banked specimens were prioritized for this analysis based on tumor specimen availability and the availability of multiple blood samples that were matched to tumor time points and obtained from elutriated leukapheresis (and not processed as Ficolled PBMCs from patients who may have refused the second or third requested leukapheresis procedure) to avoid any impact of sample processing methods on the analysis.
Serum Luminex
The Human Checkpoint 14-plex kit (Procarta Plex; Thermo Fisher Scientific) was used for detection of serum checkpoint and costimulatory molecules (Butterfield et al., 2019).
Statistical analysis
Statistical comparisons between groups were performed using the Wilcoxon rank sum test, Wilcoxon signed rank test, Welch’s t test, paired-sample t tests, or linear mixed effect models, as indicated in figure legends. P values are represented as *, P ≤ 0.05, **, P ≤ 0.01, ***, P ≤ 0.001, and ****, P ≤ 0.0001. P values <0.05 were considered statistically significant. The Shapiro-Wilk test was used to assess data normality, and statistical tests were performed using R (version 3.6.1). Figure graphs were generated using the R package ggplot2 (version 3.1.1). Kaplan-Meier survival curve analysis and Cox proportional-hazards modeling were performed using the R packages survival (version 3.1–8) and survminer (version 0.4.6). Standardized effect sizes were computed using the R package effsize (0.7.6), and equivalence testing was performed using the equivalence package (version 0.7.2).
Online supplemental material
Fig. S1 shows associations of MA expression levels in the DC vaccines with survival time and clinical responses. Fig. S2 shows post-trial assessment of MA-specific CD8 T cells from two HLA-A2+ patients 1.5–2 yr after DC vaccination. Fig. S3 shows immune checkpoint profiling in circulating lymphocytes and Luminex immune checkpoint profiling in serum. Fig. S4 shows differential gene expression and immune checkpoint pathway associations in circulating lymphocytes and tumor/TIL samples. Fig. S5 shows differentially expressed genes in circulating lymphocytes at d0 and d43. Table S1 lists patient demographics. Table S2 lists the statistical analyses of checkpoint and exhaustion markers. Table S3 contains statistical analyses of checkpoint and exhaustion markers CTLA-4, LAG3, PD-1, and TIM3 on CD8 T cells stimulated with DC transduced with AdVMART1 and with or without Ad5.hPD1Ab in vitro. Table S4 shows circulating lymphocyte and tumor specimens from patients used for NanoString gene expression profiling. Table S5 shows a time-dependent covariate Cox regression analysis of soluble cytokines.
Supplementary Material
contains HLA-A2+ melanoma patient demographics and previous treatments.
shows a linear mixed effect model analysis of previous checkpoint therapy and MA-specific T cell responses.
contains statistical analyses of checkpoint and exhaustion markers CTLA-4, LAG3, PD-1, and TIM3 on CD8 T cells stimulated with DC transduced with AdVMART1 and with or without Ad5.hPD1Ab in vitro.
shows circulating lymphocyte and tumor specimens from patients used for NanoString gene expression profiling.
shows a time-dependent covariate Cox regression analysis of soluble cytokines.
Acknowledgments
This work was supported by research funding from the University of Pittsburgh Cancer Institute, National Cancer Institute grant P50 CA121973–03 Skin SPORE (J.M. Kirkwood; Project 2, L.H. Butterfield), and the Parker Institute for Cancer Immunotherapy. This study utilized the University of Pittsburgh Medical Center Hillman Cancer Center’s Immunological Monitoring and Cellular Products Laboratory shared facility (Director, L.H. Butterfield) and the University of Pittsburgh Cancer Institute Flow Cytometry Core Facility (Director, A.A. Donnenberg), supported in part by award P30 CA047904. We also acknowledge the Skin Biology T32 support (P.M. Santos), Cindy Sander, and the Melanoma Program.
Author contributions: Study design: P.M. Santos, J. Adamik, and L.H. Butterfield. Study conduct: P.M. Santos, J. Adamik, S. Du, L. Vujanovic, T.R. Howes, and S. Warren. Data interpretation: P.M. Santos, J. Adamik, T.R. Howes, S. Warren, and L.H. Butterfield. Key reagents, advice, and specimens: S. Warren, A. Gambotto, J.M. Kirkwood. Drafted the manuscript: P.M. Santos, J. Adamik, and L.H. Butterfield. Revised the manuscript: P.M. Santos, J. Adamik, T.R. Howes, and L.H. Butterfield. Reviewed, edited, and approved the manuscript: all authors.
References
- Anguille S., Smits E.L., Lion E., van Tendeloo V.F., and Berneman Z.N.. 2014. Clinical use of dendritic cells for cancer therapy. Lancet Oncol. 15:e257–e267. 10.1016/S1470-2045(13)70585-0 [DOI] [PubMed] [Google Scholar]
- Appleman L.J., Normolle D.P., Logan T.F., Monk P., Olencki T., McDermott D.F., Ernstoff M.S., Maranchie J.K., Parikh R.A., Friedland D., et al. . 2018. Safety and activity of hydroxychloroquine and aldesleukin in metastatic renal cell carcinoma: A cytokine working group phase II study. J. Clin. Oncol. 36(15_suppl):4573 10.1200/JCO.2018.36.15_suppl.4573 [DOI] [Google Scholar]
- Baitsch L., Baumgaertner P., Devêvre E., Raghav S.K., Legat A., Barba L., Wieckowski S., Bouzourene H., Deplancke B., Romero P., et al. . 2011. Exhaustion of tumor-specific CD8+ T cells in metastases from melanoma patients. J. Clin. Invest. 121:2350–2360. 10.1172/JCI46102 [DOI] [PMC free article] [PubMed] [Google Scholar]
- Benci J.L., Xu B., Qiu Y., Wu T.J., Dada H., Twyman-Saint Victor C., Cucolo L., Lee D.S.M., Pauken K.E., Huang A.C., et al. . 2016. Tumor Interferon Signaling Regulates a Multigenic Resistance Program to Immune Checkpoint Blockade. Cell. 167:1540–1554.e12. 10.1016/j.cell.2016.11.022 [DOI] [PMC free article] [PubMed] [Google Scholar]
- Butterfield L.H., Jilani S.M., Chakraborty N.G., Bui L.A., Ribas A., Dissette V.B., Lau R., Gamradt S.C., Glaspy J.A., McBride W.H., et al. . 1998. Generation of melanoma-specific cytotoxic T lymphocytes by dendritic cells transduced with a MART-1 adenovirus. J. Immunol. 161:5607–5613. [PubMed] [Google Scholar]
- Butterfield L.H., Vujanovic L., Santos P.M., Maurer D.M., Gambotto A., Lohr J., Li C., Waldman J., Chandran U., Lin Y., et al. . 2019. Multiple antigen-engineered DC vaccines with or without IFNα to promote antitumor immunity in melanoma. J. Immunother. Cancer. 7:113 10.1186/s40425-019-0552-x [DOI] [PMC free article] [PubMed] [Google Scholar]
- Carreno B.M., Magrini V., Becker-Hapak M., Kaabinejadian S., Hundal J., Petti A.A., Ly A., Lie W.R., Hildebrand W.H., Mardis E.R., et al. . 2015. Cancer immunotherapy. A dendritic cell vaccine increases the breadth and diversity of melanoma neoantigen-specific T cells. Science. 348:803–808. 10.1126/science.aaa3828 [DOI] [PMC free article] [PubMed] [Google Scholar]
- Chevalier N., Jarrossay D., Ho E., Avery D.T., Ma C.S., Yu D., Sallusto F., Tangye S.G., and Mackay C.R.. 2011. CXCR5 expressing human central memory CD4 T cells and their relevance for humoral immune responses. J. Immunol. 186:5556–5568. 10.4049/jimmunol.1002828 [DOI] [PubMed] [Google Scholar]
- Chiaruttini G., Mele S., Opzoomer J., Crescioli S., Ilieva K.M., Lacy K.E., and Karagiannis S.N.. 2017. B cells and the humoral response in melanoma: The overlooked players of the tumor microenvironment. OncoImmunology. 6 e1294296 10.1080/2162402X.2017.1294296 [DOI] [PMC free article] [PubMed] [Google Scholar]
- Crawford A., Angelosanto J.M., Kao C., Doering T.A., Odorizzi P.M., Barnett B.E., and Wherry E.J.. 2014. Molecular and transcriptional basis of CD4+ T cell dysfunction during chronic infection. Immunity. 40:289–302. 10.1016/j.immuni.2014.01.005 [DOI] [PMC free article] [PubMed] [Google Scholar]
- Critchley-Thorne R.J., Yan N., Nacu S., Weber J., Holmes S.P., and Lee P.P.. 2007. Down-regulation of the interferon signaling pathway in T lymphocytes from patients with metastatic melanoma. PLoS Med. 4 e176 10.1371/journal.pmed.0040176 [DOI] [PMC free article] [PubMed] [Google Scholar]
- Doering T.A., Crawford A., Angelosanto J.M., Paley M.A., Ziegler C.G., and Wherry E.J.. 2012. Network analysis reveals centrally connected genes and pathways involved in CD8+ T cell exhaustion versus memory. Immunity. 37:1130–1144. 10.1016/j.immuni.2012.08.021 [DOI] [PMC free article] [PubMed] [Google Scholar]
- Elgueta R., Benson M.J., de Vries V.C., Wasiuk A., Guo Y., and Noelle R.J.. 2009. Molecular mechanism and function of CD40/CD40L engagement in the immune system. Immunol. Rev. 229:152–172. 10.1111/j.1600-065X.2009.00782.x [DOI] [PMC free article] [PubMed] [Google Scholar]
- Feun L.G., Li Y.Y., Wu C., Wangpaichitr M., Jones P.D., Richman S.P., Madrazo B., Kwon D., Garcia-Buitrago M., Martin P., et al. . 2019. Phase 2 study of pembrolizumab and circulating biomarkers to predict anticancer response in advanced, unresectable hepatocellular carcinoma. Cancer. 125:3603–3614. 10.1002/cncr.32339 [DOI] [PMC free article] [PubMed] [Google Scholar]
- Garcia-Bates T.M., Kim E., Concha-Benavente F., Trivedi S., Mailliard R.B., Gambotto A., and Ferris R.L.. 2016. Enhanced Cytotoxic CD8 T Cell Priming Using Dendritic Cell-Expressing Human Papillomavirus-16 E6/E7-p16INK4 Fusion Protein with Sequenced Anti-Programmed Death-1. J. Immunol. 196:2870–2878. 10.4049/jimmunol.1502027 [DOI] [PMC free article] [PubMed] [Google Scholar]
- Garcia-Diaz A., Shin D.S., Moreno B.H., Saco J., Escuin-Ordinas H., Rodriguez G.A., Zaretsky J.M., Sun L., Hugo W., Wang X., et al. . 2017. Interferon Receptor Signaling Pathways Regulating PD-L1 and PD-L2 Expression. Cell Rep. 19:1189–1201. 10.1016/j.celrep.2017.04.031 [DOI] [PMC free article] [PubMed] [Google Scholar]
- Gross S., Erdmann M., Haendle I., Voland S., Berger T., Schultz E., Strasser E., Dankerl P., Janka R., Schliep S., et al. . 2017. Twelve-year survival and immune correlates in dendritic cell-vaccinated melanoma patients. JCI Insight. 2 e91438 10.1172/jci.insight.91438 [DOI] [PMC free article] [PubMed] [Google Scholar]
- Hobo W., Strobbe L., Maas F., Fredrix H., Greupink-Draaisma A., Esendam B., de Witte T., Preijers F., Levenga H., van Rees B., et al. . 2013. Immunogenicity of dendritic cells pulsed with MAGE3, Survivin and B-cell maturation antigen mRNA for vaccination of multiple myeloma patients. Cancer Immunol. Immunother. 62:1381–1392. 10.1007/s00262-013-1438-2 [DOI] [PMC free article] [PubMed] [Google Scholar]
- Hu H., Rudd C.E., and Schneider H.. 2001. Src kinases Fyn and Lck facilitate the accumulation of phosphorylated CTLA-4 and its association with PI-3 kinase in intracellular compartments of T-cells. Biochem. Biophys. Res. Commun. 288:573–578. 10.1006/bbrc.2001.5814 [DOI] [PubMed] [Google Scholar]
- Jacquelot N., Enot D.P., Flament C., Vimond N., Blattner C., Pitt J.M., Yamazaki T., Roberti M.P., Daillère R., Vétizou M., et al. . 2016. Chemokine receptor patterns in lymphocytes mirror metastatic spreading in melanoma. J. Clin. Invest. 126:921–937. 10.1172/JCI80071 [DOI] [PMC free article] [PubMed] [Google Scholar]
- Konno H., Yamamoto T., Yamazaki K., Gohda J., Akiyama T., Semba K., Goto H., Kato A., Yujiri T., Imai T., et al. . 2009. TRAF6 establishes innate immune responses by activating NF-kappaB and IRF7 upon sensing cytosolic viral RNA and DNA. PLoS One. 4 e5674 10.1371/journal.pone.0005674 [DOI] [PMC free article] [PubMed] [Google Scholar]
- Larkin J., Chiarion-Sileni V., Gonzalez R., Grob J.J., Cowey C.L., Lao C.D., Schadendorf D., Dummer R., Smylie M., Rutkowski P., et al. . 2015. Combined Nivolumab and Ipilimumab or Monotherapy in Untreated Melanoma. N. Engl. J. Med. 373:23–34. 10.1056/NEJMoa1504030 [DOI] [PMC free article] [PubMed] [Google Scholar]
- Law C.W., Chen Y., Shi W., and Smyth G.K.. 2014. voom: Precision weights unlock linear model analysis tools for RNA-seq read counts. Genome Biol. 15:R29 10.1186/gb-2014-15-2-r29 [DOI] [PMC free article] [PubMed] [Google Scholar]
- Levin N., Weinstein-Marom H., Pato A., Itzhaki O., Besser M.J., Eisenberg G., Peretz T., Lotem M., and Gross G.. 2018. Potent Activation of Human T Cells by mRNA Encoding Constitutively Active CD40. J. Immunol. 201:2959–2968. 10.4049/jimmunol.1701725 [DOI] [PubMed] [Google Scholar]
- Miyatake S., Nakaseko C., Umemori H., Yamamoto T., and Saito T.. 1998. Src family tyrosine kinases associate with and phosphorylate CTLA-4 (CD152). Biochem. Biophys. Res. Commun. 249:444–448. 10.1006/bbrc.1998.9191 [DOI] [PubMed] [Google Scholar]
- Ou R., Zhou S., Huang L., and Moskophidis D.. 2001. Critical role for alpha/beta and gamma interferons in persistence of lymphocytic choriomeningitis virus by clonal exhaustion of cytotoxic T cells. J. Virol. 75:8407–8423. 10.1128/JVI.75.18.8407-8423.2001 [DOI] [PMC free article] [PubMed] [Google Scholar]
- Palucka K., and Banchereau J.. 2013. Dendritic-cell-based therapeutic cancer vaccines. Immunity. 39:38–48. 10.1016/j.immuni.2013.07.004 [DOI] [PMC free article] [PubMed] [Google Scholar]
- Ritchie M.E., Phipson B., Wu D., Hu Y., Law C.W., Shi W., and Smyth G.K.. 2015. limma powers differential expression analyses for RNA-sequencing and microarray studies. Nucleic Acids Res. 43 e47 10.1093/nar/gkv007 [DOI] [PMC free article] [PubMed] [Google Scholar]
- Ross S.H., and Cantrell D.A.. 2018. Signaling and Function of Interleukin-2 in T Lymphocytes. Annu. Rev. Immunol. 36:411–433. 10.1146/annurev-immunol-042617-053352 [DOI] [PMC free article] [PubMed] [Google Scholar]
- Rudd C.E., Taylor A., and Schneider H.. 2009. CD28 and CTLA-4 coreceptor expression and signal transduction. Immunol. Rev. 229:12–26. 10.1111/j.1600-065X.2009.00770.x [DOI] [PMC free article] [PubMed] [Google Scholar]
- Santos P.M., and Butterfield L.H.. 2018. Dendritic Cell-Based Cancer Vaccines. J. Immunol. 200:443–449. 10.4049/jimmunol.1701024 [DOI] [PMC free article] [PubMed] [Google Scholar]
- Sharma P., Hu-Lieskovan S., Wargo J.A., and Ribas A.. 2017. Primary, Adaptive, and Acquired Resistance to Cancer Immunotherapy. Cell. 168:707–723. 10.1016/j.cell.2017.01.017 [DOI] [PMC free article] [PubMed] [Google Scholar]
- Shimizu K., Iyoda T., Okada M., Yamasaki S., and Fujii S.I.. 2018. Immune suppression and reversal of the suppressive tumor microenvironment. Int. Immunol. 30:445–454. 10.1093/intimm/dxy042 [DOI] [PubMed] [Google Scholar]
- Siegel R.L., Miller K.D., and Jemal A.. 2019. Cancer statistics, 2019. CA Cancer J. Clin. 69:7–34. 10.3322/caac.21551 [DOI] [PubMed] [Google Scholar]
- Van den Bergh J.M.J., Smits E.L.J.M., Berneman Z.N., Hutten T.J.A., De Reu H., Van Tendeloo V.F.I., Dolstra H., Lion E., and Hobo W.. 2017. Monocyte-Derived Dendritic Cells with Silenced PD-1 Ligands and Transpresenting Interleukin-15 Stimulate Strong Tumor-Reactive T-cell Expansion. Cancer Immunol. Res. 5:710–715. 10.1158/2326-6066.CIR-16-0336 [DOI] [PubMed] [Google Scholar]
- van der Burg S.H., Arens R., Ossendorp F., van Hall T., and Melief C.J.. 2016. Vaccines for established cancer: overcoming the challenges posed by immune evasion. Nat. Rev. Cancer. 16:219–233. 10.1038/nrc.2016.16 [DOI] [PubMed] [Google Scholar]
- Vujanovic L., Chuckran C., Lin Y., Ding F., Sander C.A., Santos P.M., Lohr J., Mashadi-Hossein A., Warren S., White A., et al. . 2019. CD56dim CD16- Natural Killer Cell Profiling in Melanoma Patients Receiving a Cancer Vaccine and Interferon-α. Front. Immunol. 10:14 10.3389/fimmu.2019.00014 [DOI] [PMC free article] [PubMed] [Google Scholar]
- Waggott D., Chu K., Yin S., Wouters B.G., Liu F.F., and Boutros P.C.. 2012. NanoStringNorm: an extensible R package for the pre-processing of NanoString mRNA and miRNA data. Bioinformatics. 28:1546–1548. 10.1093/bioinformatics/bts188 [DOI] [PMC free article] [PubMed] [Google Scholar]
- Wang X., Zhao X., Feng C., Weinstein A., Xia R., Wen W., Lv Q., Zuo S., Tang P., Yang X., et al. . 2015. IL-36γ Transforms the Tumor Microenvironment and Promotes Type 1 Lymphocyte-Mediated Antitumor Immune Responses. Cancer Cell. 28:296–306. 10.1016/j.ccell.2015.07.014 [DOI] [PMC free article] [PubMed] [Google Scholar]
- Wei S.C., Duffy C.R., and Allison J.P.. 2018. Fundamental Mechanisms of Immune Checkpoint Blockade Therapy. Cancer Discov. 8:1069–1086. 10.1158/2159-8290.CD-18-0367 [DOI] [PubMed] [Google Scholar]
- Weinstein A.M., Chen L., Brzana E.A., Patil P.R., Taylor J.L., Fabian K.L., Wallace C.T., Jones S.D., Watkins S.C., Lu B., et al. . 2017. Tbet and IL-36γ cooperate in therapeutic DC-mediated promotion of ectopic lymphoid organogenesis in the tumor microenvironment. OncoImmunology. 6 e1322238 10.1080/2162402X.2017.1322238 [DOI] [PMC free article] [PubMed] [Google Scholar]
- Wherry E.J., and Kurachi M.. 2015. Molecular and cellular insights into T cell exhaustion. Nat. Rev. Immunol. 15:486–499. 10.1038/nri3862 [DOI] [PMC free article] [PubMed] [Google Scholar]
- Wherry E.J., Ha S.J., Kaech S.M., Haining W.N., Sarkar S., Kalia V., Subramaniam S., Blattman J.N., Barber D.L., and Ahmed R.. 2007. Molecular signature of CD8+ T cell exhaustion during chronic viral infection. Immunity. 27:670–684. 10.1016/j.immuni.2007.09.006 [DOI] [PubMed] [Google Scholar]
- Wilgenhof S., Corthals J., Heirman C., van Baren N., Lucas S., Kvistborg P., Thielemans K., and Neyns B.. 2016. Phase II Study of Autologous Monocyte-Derived mRNA Electroporated Dendritic Cells (TriMixDC-MEL) Plus Ipilimumab in Patients With Pretreated Advanced Melanoma. J. Clin. Oncol. 34:1330–1338. 10.1200/JCO.2015.63.4121 [DOI] [PubMed] [Google Scholar]
- Yu N., Li X., Song W., Li D., Yu D., Zeng X., Li M., Leng X., and Li X.. 2012. CD4(+)CD25 (+)CD127 (low/-) T cells: a more specific Treg population in human peripheral blood. Inflammation. 35:1773–1780. 10.1007/s10753-012-9496-8 [DOI] [PubMed] [Google Scholar]
- Zhang M., Graor H., Yan L., and Kim J.. 2016. Identification of Melanoma-reactive CD4+ T-Cell Subsets From Human Melanoma Draining Lymph Nodes. J. Immunother. 39:15–26. 10.1097/CJI.0000000000000103 [DOI] [PMC free article] [PubMed] [Google Scholar]
- Zhou J., Mahoney K.M., Giobbie-Hurder A., Zhao F., Lee S., Liao X., Rodig S., Li J., Wu X., Butterfield L.H., et al. . 2017. Soluble PD-L1 as a Biomarker in Malignant Melanoma Treated with Checkpoint Blockade. Cancer Immunol. Res. 5:480–492. 10.1158/2326-6066.CIR-16-0329 [DOI] [PMC free article] [PubMed] [Google Scholar]
- Zhu X., and Lang J.. 2017. Soluble PD-1 and PD-L1: predictive and prognostic significance in cancer. Oncotarget. 8:97671–97682. 10.18632/oncotarget.18311 [DOI] [PMC free article] [PubMed] [Google Scholar]
Associated Data
This section collects any data citations, data availability statements, or supplementary materials included in this article.
Supplementary Materials
contains HLA-A2+ melanoma patient demographics and previous treatments.
shows a linear mixed effect model analysis of previous checkpoint therapy and MA-specific T cell responses.
contains statistical analyses of checkpoint and exhaustion markers CTLA-4, LAG3, PD-1, and TIM3 on CD8 T cells stimulated with DC transduced with AdVMART1 and with or without Ad5.hPD1Ab in vitro.
shows circulating lymphocyte and tumor specimens from patients used for NanoString gene expression profiling.
shows a time-dependent covariate Cox regression analysis of soluble cytokines.


