Human GTP-specific succinyl-CoA synthetase was produced, purified and crystallized from a solution containing tartrate and CoA. The crystal structure shows tartryl-CoA bound to the enzyme at 1.52 Å resolution.
Keywords: thioesters, catalysis, tricarboxylic acid cycle, succinyl-CoA synthetase
Abstract
Succinyl-CoA synthetase (SCS) catalyzes the only substrate-level phosphorylation step in the tricarboxylic acid cycle. Human GTP-specific SCS (GTPSCS), an αβ-heterodimer, was produced in Escherichia coli. The purified protein crystallized from a solution containing tartrate, CoA and magnesium chloride, and a crystal diffracted to 1.52 Å resolution. Tartryl-CoA was discovered to be bound to GTPSCS. The CoA portion lies in the amino-terminal domain of the α-subunit and the tartryl end extends towards the catalytic histidine residue. The terminal carboxylate binds to the phosphate-binding site of GTPSCS.
1. Introduction
Succinyl-CoA synthetase (SCS) catalyzes the only substrate-level phosphorylation in the tricarboxylic acid cycle. The reversible reaction occurs in the presence of magnesium ions:
The nucleotides NDP and NTP can be ADP and ATP or GDP and GTP (Sanadi et al., 1956 ▸). SCS utilizes either nucleotide in species such as Escherichia coli and Thermus aquaticus. However, E. coli SCS prefers ADP/ATP (Joyce et al., 1999 ▸), while T. aquaticus SCS prefers GDP/GTP (Joyce et al., 2012 ▸). In mammals, SCS is a mitochondrial enzyme and is an α,β-heterodimer with different isoforms: ATP-specific SCS (ATPSCS) and GTP-specific SCS (GTPSCS). These isoforms share the same α-subunit but have different β-subunits, which determine the nucleotide specificity (Johnson et al., 1998 ▸).
Structural studies of complexes with SCS revealed the substrate-binding sites. The nucleotide-binding site lies in the ATP-grasp fold of the amino-terminal domain of the β-subunit (Joyce et al., 2000 ▸; Fraser et al., 2006 ▸). This domain adopts ‘open’ and ‘closed’ conformations, closing when nucleotide is bound. The CoA-binding site lies in the amino-terminal domain of the α-subunit, with the thioester portion of CoA extending towards the active-site histidine residue (Wolodko et al., 1994 ▸; Huang et al., 2015 ▸). The phosphate-binding site is close to the active-site histidine residue at the interface between the α-subunit and β-subunit (Fraser et al., 2000 ▸). The succinate-binding site lies in the carboxy-terminal domain of the β-subunit, with a magnesium ion playing an essential role in binding succinate since it interacts with one carboxylate O atom of succinate, the phosphate ion and four water molecules (Huang & Fraser, 2016 ▸). The active-site histidine residue is phosphorylated during catalysis, and the phosphohistidine loop has been proposed to shuttle between the succinyl-CoA- and phosphate-binding site and the nucleotide-binding site to transfer the phosphoryl group (Fraser et al., 1999 ▸). The phosphohistidine loop has been observed with the active-site histidine residue in the nucleotide-binding site in the structures of the related enzymes acetyl-CoA synthetase (Weisse et al., 2016 ▸) and ATP-citrate lyase (Verschueren et al., 2019 ▸).
SCS has been reported to utilize certain succinate analogues to produce the corresponding CoA thioesters. The formation of itaconyl-CoA from itaconate was detected decades ago (Adler et al., 1957 ▸). Schurmann and coworkers revealed that SCS from Advenella mimigardefordensis strain DPN7T is able to use 3-sulfinopropionate (3SP) to produce 3SP-CoA to complete the degradation of 3,3′-dithiodipropionic acid (Schürmann et al., 2011 ▸). In addition, SCSs from A. mimigardefordensis strain DPN7T, E. coli BL21 and Alcanivorax borkumensis SK2 catalyze the formation of CoA thioesters of itaconate, 3SP, l-malate, d-malate, fumarate and glutarate in vitro (Nolte et al., 2014 ▸). However, Nolte and coworkers pointed out that there is no evidence showing the utilization of tartrate to produce tartryl-CoA. In our work, tartryl-CoA has been discovered to be bound to human GTPSCS in a crystal that diffracted to 1.52 Å resolution. Instead of binding in the succinate-binding site, the carboxylate of tartryl-CoA occupies the phosphate-binding site. Tartryl-CoA is an inhibitor, inactivating the enzyme after a single turnover.
2. Materials and methods
2.1. Protein production
The two genes encoding the mature forms of the α-subunit and β-subunit of human GTPSCS were cloned into the pET-42b(+) vector for expression in E. coli strain BL21(DE3). The gene encoding the α-subunit was cloned from the expression system used to produce human ATP-specific SCS (Bishop et al., 2012 ▸), so that the amino-acid sequence of the mature α-subunit begins with MSYTAS and ends with EKRKMLEH8 (UniProt ID P53597). The cDNA sequence for the β-subunit was obtained from GenBank (BC047024.1) and was edited to remove the codons for the amino-terminal signal sequence. The codon for the amino-terminal leucine residue of the mature form was replaced by the start codon, so that the amino-acid sequence of the mature β-subunit begins with MNLQEY and ends with SVAKK (UniProt ID Q96I99). This designed gene was synthesized by Invitrogen (Thermal Fisher Scientific) without optimization of the codons. The modified genes were cloned into the expression vector pET-42b(+), with the gene encoding the β-subunit preceding the gene encoding the α-subunit. The vector has only one T7 promoter located upstream of the genes, but has two ribosome-binding sites, one preceding each gene. The sequence of the plasmid from the T7 promoter to the stop codon for the α-subunit was verified at the University Core DNA Service, University of Calgary.
To produce the protein, E. coli BL21(DE3) cells were transformed with the plasmid and a single colony was picked from the transformation plate to inoculate 50 ml Luria Broth Base (Invitrogen) containing 30 µg ml−1 kanamycin. The culture was grown at 37°C with shaking at 225 rev min−1 overnight. 25 ml of the overnight culture was transferred into 500 ml Terrific Broth (TB; 6 g tryptone, 12 g yeast extract, 2 ml glycerol, 1.16 g KH2PO4, 6.27 g K2HPO4 per 500 ml) containing 30 µg ml−1 kanamycin. The TB culture was grown at 37°C with shaking at 225 rev min−1 until the optical density at 600 nm reached 1.6–2.0. For the production of protein, 0.1 mM isopropyl β-d-1-thiogalactopyranoside was added and the incubation temperature was lowered to 18°C. The cells were harvested the next day by centrifugation in an SLA-3000 rotor (Sorvall) for 30 min at 5000 rev min−1 and 4°C. After removing the supernatant, the wet cells were collected and stored at −80°C for future use. Macromolecule-production information is given in Table 1 ▸.
Table 1. Macromolecule-production information.
| Source organism | Human |
| Expression vector | pET-42b(+) |
| Expression host | E. coli BL21(DE3) |
| Complete amino-acid sequence of the construct produced | MSYTASRQHLYVDKNTKIICQGFTGKQGTFHSQQALEYGTKLVGGTTPGKGGQTHLGLPVFNTVKEAKEQTGATASVIYVPPPFAAAAINEAIEAEIPLVVCITEGIPQQDMVRVKHKLRQEKTRLIGPNCPGVINPGECKIGIMPGHIHKKGRIGIVSRSGTLTYEAVHQTTQVGLGQSLCVGIGGDPFNGTDFIDCLEIFLNDSATEGIILIGEIGGNAEENAAEFLKQHNSGPNSKPVVSFIAGLTAPPGRRMGHAGAIIAGGKGGAKEKISALQSAGVVVSMSPAQLGTTIYKEFEKRKMLEHHHHHHHHMNLQEYQSKKLMSDNGVRVQRFFVADTANEALEAAKRLNAKEIVLKAQILAGGRGKGVFNSGLKGGVHLTKDPNVVGQLAKQMIGYNLATKQTPKEGVKVNKVMVAEALDISRETYLAILMDRSCNGPVLVGSPQGGVDIEEVAASNPELIFKEQIDIFEGIKDSQAQRMAENLGFVGPLKSQAADQITKLYNLFLKIDATQVEVNPFGETPEGQVVCFDAKINFDDNAEFRQKDIFAMDDKSENEPIENEAAKYDLKYIGLDGNIACFVNGAGLAMATCDIIFLNGGKPANFLDLGGGVKEAQVYQAFKLLTADPKVEAILVNIFGGIVNCAIIANGITKACRELELKVPLVVRLEGTNVQEAQKILNNSGLPITSAIDLEDAAKKAVASVAKK |
2.2. Protein purification
Protein purification to extract human GTPSCS was performed using three different columns. The E. coli cells were thawed on ice by adding 1.5 ml lysis buffer [20 mM imidazole, 50 mM potassium phosphate, 300 mM KCl, 10 mM β-mercaptoethanol (β-ME) pH 8.0] per gram of wet cells. Sonication was performed using five cycles of 30 s on and 30 s off. Soluble proteins were obtained by centrifuging the cell lysate at 12 000 rev min−1 and 4°C for 30 min using an SS-34 rotor (Sorvall). The cell-free extract was loaded onto an Ni–NTA column pre-equilibrated with binding buffer, which was the same as the lysis buffer. After washing the column with five column volumes of binding buffer, the bound proteins were eluted with five column volumes of 250 mM imidazole, 50 mM potassium phosphate, 300 mM KCl, 10 mM β-ME pH 8.0. Soluble proteins in the eluted fractions were precipitated by adding 0.5 g powdered ammonium sulfate per millitre of eluate. The precipitate was collected by centrifugation for 30 min at 10 000 rev min−1 and 4°C using an SS-34 rotor.
The binding buffer for the second column (20 mM MES pH 6.6, 10 mM β-ME) was used to redissolve the protein, and the protein solution was desalted using Sephadex G-25 (GE Healthcare) before being loaded onto a 1 ml HiTrap SP HP cation-exchange column (GE Healthcare). Bound proteins were eluted with a linear gradient of KCl by increasing the concentration in the binding buffer to 1.0 M. Eluted fractions showing a high absorbance at 280 nm were pooled for the third chromatography step.
Size-exclusion chromatography was run by injecting the pooled solution into a Superdex 200 prep-grade column (GE Healthcare) pre-equilibrated with 20 mM Tris–HCl pH 8.0, 150 mM KCl, 10 mM β-ME. Fractions with high absorbance at 280 nm were pooled and the protein purity was verified by SDS–PAGE. The protein was concentrated using Amicon Ultra-15 Centrifugal Filter Units with a nominal cutoff of 30 kDa (Millipore Sigma) and the buffer was exchanged to 10 mM Tris–HCl pH 8.0, 10 mM β-ME. The concentration of purified human GTPSCS was determined using an A 280 nm (0.1%) value of 0.255 A mg−1 cm−1 (Gasteiger et al., 2005 ▸). 20 µl aliquots were flash-frozen in thin-walled PCR tubes in liquid nitrogen and stored at −80°C.
2.3. Crystallization
Vapour diffusion from hanging drops was used to co-crystallize human GTPSCS with the ligand. The PEG/Ion screen (Hampton Research; catalog No. HR2-126) was used to discover initial conditions for crystallization. A bundle of crystals in the form of thin plates appeared in the drop two to three days after setting up the experiment. After optimizing the growth conditions, single crystals were obtained in some hanging drops, while other drops contained crystals that were large enough to be separated from the bundle. The conditions for growing crystals of this protein complex are listed in Table 2 ▸.
Table 2. Crystallization.
| Method | Hanging-drop vapour diffusion |
| Plate type | VDX |
| Temperature (K) | 294 |
| Protein concentration (mg ml−1) | 5 |
| Buffer composition of protein solution | 4.7 mM CoA, 15.8 mM MgCl2, 15.8 mM ADP, 10 mM Tris–HCl pH 8.0, 10 mM β-ME |
| Composition of reservoir solution | 17.5%(w/v) polyethylene glycol 3350, 180 mM ammonium tartrate pH 7.0, 100 mM MES pH 6.4 |
| Volume and ratio of drop | 1 µl, 1:1 |
| Volume of reservoir (ml) | 0.5 |
2.4. Data collection and processing
X-ray diffraction experiments were performed on beamline 5.0.2 at the Advanced Light Source (ALS), Berkeley, California, USA. Using cryoprotectant consisting of 20% glycerol in the mother liquor, crystals were mounted on a loop and flash-cooled in nitrogen gas at 100 K. The crystals were shipped to the ALS for remote data collection. The best-diffracting part of the crystal was determined using the raster function at the beamline. The diffraction images were processed using xia2 (Winter, 2010 ▸) and DIALS (Waterman et al., 2016 ▸; Winter et al., 2018 ▸). Information about the data collection and the statistics for the data set are presented in Table 3 ▸.
Table 3. Data collection and processing.
Values in parentheses are for the outer shell.
| Diffraction source | ALS beamline 5.0.2 |
| Wavelength (Å) | 1.00000 |
| Temperature (K) | 100 |
| Detector | PILATUS3 6M 25 Hz |
| Crystal-to-detector distance (mm) | 250 |
| Rotation range per image (°) | 0.25 |
| Total rotation range (°) | 180 |
| Exposure time per image (s) | 0.25 |
| Space group | P21 |
| a, b, c (Å) | 87.069, 82.465, 49.276 |
| α, β, γ (°) | 90.00, 102.87, 90.00 |
| Mosaicity (°) | 0.286 |
| Resolution range (Å) | 59.15–1.52 (1.54–1.52) |
| Total No. of reflections | 328718 (15697) |
| No. of unique reflections | 104120 (4997) |
| Completeness (%) | 99.6 (95.7) |
| Multiplicity | 3.2 (3.1) |
| 〈I/σ(I)〉 | 4.4 (1.7) |
| R r.i.m. | 0.100 (0.799) |
| R p.i.m. | 0.069 (0.550) |
| CC1/2 | 0.994 (0.578) |
| Overall B factor from Wilson plot (Å2) | 14.2 |
2.5. Structure solution and refinement
The structure solution was obtained by molecular replacement (McCoy et al., 2007 ▸) using the structure of succinate-bound pig GTPSCS (PDB entry 5cae; Huang & Fraser, 2016 ▸) as the model. Ideal values for the geometry of the ligand were obtained using Grade (Smart et al., 2019 ▸); four bond angles in the dictionary were later adjusted to match those obtained from the Protein Data Bank (Berman et al., 2000 ▸) using Mogul (Bruno et al., 2004 ▸) prior to the final cycle of refinement. Cycles of structure refinement and rebuilding were performed using Phenix (Liebschner et al., 2019 ▸) and Coot (Emsley et al., 2010 ▸) to achieve the final structure. The structure was analysed using tools from the CCP4 package (Winn et al., 2011 ▸) and MolProbity (Williams et al., 2018 ▸). Statistics for the final structure are presented in Table 4 ▸.
Table 4. Structure solution and refinement.
Values in parentheses are for the outer shell.
| Resolution range (Å) | 59.15–1.52 (1.54–1.52) |
| Completeness (%) | 99.54 (94.00) |
| σ Cutoff | 1.34 |
| No. of reflections, working set | 104072 (3117) |
| No. of reflections, test set | 7123 (153) |
| Final R cryst | 0.1673 (0.2982) |
| Final R free | 0.1840 (0.3367) |
| Coordinate error: maximum-likelihood (Å) | 0.14 |
| No. of non-H atoms | |
| Protein | 5311 |
| Ligand | 57 |
| Water | 617 |
| Total | 5985 |
| R.m.s. deviations from ideal values | |
| Bonds (Å) | 0.004 |
| Angles (°) | 0.756 |
| Average B factors (Å2) | |
| Protein | 22.09 |
| Ligand | 15.01 |
| Water | 31.43 |
| Ramachandran plot (%) | |
| Favoured regions | 98.71 |
| Allowed regions | 1.29 |
2.6. Enzymatic assays
Enzymatic assays were performed to determine whether tartrate could be used to replace succinate in catalysis. The reaction mixture was composed of 10 mM MgCl2, 0.1 mM CoA, 0.1 mM GTP, 100 mM Tris–HCl pH 8.0, three different concentrations (50, 100 and 150 mM) of ammonium tartrate pH 7.0 and 9.2 × 10⁻⁸ M purified GTPSCS. Assays were performed at 21°C and the formation of the thioester was measured at a wavelength of 235 nm (Cha & Parks, 1964 ▸).
3. Results and discussion
3.1. Binding of tartryl-CoA
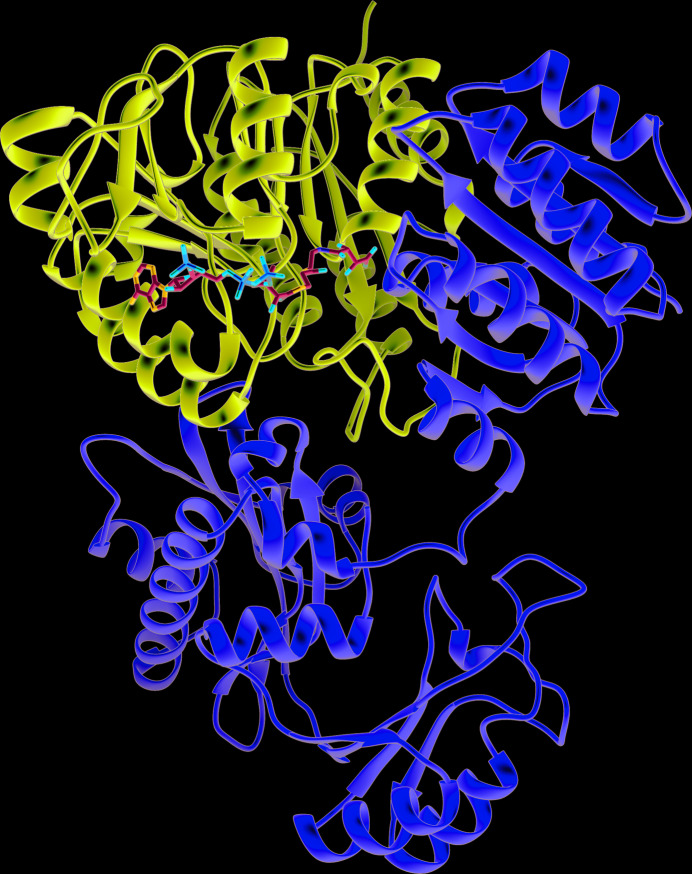
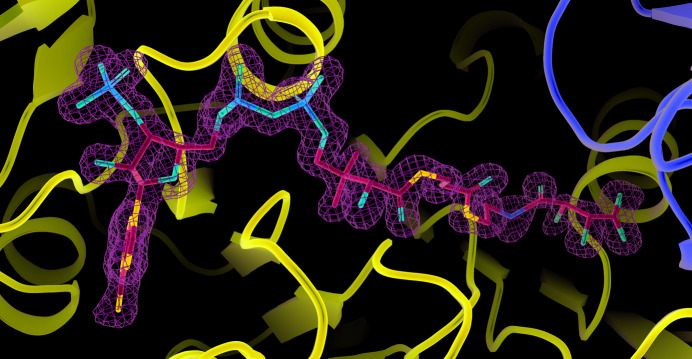
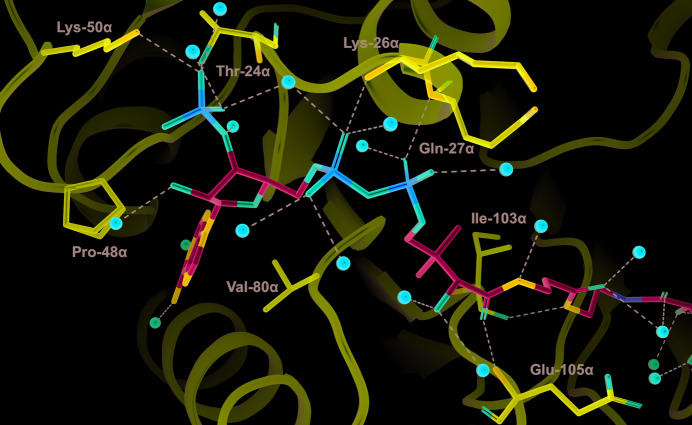
Tartryl-CoA was observed for the first time in this high-resolution structure (Fig. 1 ▸). The initial electron-density map clearly shows tartryl-CoA bound to human GTPSCS (Fig. 2 ▸). The CoA portion binds in the CoA-binding site located in the amino-terminal domain of the α-subunit, while the tartryl end extends toward His259α, the active-site histidine residue. The interactions between the CoA portion of tartryl-CoA and GTPSCS are similar to those seen in previous structures of complexes with CoA (Wolodko et al., 1994 ▸; Huang et al., 2015 ▸; Fig. 3 ▸). Thr24α, Lys26α, Gln27α, Ile103α and Glu105α of GTPSCS form hydrogen bonds to CoA, Lys50α forms a salt bridge with the 3′-phosphoryl group of CoA, and Pro48α, the adenine base of CoA and Val80α form a sandwich with hydrophobic interactions. More water molecules are observed bridging between CoA and the α-subunit in this stucture, likely owing to the high resolution of this crystal structure.
Figure 1.
Overall structure of tartryl-CoA bound to human GTPSCS. Tartryl-CoA is displayed as a stick model coloured by atom type. The α-subunit is shown in purple, while the β-subunit is shown in yellow; both are shown as ribbon diagrams. Figs. 1 ▸ and 6 ▸ were generated using UCSF Chimera (Pettersen et al., 2004 ▸).
Figure 2.
Initial electron density for tartryl-CoA. The green net represents electron density from the F o − F c map contoured at 3.0 r.m.s.d. Tartryl-CoA is displayed as a stick model coloured by atom type. In the ribbon diagram the α-subunit is in purple, while the β-subunit is in yellow. Figs. 2 ▸, 3 ▸, 4 ▸, 5 ▸ and 7 ▸ were generated using PyMOL version 2.4.0 (Schrödinger).
Figure 3.
Interactions between the CoA portion of tartryl-CoA and GTPSCS. Tartryl-CoA is displayed as a stick model coloured by atom type, with the C atoms in cyan. Interacting residues of the α-subunit are displayed as stick models with purple C atoms. Water molecules are represented by red spheres. Black dashed lines represent interactions between tartryl-CoA and the protein or water molecules. The side chain of Pro48α displays two conformations.
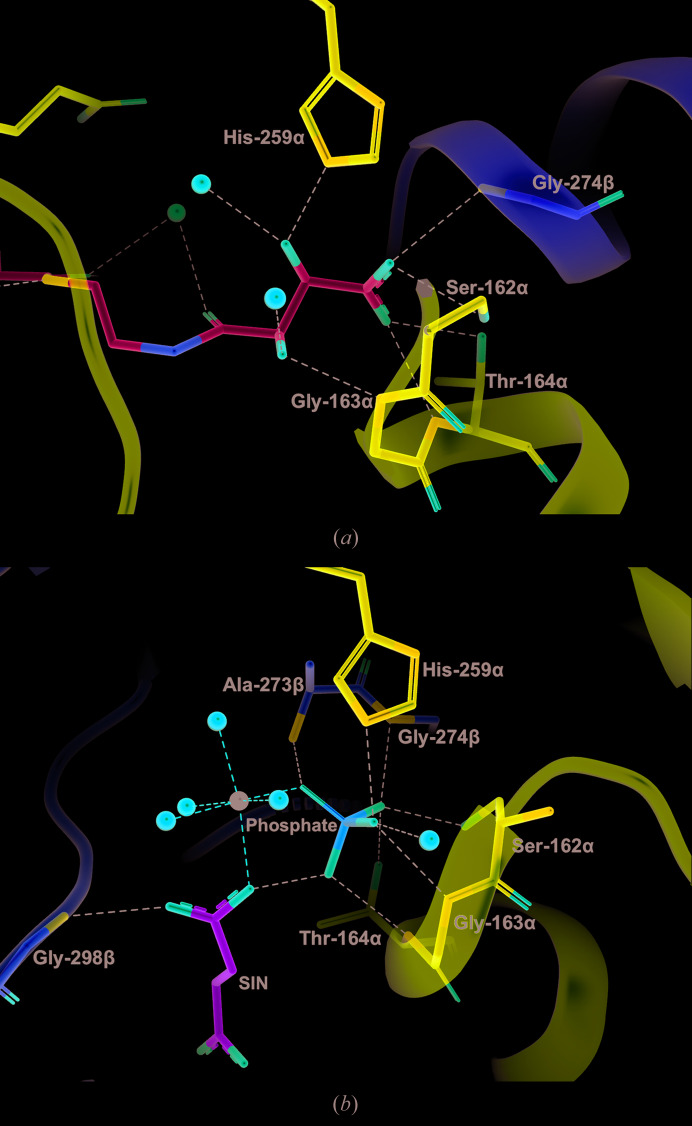
The binding site of the tartryl portion of tartryl-CoA is not as expected: the carboxylate of the tartryl portion binds in the phosphate-binding site of SCS. One O atom of the carboxylate interacts with Oγ of Ser162α and the amide N atom of Gly274β, while the other interacts with the amide N and Oγ1 atoms of Thr164α (Fig. 4 ▸). These interactions are very similar to the interactions of two of the phosphate O atoms with GTPSCS in the complex with phosphate, Mg2+-succinate and CoA (PDB entry 5cae; Huang & Fraser, 2016 ▸). The two hydroxyl groups of tartryl-CoA form interactions similar to those of the third O atom of phosphate, hydrogen-bonding to N∊ of His259α and to the amide N atom of Gly163α.
Figure 4.
Interactions between tartryl-CoA or phosphate and the phosphate-binding site of GTPSCS. (a) Tartryl-CoA and interacting residues are displayed as stick models. C atoms are shown in cyan for tartryl-CoA. (b) Phosphate, succinate and interacting residues of the protein in the structure of Mg2+-succinate-bound GTPSCS (PDB entry 5cae; Huang & Fraser, 2016 ▸) are drawn as stick models. C atoms are shown in green for succinate (abbreviated SIN). The magnesium ion is represented by a black sphere. The orientations are somewhat different to better show the substrates. For both structures, interacting residues of the α-subunit and β-subunit are shown as stick models with purple and yellow C atoms, respectively, water molecules are represented by red spheres and interactions are represented by dashed lines.
3.2. Formation of tartryl-CoA
The formation of a thioester compound requires the input of energy. SCS conserves the energy from the phosphoanhydride bond of ATP or GTP in the phosphohistidine bond. The sample of human GTPSCS must have been phosphorylated by the E. coli expression system because no protein phosphorylation was conducted in vitro. In the crystallization experiment, ammonium tartrate was used as a precipitant, while CoA, magnesium chloride and ADP were added to the protein solution. We propose that the following catalytic steps occurred to form tartryl-CoA,
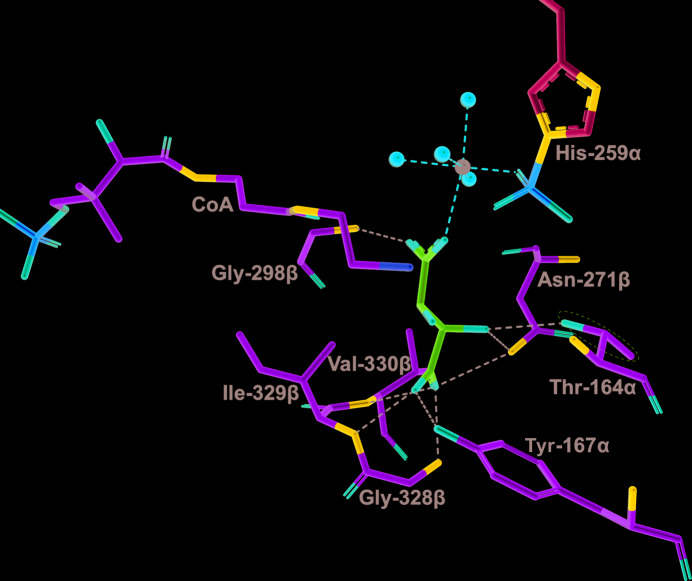
where ‘E-P’ represents the phosphorylated enzyme and ‘·’ represents noncovalent binding. It is proposed that Mg2+-tartrate binds to SCS in the the same way as Mg2+-succinate binds (Fig. 5 ▸), the phosphoryl group of phosphorylated His259α is transferred to tartrate to form tartryl-PO3, and the free thiol of CoA attacks tartryl-PO3 to produce tartryl-CoA. These catalytic steps would produce equal amounts of tartryl-CoA and inorganic phosphate. However, the electron-density map shows only tartryl-CoA bound to the enzyme (Fig. 2 ▸), with the carboxylate bound in the phosphate-binding site. After the formation of tartryl-CoA, the carboxylate portion displaced the phosphate, acting as a competitive inhibitor of the enzyme with respect to phosphate. The E·tartryl-CoA complex crystallized, while the phosphate and magnesium ions remained in solution.
Figure 5.
Modelling tartrate in the active site of GTPSCS. The model is based on the structures of Mg2+-succinate-bound GTPSCS (PDB entry 5cae; Huang & Fraser, 2016 ▸) and phosphorylated GTPSCS (PDB entry 1eud; Fraser et al., 2000 ▸). The complex with Mg2+-succinate was superposed on phosphorylated GTPSCS using 300 Cα atoms of the α-subunit (r.m.s.d. 0.309 Å). Tartrate, shown as a stick model with magenta C atoms, was superposed on succinate. The phosphorylated His259α from the structure of phosphorylated GTPSCS is shown with cyan C atoms. The other residues, CoA, water molecules and the magnesium ion are from the structure of the Mg2+-succinate complex of GTPSCS and are shown with green C atoms. The side chain of Thr164α is highlighted since a different conformation was selected in order to form a hydrogen-bonding interaction with tartrate. The magnesium ion and water molecules are represented by black and red spheres, respectively. Black and red dashed lines represent the expected interactions between tartrate and GTPSCS and the expected octahedral coordination of the magnesium ion.
The tight binding of tartryl-CoA to GTPSCS is supported by kinetic studies. When succinate was replaced by tartrate in steady-state kinetic assays, a constant absorbance was observed at the wavelength of 235 nm used to detect the formation of the thioester bond. This indicates no continuous production of the thioester compound in solution. The spectrophotometric result is consistent with the inability to detect tartryl-CoA by mass spectrometry (Nolte et al., 2014 ▸). Although the formation of tartryl-CoA in SCS cannot be detected by two different biophysical methods that rely on continuous production of tartryl-CoA, the compound has been observed in the crystal structure in a single-turnover experiment.
3.3. The succinate-binding domain
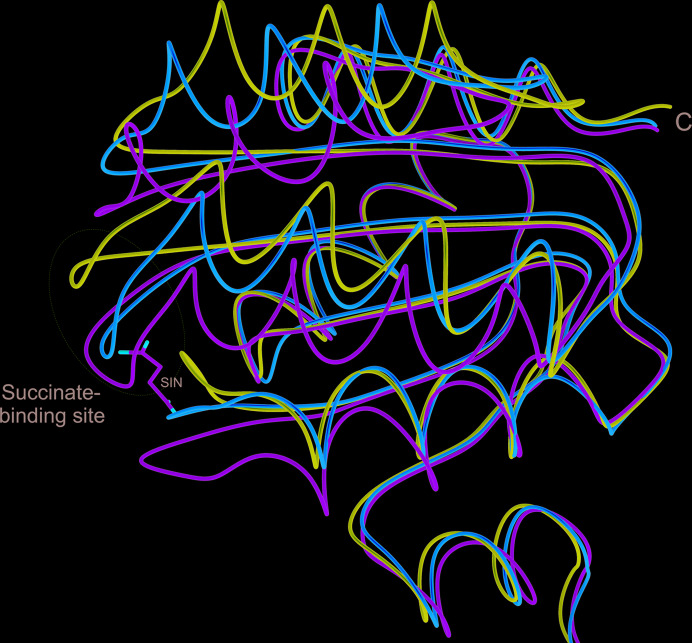
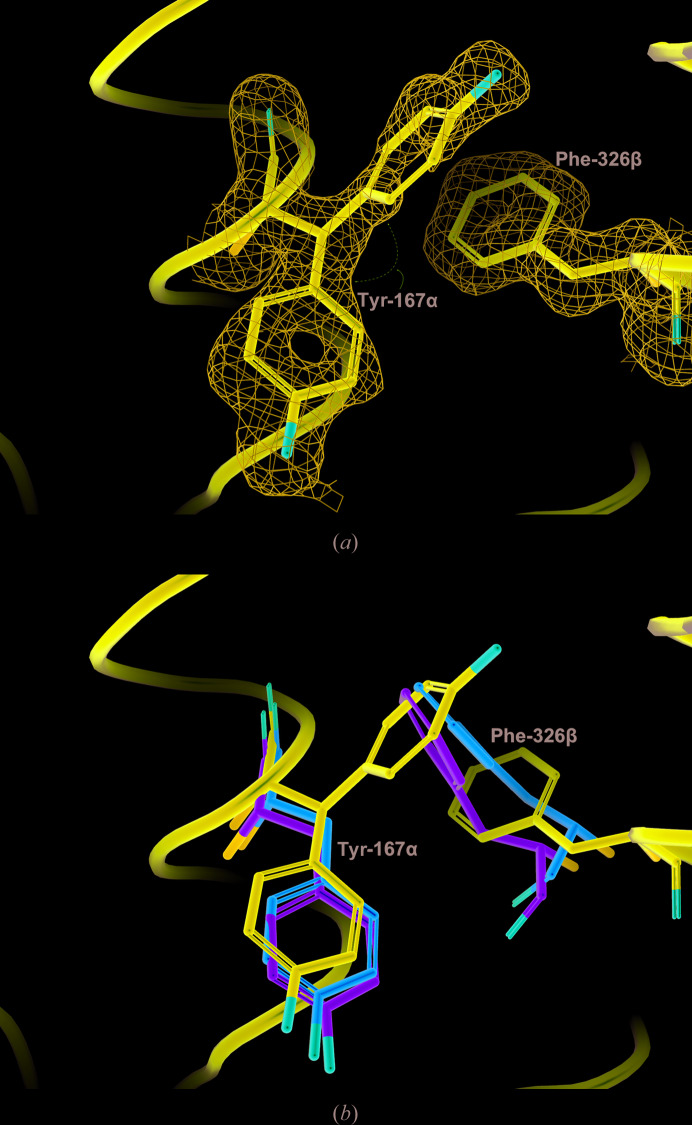
Conformational changes in the carboxy-terminal domain of the β-subunit have been observed by comparing multiple structures of GTPSCS. Structural superpositions with Mg2+-succinate-bound GTPSCS (PDB entry 5cae; Huang & Fraser, 2016 ▸) and dephosphorylated GTPSCS (PDB entry 1euc; Fraser et al., 2000 ▸) show different conformations of the segments where succinate binds (Fig. 6 ▸). Compared with dephosphorylated GTPSCS (PDB entry 1euc), the succinate-binding segment in the complex with tartryl-CoA has moved even further away from the active site. This movement is likely to be owing to conformational differences of the side chain of Phe326β (Fig. 7 ▸). By moving away from the active site, Phe326β provides space and hydrophobic interactions for an alternate conformation of the side chain of Tyr167α. When succinate binds, the hydroxyl group of Tyr167α forms a critical interaction with the carboxylate of succinate distal from the free thiol of CoA (Huang & Fraser, 2016 ▸), leading to the preference of SCS for organic acids that have two C atoms between two carboxylate groups. Once tartryl-CoA has been formed and the tartryl group has shifted to the phosphate-binding site, Tyr167α and the backbone of the succinate-binding segment adopt different conformations to those needed to bind substrate.
Figure 6.
Structural superposition of the tartryl-CoA complex, the Mg2+-succinate complex (PDB entry 5cae) and the dephosphorylated form of GTPSCS (PDB entry 1euc). Superposition of the Mg2+-succinate complex on the tartryl-CoA complex was based on 300 Cα atoms of the α-subunit that were within 1.8 Å (r.m.s.d. of 0.447 Å); superposition of the dephosphorylated form on the tartryl-CoA complex was based on 300 Cα atoms of the α-subunit that were within 1.8 Å (r.m.s.d. of 0.418 Å). The tube diagrams show the carboxy-terminal domain of the β-subunit of the tartryl-CoA complex in purple, that of the Mg2+-succinate complex in green and that of the dephosphorylated form in orange.
Figure 7.
Conformations of Tyr167α and Phe326β in GTPSCS. (a) To show the reliability of the conformation of Phe326β and the alternate conformations of Tyr167α, the 2F o − F c electron-density map for tartryl-CoA-bound GTPSCS is contoured around these residues (blue net contoured at 1.0 r.m.s.d.). (b) The tartryl-CoA complex, the Mg2+-succinate complex (PDB entry 5cae; Huang & Fraser, 2016 ▸) and the dephosphorylated form of GTPSCS (PDB entry 1euc; Fraser et al., 2000 ▸) were superposed as in Fig. 6 ▸. Only portions of the ribbon diagram of the tartryl-CoA complex are drawn in purple. The side chains of Tyr167α and Phe326β are shown as stick models with C atoms coloured purple, green and orange for the tartryl-CoA complex, the Mg2+-succinate complex and the dephosphorylated form of GTPSCS, respectively.
Succinyl-CoA would not bind to SCS in the same way as tartryl-CoA. When succinate is used as the substrate, succinyl-CoA is released, triggering the conformational change in the succinate-binding domain. Instead of being released, the tartryl portion of tartryl-CoA swings to the phosphate-binding site, forming interactions with the protein (Fig. 4 ▸ a). This must be owing to the two extra hydroxyl groups of tartryl-CoA that interact with the active-site histidine residue and the amide N atom of Gly163α.
Supplementary Material
PDB reference: succinyl-CoA synthetase, complex with tartryl-CoA, 6wcv
Acknowledgments
Diffraction data were collected at the Advanced Light Source with support from the Berkeley Center for Structural Biology. The Berkeley Center for Structural Biology is supported in part by the Howard Hughes Medical Institute. Beamline 5.0.2 of the Advanced Light Source, a US DOE Office of Science User Facility under Contract No. DE-AC02-05CH11231, is supported in part by the ALS-ENABLE program funded by the National Institutes of Health, National Institute of General Medical Sciences (grant P30 GM124169-01).
Funding Statement
This work was funded by Natural Sciences and Engineering Research Council of Canada grant 222915 to Marie Elizabeth Fraser.
References
- Adler, J., Wang, S.-F. & Lardy, H. A. (1957). J. Biol. Chem. 229, 865–879. [PubMed]
- Berman, H. M., Westbrook, J., Feng, Z., Gilliland, G., Bhat, T. N., Weissig, H., Shindyalov, I. N. & Bourne, P. E. (2000). Nucleic Acids Res. 28, 235–242. [DOI] [PMC free article] [PubMed]
- Bishop, D. F., Tchaikovskii, V., Hoffbrand, A. V., Fraser, M. E. & Margolis, S. (2012). J. Biol. Chem. 287, 28943–28955. [DOI] [PMC free article] [PubMed]
- Bruno, I. J., Cole, J. C., Kessler, M., Luo, J., Motherwell, W. D. S., Purkis, L. H., Smith, B. R., Taylor, R., Cooper, R. I., Harris, S. E. & Orpen, A. G. (2004). J. Chem. Inf. Comput. Sci. 44, 2133–2144. [DOI] [PubMed]
- Cha, S. & Parks, R. E. Jr (1964). J. Biol. Chem. 239, 1968–1977. [PubMed]
- Emsley, P., Lohkamp, B., Scott, W. G. & Cowtan, K. (2010). Acta Cryst. D66, 486–501. [DOI] [PMC free article] [PubMed]
- Fraser, M. E., Hayakawa, K., Hume, M. S., Ryan, D. G. & Brownie, E. R. (2006). J. Biol. Chem. 281, 11058–11065. [DOI] [PubMed]
- Fraser, M. E., James, M. N. G., Bridger, W. A. & Wolodko, W. T. (1999). J. Mol. Biol. 285, 1633–1653. [DOI] [PubMed]
- Fraser, M. E., James, M. N. G., Bridger, W. A. & Wolodko, W. T. (2000). J. Mol. Biol. 299, 1325–1339. [DOI] [PubMed]
- Gasteiger, E., Hoogland, C., Gattiker, A., Duvaud, S., Wilkins, M. R., Appel, R. D. & Bairoch, A. (2005). The Proteomics Protocols Handbook, edited by J. M. Walker, pp. 571–607. Totowa: Humana Press.
- Huang, J. & Fraser, M. E. (2016). Acta Cryst. D72, 912–921. [DOI] [PubMed]
- Huang, J., Malhi, M., Deneke, J. & Fraser, M. E. (2015). Acta Cryst. F71, 1067–1071. [DOI] [PMC free article] [PubMed]
- Johnson, J. D., Muhonen, W. W. & Lambeth, D. O. (1998). J. Biol. Chem. 273, 27573–27579. [DOI] [PubMed]
- Joyce, M. A., Fraser, M. E., Brownie, E. R., James, M. N. G., Bridger, W. A. & Wolodko, W. T. (1999). Biochemistry, 38, 7273–7283. [DOI] [PubMed]
- Joyce, M. A., Fraser, M. E., James, M. N. G., Bridger, W. A. & Wolodko, W. T. (2000). Biochemistry, 39, 17–25. [DOI] [PubMed]
- Joyce, M. A., Hayakawa, K., Wolodko, W. T. & Fraser, M. E. (2012). Acta Cryst. D68, 751–762. [DOI] [PMC free article] [PubMed]
- Liebschner, D., Afonine, P. V., Baker, M. L., Bunkóczi, G., Chen, V. B., Croll, T. I., Hintze, B., Hung, L.-W., Jain, S., McCoy, A. J., Moriarty, N. W., Oeffner, R. D., Poon, B. K., Prisant, M. G., Read, R. J., Richardson, J. S., Richardson, D. C., Sammito, M. D., Sobolev, O. V., Stockwell, D. H., Terwilliger, T. C., Urzhumtsev, A. G., Videau, L. L., Williams, C. J. & Adams, P. D. (2019). Acta Cryst. D75, 861–877.
- McCoy, A. J., Grosse-Kunstleve, R. W., Adams, P. D., Winn, M. D., Storoni, L. C. & Read, R. J. (2007). J. Appl. Cryst. 40, 658–674. [DOI] [PMC free article] [PubMed]
- Nolte, J. C., Schürmann, M., Schepers, C.-L., Vogel, E., Wübbeler, J. H. & Steinbüchel, A. (2014). Appl. Environ. Microbiol. 80, 166–176. [DOI] [PMC free article] [PubMed]
- Pettersen, E. F., Goddard, T. D., Huang, C. C., Couch, G. S., Greenblatt, D. M., Meng, E. C. & Ferrin, T. E. (2004). J. Comput. Chem. 25, 1605–1612. [DOI] [PubMed]
- Sanadi, D. R., Gibson, D. M., Ayengar, P. & Jacob, M. (1956). J. Biol. Chem. 218, 505–520. [PubMed]
- Schürmann, M., Wübbeler, J. H., Grote, J. & Steinbüchel, A. (2011). J. Bacteriol. 193, 3078–3089. [DOI] [PMC free article] [PubMed]
- Smart, O. S., Womack, T. O., Sharff, A., Flensburg, C., Keller, P., Paciorek, W., Vonrhein, C. & Bricogne, G. (2019). Grade. Cambridge: Global Phasing Ltd.
- Verschueren, K. H. G., Blanchet, C., Felix, J., Dansercoer, A., De Vos, D., Bloch, Y., Van Beeumen, J., Svergun, D., Gutsche, I., Savvides, S. N. & Verstraete, K. (2019). Nature, 568, 571–575. [DOI] [PubMed]
- Waterman, D. G., Winter, G., Gildea, R. J., Parkhurst, J. M., Brewster, A. S., Sauter, N. K. & Evans, G. (2016). Acta Cryst. D72, 558–575. [DOI] [PMC free article] [PubMed]
- Weisse, R. H.-J., Faust, A., Schmidt, M., Schönheit, P. & Scheidig, A. J. (2016). Proc. Natl Acad. Sci. USA, 113, E519–E528. [DOI] [PMC free article] [PubMed]
- Williams, C. J., Headd, J. J., Moriarty, N. W., Prisant, M. G., Videau, L. L., Deis, L. N., Verma, V., Keedy, D. A., Hintze, B. J., Chen, V. B., Jain, S., Lewis, S. M., Arendall, W. B. III, Snoeyink, J., Adams, P. D., Lovell, S. C., Richardson, J. S. & Richardson, D. C. (2018). Protein Sci. 27, 293–315. [DOI] [PMC free article] [PubMed]
- Winn, M. D., Ballard, C. C., Cowtan, K. D., Dodson, E. J., Emsley, P., Evans, P. R., Keegan, R. M., Krissinel, E. B., Leslie, A. G. W., McCoy, A., McNicholas, S. J., Murshudov, G. N., Pannu, N. S., Potterton, E. A., Powell, H. R., Read, R. J., Vagin, A. & Wilson, K. S. (2011). Acta Cryst. D67, 235–242. [DOI] [PMC free article] [PubMed]
- Winter, G. (2010). J. Appl. Cryst. 43, 186–190.
- Winter, G., Waterman, D. G., Parkhurst, J. M., Brewster, A. S., Gildea, R. J., Gerstel, M., Fuentes-Montero, L., Vollmar, M., Michels-Clark, T., Young, I. D., Sauter, N. K. & Evans, G. (2018). Acta Cryst. D74, 85–97. [DOI] [PMC free article] [PubMed]
- Wolodko, W. T., Fraser, M. E., James, M. N. G. & Bridger, W. A. (1994). J. Biol. Chem. 269, 10883–10890. [DOI] [PubMed]
Associated Data
This section collects any data citations, data availability statements, or supplementary materials included in this article.
Supplementary Materials
PDB reference: succinyl-CoA synthetase, complex with tartryl-CoA, 6wcv


