Abstract
DNA double strand breaks (DSBs) are repaired through homology-directed repair (HDR) or non-homologous end joining (NHEJ). BRCA1/2-deficient cancers cannot perform HDR, conferring sensitivity to poly-ADP-ribose polymerase (PARP) inhibitors. However, concomitant loss of the pro-NHEJ factors 53BP1, RIF1, REV7-Shieldin (SHLD1–3) or CST-Polα in BRCA1-deficient cells restores HDR and PARP inhibitor resistance. Here, we identify the TRIP13 ATPase as a negative regulator of REV7. We show that REV7 exists in active “closed” and inactive “open” conformations, and TRIP13 catalyzes the inactivating conformational change, thereby dissociating REV7-Shieldin to promote HDR. TRIP13 similarly disassembles the REV7-REV3 translesion synthesis (TLS) complex, a component of the Fanconi Anemia pathway, inhibiting error-prone replicative lesion bypass and interstrand crosslink repair. Importantly, TRIP13 overexpression is common in BRCA1-deficient cancers, confers PARPi resistance, and correlates with poor prognosis. Thus, TRIP13 emerges as an important regulator of DNA repair pathway choice – promoting HDR, while suppressing NHEJ and TLS.
Keywords: REV7, Shieldin, TRIP13, DNA Repair, Pathway Choice, Homologous Recombination, PARPi, Translesion Synthesis, Mutagenesis, HORMA, Fanconi Anemia
Introduction
Our genomes face many threats, both from DNA damage and from aberrancies during cell division1. Failure to protect the genome can cause alterations and ultimately result in oncogenic transformation2. Double strand breaks (DSBs) are a particularly perilous type of DNA damage and can be repaired by homology-directed repair (HDR) or non-homologous end joining (NHEJ)3. NHEJ is a simpler pathway that re-ligates the ends; however, its inappropriate use can lead to harmful deletions and translocations4,5, whereas HDR ensures fidelity by using the sister chromatid as a template.
Recently, REV7 and the Shieldin complex, comprising SHLD1, SHLD2 and SHLD3, along with the CST complex and DNA Polymerase α, have emerged as critical regulators of repair pathway choice between HDR and NHEJ by acting downstream of 53BP1 and RIF1 to counteract 5’−3’ DNA end resection that commits repair to HDR6–16. The tumor suppressor BRCA1, in contrast, promotes end resection and HDR17. Therefore, BRCA1-deficient tumors are HDR-defective, and susceptible to poly-ADP ribose polymerase (PARP) inhibition18,19. Importantly, loss of 53BP1, RIF1 or any Shieldin, alleviates the HDR defect of BRCA1-deficient cells, thereby conferring PARP inhibitor (PARPi) resistance5,20–22. Hence, understanding the function and regulation of REV7-Shieldin is essential to combat chemotherapeutic resistance.
REV7 is a small protein with no catalytic activity that bridges the interaction between SHLD2 and SHLD3 in the Shieldin complex10,11,13. Similarly, REV7 links REV1 and REV3 in the translesion synthesis (TLS) Polymerase ζ complex23,24. This error-prone polymerase can bypass replication blockages and is required for interstrand crosslink (ICL) repair as part of the Fanconi Anemia (FA) pathway25,26. REV7 also plays a poorly understood role in mitosis in complex with the zinc finger proteins, CAMP and POGZ27,28. Despite the various important functions of REV7, little is known about its regulation.
REV7, along with the spindle assembly checkpoint (SAC) protein MAD2, the meiotic regulators HORMAD1/2 and the autophagy proteins ATG13-ATG101, are members of the HORMA family29. While HORMA proteins perform widely disparate cellular functions, they are remarkably alike in tertiary structure. A key feature is their C-terminal seatbelt domain, which latches over partners. MAD2 and Hop1 (yeast HORMAD1/2) exist in two conformational states, where the seatbelt is either “open” in an unliganded state or “closed” over a partner30,31.
In the case of MAD2, conformational switching is essential for its function. Only the closed form of MAD2 (C-MAD2) is active, capable of CDC20 binding and SAC activation30,32. The conformational dynamics of MAD2, and therefore its activity, is tightly regulated by two opposing proteins: MAD1 which promotes closing of MAD2 over CDC20 to activate the SAC, and the AAA+ ATPase TRIP13 which opens MAD2, thus turning off the SAC33,34.
Intriguingly, published structures of REV7 with either REV3 or CAMP reveal a conformation resembling C-MAD224,35,36. However, an inactive open form of REV7 and the factors that regulate its conformation are unknown. Here, we demonstrate that REV7 can stably adopt distinct open and closed conformations, and that only the closed conformation is proficient for Shieldin and Pol ζ complex formation. Additionally, we identify TRIP13 as a modulator of REV7 conformation, making TRIP13 a key regulator of pathway choice at both DSBs and replication blockages. Importantly, we find that overexpression of TRIP13, a common feature in cancer, causes PARPi resistance through disruption of the REV7-SHLD3 interaction, and correlates with poor patient survival.
Results
REV7-Shieldin physically interacts with TRIP13
To identify REV7 regulators, we purified tandem affinity-tagged REV7 complexes and subjected them to mass spectrometry (Fig. 1a,b). Interestingly, a top hit was the AAA+ ATPase TRIP13, a negative regulator of the HORMA proteins MAD2 and HORMAD1/2 (Extended Data Fig. 1a). We confirmed the interaction through reciprocal IP of TRIP13, which pulled down endogenous REV7 (Fig. 1c). We also found that SHLD1–3 are able to co-IP TRIP13, indicating that it interfaces with the REV7-Shieldin complex (Extended Data Fig. 1b). The interaction between TRIP13 and SHLD3 was particularly strong; consistent with the direct REV7-SHLD3 interaction11. Interestingly, the interaction between REV7 and TRIP13 was not affected by X-ray or UV radiation nor Olaparib and Mitomycin C (MMC) (Fig. 1c and Extended Data Fig. 1c,d), similar to the damage-independent interaction between REV7 and Shieldin11.
Fig. 1. TRIP13 promotes Olaparib resistance by negatively regulating REV7.
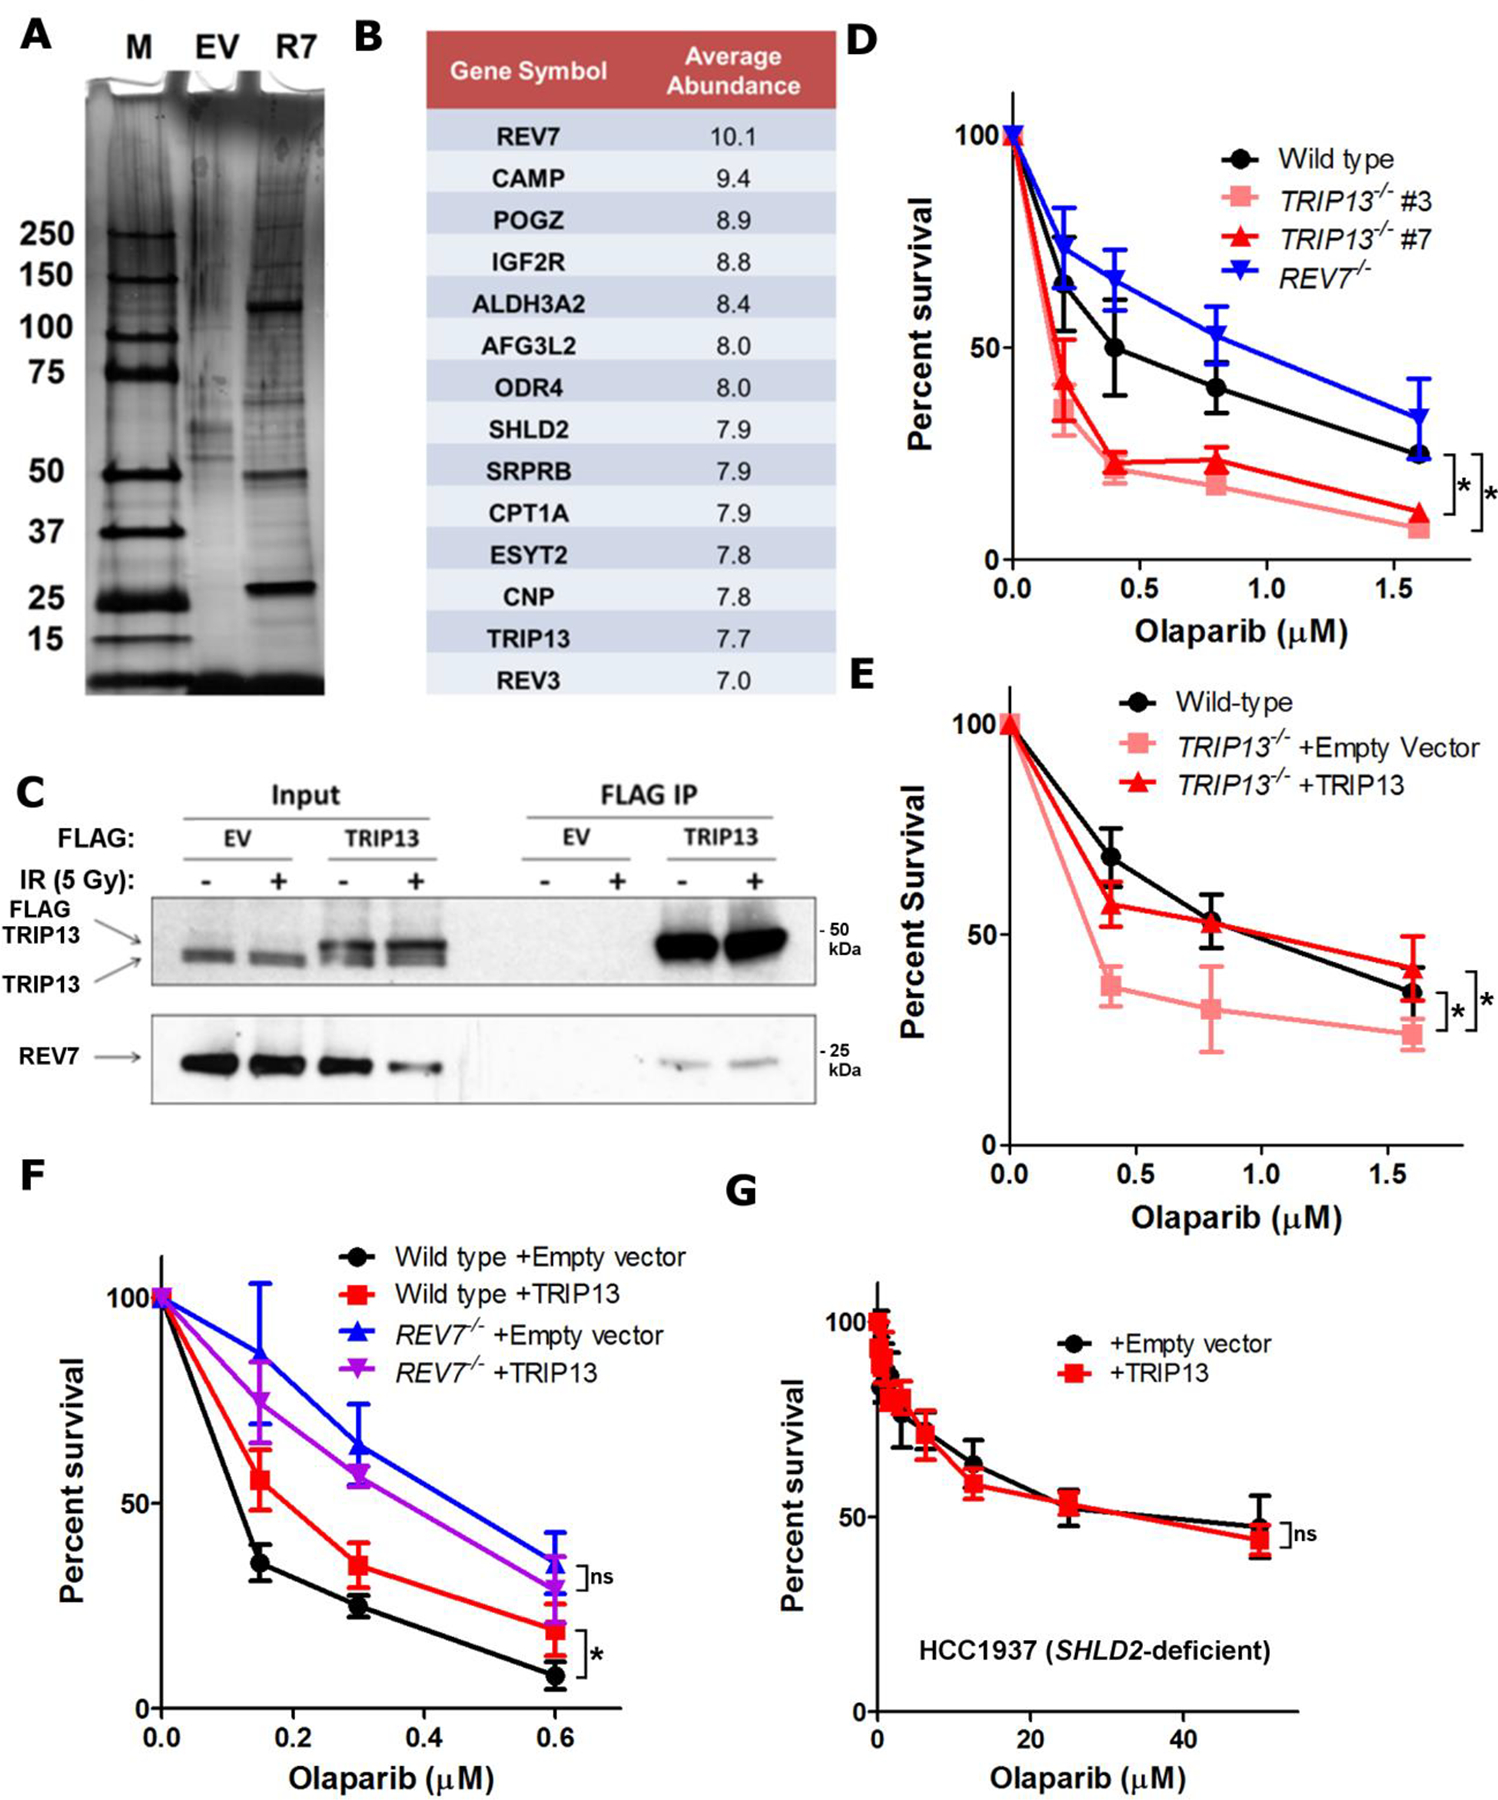
a. Silver-stained gel of FLAG-HA empty vector (EV) and FLAG-HA-REV7 (R7) purifications. b. Table of high confidence REV7-interacting proteins and average abundance of proteins recovered from 3 biologically independent experiments. c. Western blot of FLAG IP from HEK293T cells transfected with empty vector or FLAG-TRIP13 with or without DNA damage. d. 14-day clonogenic survival assay of USOS wild-type, REV7−/−, and TRIP13−/− cell lines treated with varying Olaparib doses, n=3 independent experiments, wild-type vs. TRIP13−/− #3: p = 0.0001, wild-type vs. TRIP13−/− #7: p = 0.002 (2-Way ANOVA). e. 14-day clonogenic survival assay of wild-type or TRIP13−/− cells with or without expression of TRIP13 cDNA upon treatment with Olaparib, n=3 biologically independent experiments, wild-type vs. TRIP13−/− + Empty vector: p = 0.002, TRIP13−/− + Empty vector vs. TRIP13−/− + TRIP13: p = 0.002 (2-Way ANOVA). f. 14-day clonogenic survival assay of U2OS wild-type and REV7−/− with or without TRIP13 overexpression treated with varying Olaparib doses, n=3 biologically independent experiments, Wild-type + Empty vector vs. wild-type + TRIP13: p = 0.005, REV7−/− + Empty vector vs. REV7−/− + TRIP13: p = 0.31 (2-Way ANOVA). g. 5-day cytotoxicity analysis of HCC1937 SHLD2-deficient cells infected with pBabe-empty vector or pBabe-TRIP13 treated with the indicated doses of Olaparib. n=5 biologically independent experiments, p=0.58 (2-Way ANOVA). All error bars indicate SEM. Immunoblots are representative of at least 2 independent experiments. Statistical source data are provided in Source Data Fig. 1. Unprocessed blots are provided in Unprocessed blots Fig. 1.
TRIP13 promotes PARPi resistance via REV7-Shieldin
To test whether TRIP13 negatively regulates REV7 in the context of Shieldin, we generated TRIP13−/− U2OS cell lines (Extended Data Fig. 1e). We observed that TRIP13−/− had increased sensitivity to Olaparib, which could be rescued by TRIP13 cDNA expression, contrasting with the resistance of REV7−/− cells26 (Fig. 1d,e), and consistent with an antagonistic role. As the PARPi resistance associated with Shieldin inactivation is clinically relevant, we wondered whether this could be achieved by TRIP13 over-expression. Indeed, U2OS cells stably overexpressing TRIP13, but not the ATPase dead E253Q mutant, exhibited a modest induction of PARPi resistance (Extended Data Fig. 1f,g). Importantly, knockdown of the canonical TRIP13 substrate, MAD2, had no effect on Olaparib resistance or HDR as measured by the DR-GFP assay (Extended Data Fig. 1h–j)37.
To definitively place TRIP13 in the REV7 pathway for PARPi resistance, we queried epistasis by overexpressing TRIP13 in REV7−/− cells. While TRIP13 overexpression in REV7 wild-type cells conferred Olaparib resistance, it had no effect in REV7−/− cells (Fig. 1f), consistent with our model. Additionally, knocking out REV7 in TRIP13−/− cells suppressed their Olaparib sensitivity (Extended Data Fig. 1k,l). Finally, we overexpressed TRIP13 in the SHLD2-deficient HCC1937 breast cancer cell line14. Consistent with the REV7−/− case, TRIP13 overexpression had no effect in HCC1937 cells (Fig. 1g and Extended Data Fig. 1m), indicating that TRIP13 promotes Olaparib resistance via regulation of REV7-Shieldin.
Purified REV7 adopts two conformations in solution
TRIP13 regulates MAD2 by catalyzing its transition from a closed (C-MAD2) to an open (OMAD2) conformation, thereby releasing its binding partner CDC2030,33. Published crystal structures of REV7 bound to REV3 and CAMP reveal a conformation analogous to C-MAD224,35,36 (Fig. 2a); however, no REV7 form corresponding to O-MAD2 has been observed thus far.
Fig. 2. REV7 exists in two functionally distinct conformational states.
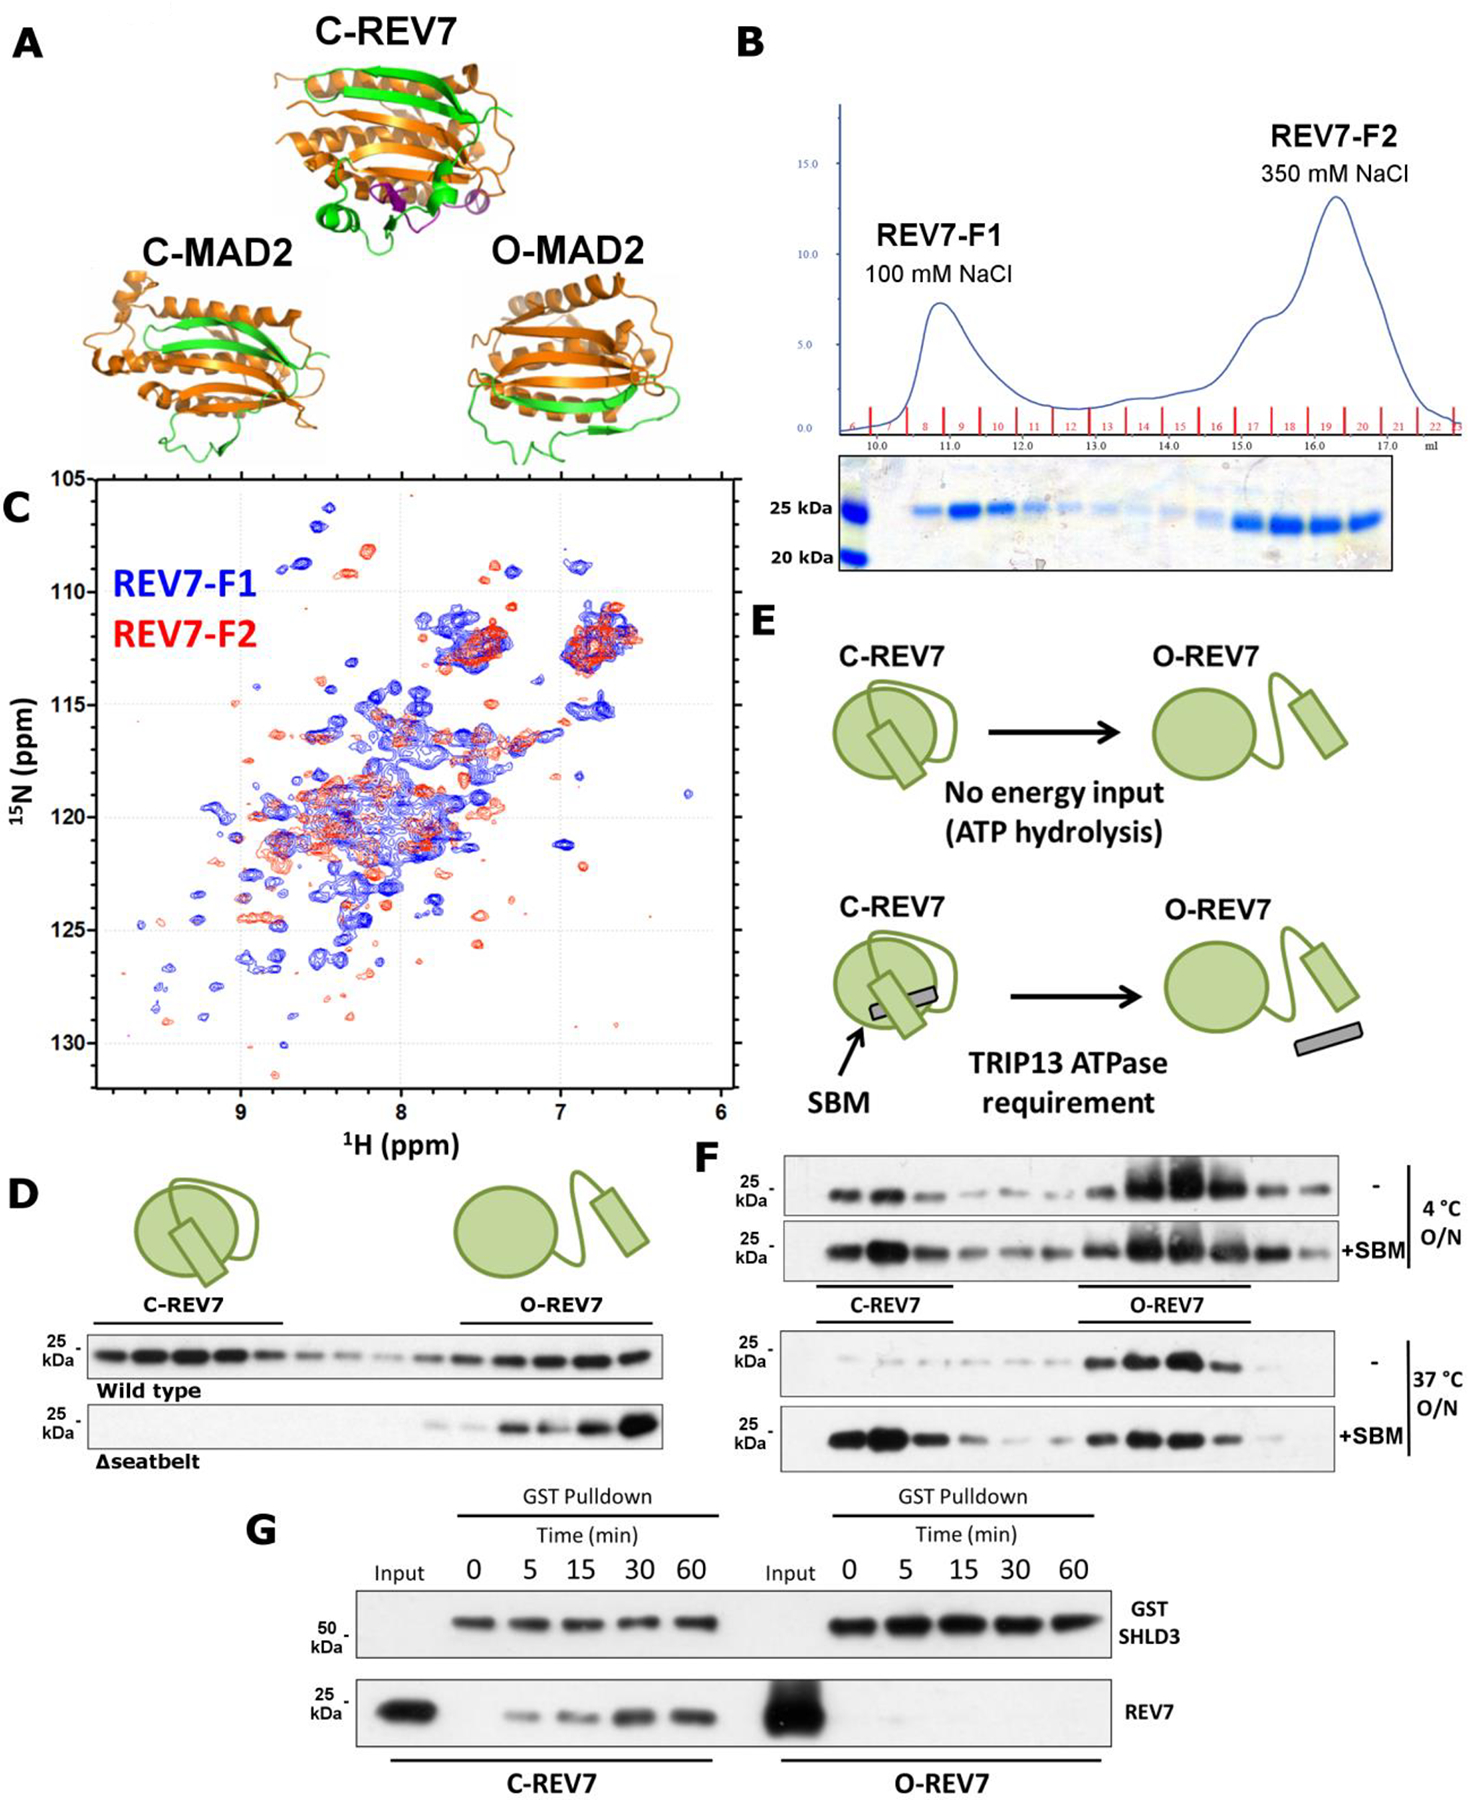
a. Crystal structures of C-REV7 and O/C-MAD2 with the dynamic seatbelt region in green. Purple indicates the REV7-binding fragment of REV3. Constructed from 3VU7 and 3GMH. b. (Top) UV absorbance trace at 280 nm showing elution of purified REV7 upon AEC. (Bottom) Coomassie-stained gel of the corresponding fractions. c. 15N-labelled HSQC NMR spectrum of REV7-F1 (blue) and REV7-F2 (red). d. Western blot of AEC fractions of purified REV7R124A and REV7R124A, Δseatbelt. e. Schematic showing the requirement of TRIP13 ATPase activity for the C-REV7 to O-REV7 transition in cells upon seatbelt binding motif (SBM) binding. f. Western blot of AEC fractions of REV7R124A upon overnight incubation at 4 °C (top) or 37 °C (bottom) with or without SBM. g. Pulldown of C-REV7 and O-REV7 by GST-SHLD3 at the indicated time points. Coomassie stained gels and immunoblots are representative of at least 2 independent experiments. Unprocessed blots are provided in Unprocessed blots Fig. 2.
To determine whether REV7 also exists in two conformations, we purified REV7 from E. coli. For this, we utilized the well-characterized REV7R124A mutant that cannot form dimers, but maintains interactions with binding partners38, an approach previously used with MAD230. As expected, purified REV7R124A was predominantly monomeric (Extended Data Fig. 2a). O- and C-MAD2 can be separated through anion exchange chromatography (AEC)30, so we asked whether distinct REV7 conformers could be similarly detected. Indeed, when we performed AEC on REV7R124A, we observed two discrete populations, one eluting at ~100 mM NaCl (REV7-F1) and the other at ~350 mM NaCl (REV7-F2) (Fig. 2b). Western blots confirmed that these two fractions were both REV7 (Extended Data Fig. 2b).
To study the dynamics of the REV7 pools, we isolated REV7-F1 and REV7-F2 and ran them through the AEC protocol again. We observed very little conversion of F1 to F2 and absolutely no conversion of F2 to F1 (Extended Data Fig. 2b), implying mostly stable populations. Given the low level of F1-to-F2 conversion, we wondered whether it would proceed to completion over time. Indeed, REV7-F1 left overnight at 37 °C converted entirely to F2 (Extended Data Fig. 2b).
As a complementary approach to query REV7 conformation, we purified 15N-labelled REV7 and assayed each pool by HSQC nuclear magnetic resonance (NMR) spectroscopy. The NMR spectra of the two populations were remarkably different (Fig. 2c), signifying large-scale structural changes and consistent with our model. Strikingly, the REV7-F1 spectrum is similar to that of partner-bound REV738, suggesting correspondence to C-REV7.
REV7 adopts an active “closed” form and an inactive “open” form
To determine if the peaks correspond to open and closed REV7, we purified a REV7R124A, Δseatbelt mutant lacking the C-terminal 10 amino acids, which is homologous to a MAD2 mutant that cannot adopt the closed conformation. Consistent with our prediction that this mutant can exist in only one conformation, we saw only a single population eluting at the same salt concentration as REV7-F2 (Fig. 2d). This indicates that REV7-F2 is most likely O-REV7, while REV7-F1 corresponds to C-REV7, consistent with the NMR data (Fig. 2c).
It is puzzling that the ATPase TRIP13 should be required to convert C-REV7 to O-REV7 given that C-REV7 can spontaneously convert to O-REV7 at a physiological temperature (Extended Data Fig. 2b). However, the true substrate for TRIP13 is C-REV7 in complex with a seatbelt binder (Fig. 2e). To test if C-REV7 is stabilized upon partner binding, we utilized a known REV7 seatbelt-binding motif (SBM) peptide derived from its Pol ζ-binding partner, REV3. Strikingly, pre-incubation of REV7 with the SBM peptide stabilized C-REV7, preventing any conversion even after overnight incubation (Fig. 2f), likely explaining the ATPase requirement.
Closed REV7 specifically interacts with SHLD3 through a seatbelt binding mechanism
Crystal structures of REV7 in complex with REV3 and CAMP reveal a common binding mechanism, wherein the REV7 seatbelt domain binds to a short conserved SBM: (R/K)PxxxxP(T/S) (Extended Data Fig. 2c,d)35,36. Interestingly, SHLD3 also harbors an SBM in its REV7-interacting region (Extended Data Fig. 2d)11, suggesting that SHLD3 is a seatbelt interactor as well. To test this, we purified GST-tagged SHLD3 from E. coli and incubated it with either REV7R124A or REV7R124A, Δseatbelt. As expected, GST-SHLD3 could pull down full length REV7, but not the Δseatbelt mutant (Extended Data Fig. 2e), implying that REV7 and SHLD3 bind through a seatbelt-SBM interaction. Furthermore, when we incubated GSTSHLD3 with isolated REV7 fractions, we observed that only C-REV7 was able to bind (Fig. 2g). Together, these data indicate a remarkable regulatory mechanism in DNA repair wherein REV7 is controlled by conformational alteration.
TRIP13 can dissociate C-REV7:SHLD3 complexes in vitro
As TRIP13 inactivates MAD2 by releasing its seatbelt interactor CDC20, we tested whether purified TRIP13 could similarly disassemble C-REV7:SHLD3 in vitro. Purified TRIP13 exhibited robust ATPase activity (Extended Data Fig. 3a,b) and dissociated in vitro assembled REV7-SHLD3 complexes in an ATP-dependent manner, as evidenced by release of REV7 from immobilized GST-SHLD3 complexes (Fig. 3a–c). Thus, TRIP13 ATPase activity can disrupt the REV7-Shieldin complex in vitro via disengagement of the seatbelt interactor SHLD3 from REV7.
Fig. 3. TRIP13 negatively regulates REV7 activity.
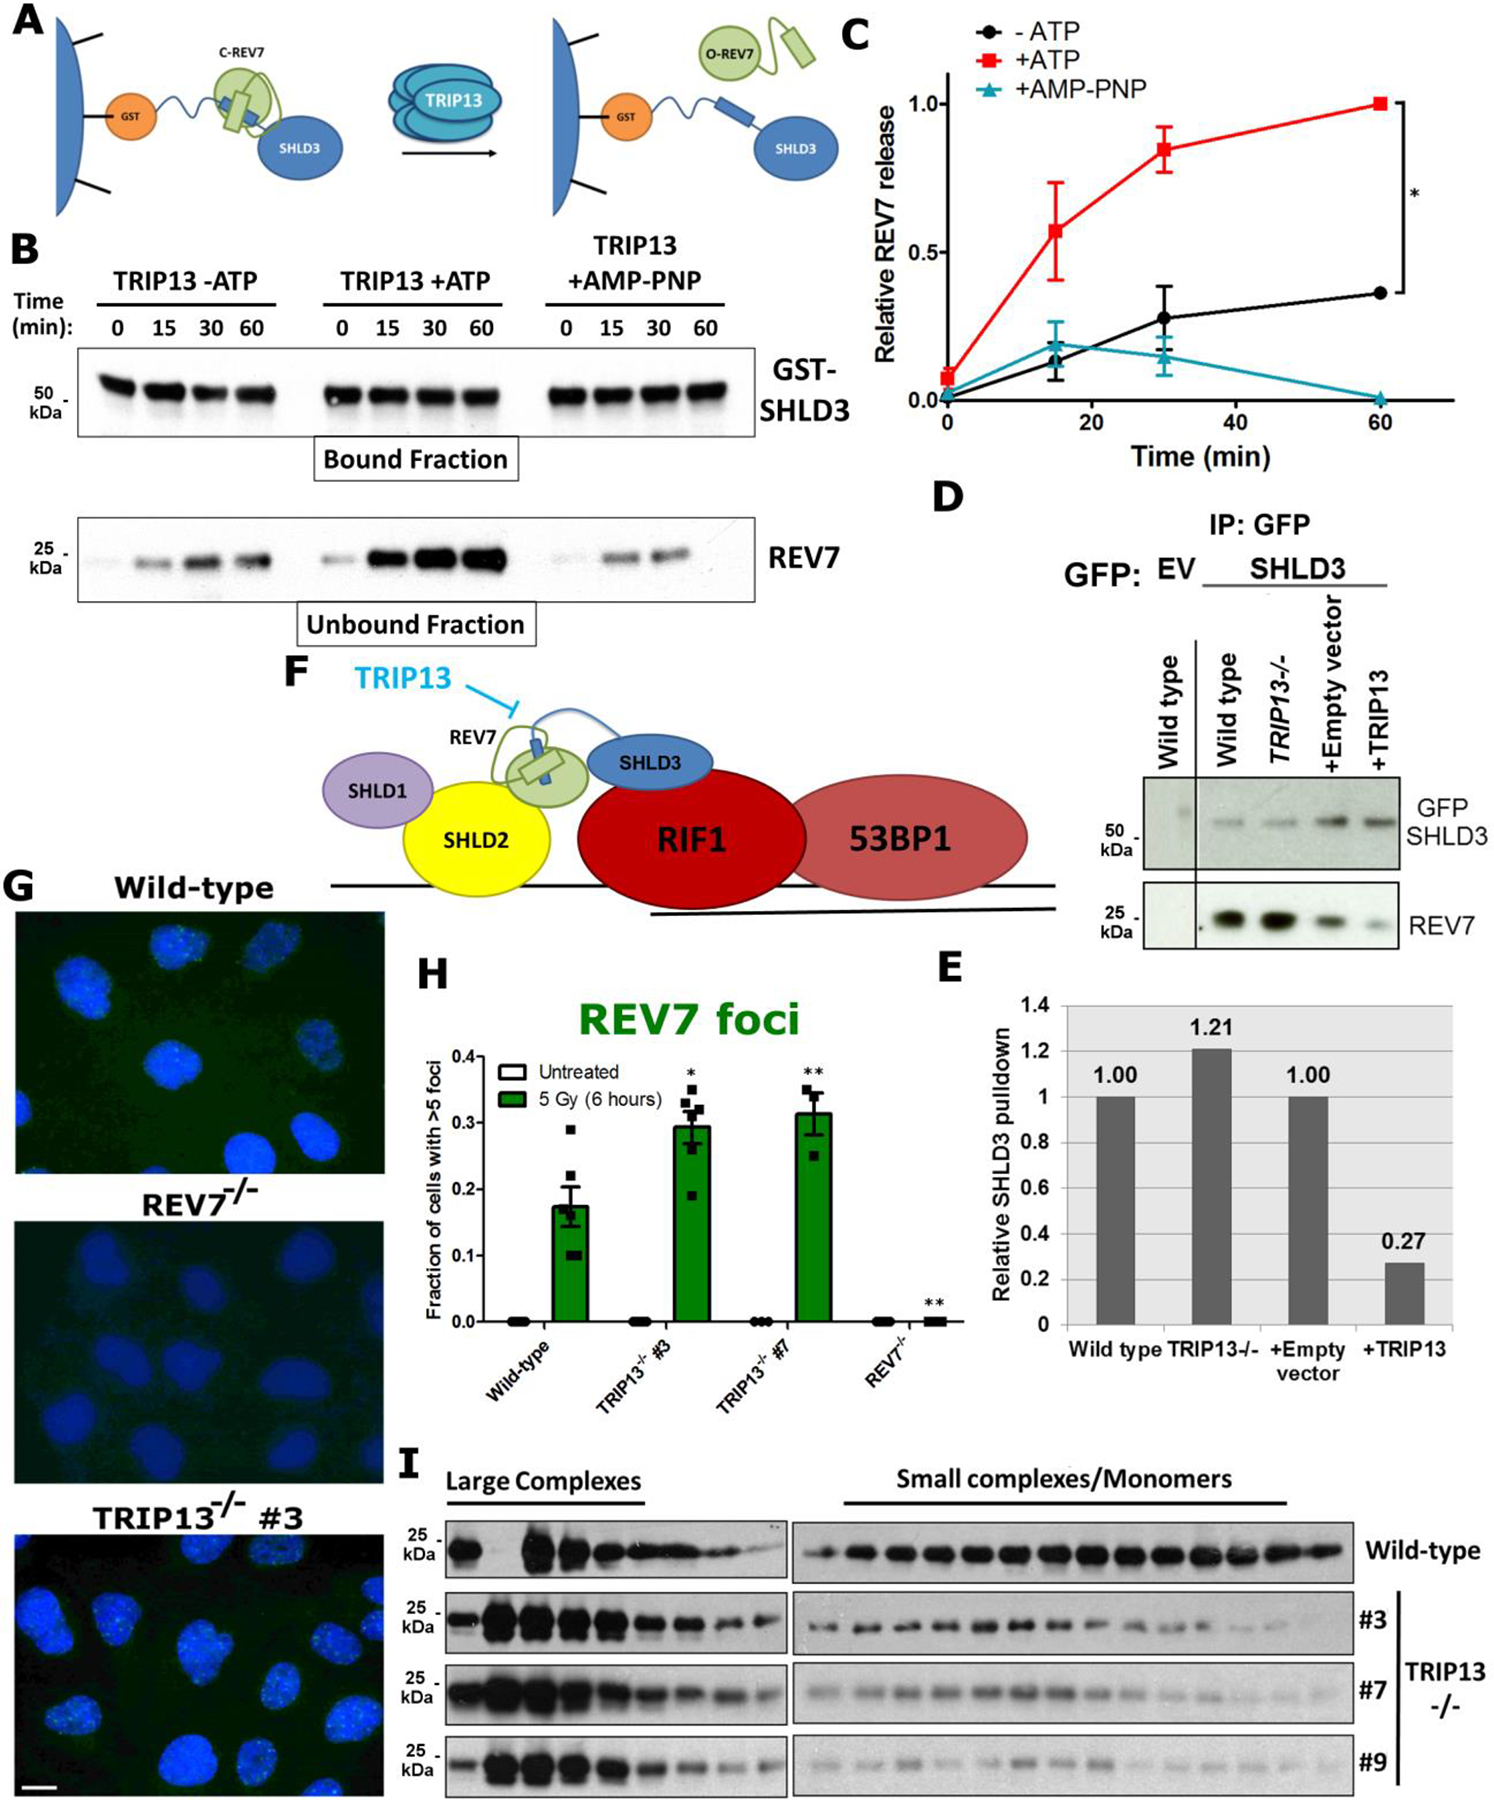
a. Schematic showing the remodeling and release of REV7 from SHLD3 complexes upon action of the TRIP13 ATPase. b. Western blot showing glutathione bead-bound GST-SHLD3 and the release of REV7 into the unbound fraction over time in the absence or presence of ATP or the non-hydrolysable ATP analog AMP-PNP. c. Quantification of ATP-dependent release of REV7 from SHLD3 over time by TRIP13. n=3 independent experiments, -ATP vs +ATP: p = 0.006, +ATP vs. +AMP-PNP: p = 0.002 (2-way ANOVA). d. Western blot of GFP IP from U2OS wild type, TRIP13−/−, pBabe and pBabe-TRIP13 cells transfected with GFP-tagged SHLD3. e. Quantification of western blot in (d). f. Schematic for TRIP13 counteraction of REV7 seatbelt closure, preventing the formation of functional Shieldin complex. g. Focus formation of REV7 6 h after irradiation in U2OS wild-type, REV7−/− and TRIP13−/− cells (Scale bar: 10 μm). h. Quantification of REV7 foci for (g). n=6 biologically independent experiments (Except for TRIP13−/− #7, n=3), Wild Type vs. TRIP13−/− #3: p = 0.01, Wild Type vs. TRIP13−/− #7: p = 0.02, Wild Type vs. REV7−/−: p = 0.002, (Student’s t-test, 2-tailed), error bars represent SEM. i. Gel filtration elution profiles of REV7 from U2OS wild-type and three TRIP13−/− clones. All immunoblots are representative of at least 2 independent experiments. Statistical source data are provided in Source Data Fig. 3. Unprocessed blots are provided in Unprocessed blots Fig. 3.
TRIP13 antagonizes REV7 function in cells
To determine whether TRIP13 similarly affected REV7 dynamics in cells, we performed IPs with GFP-tagged SHLD3 in wild-type, TRIP13−/−, and TRIP13-overexpressing cells. Consistent with our in vitro findings, TRIP13−/− cells showed increased REV7-SHLD3 interaction, whereas TRIP13 overexpression decreased the interaction (Fig. 3d,e). Furthermore, we observed the same effect in multiple cell lines and with FLAG-tagged SHLD3 (Extended Data Fig. 3c). Importantly, the REV7-SHLD1 association was unaltered in TRIP13−/− cells (Extended Data Fig. 3d,e), consistent with reports that SHLD1 binds to REV7 through a distinct interface from SHLD3 (Fig. 3f)10.
We next asked whether TRIP13 status altered the recruitment of REV7 to DNA damage via SHLD3 (Fig. 3f). Indeed, TRIP13−/− cells exhibited an increase in REV7 focus formation upon DSB induction by ionizing radiation (IR) (Fig. 3g,h). Conversely, overexpression of TRIP13 reduced REV7 focus formation (Extended Data Fig. 3f,g). We observed the same effect on REV7 recruitment when we queried its chromatin association after IR (Extended Data Fig. 3h). Importantly, focus formation of 53BP1 and RIF1 was unaffected by TRIP13 status (Extended Data Fig. 3i,j), indicating that DSB repair kinetics and upstream components are unaltered.
It is not possible to directly assess the conformational status of REV7 in cells using AEC as REV7 binding partners would affect the elution profile. However, since C-REV7 can form seatbelt-dependent complexes while O-REV7 cannot (Fig. 2g), we expected that C-REV7 will more often exist as a part of large complexes, whereas O-REV7 will not. To assay this, we performed SEC on cell lysates from wild-type and TRIP13−/− cells. Consistent with our expectations, we observed a higher proportion of low molecular weight REV7 in wild-type cells as compared to TRIP13−/− (Fig. 3i). Together, these results indicate that TRIP13 is a negative regulator of REV7 seatbelt association, and thereby activity, in cells.
TRIP13 promotes resection and homologous recombination
As TRIP13 negatively regulates REV7, an anti-resection factor, we expected that TRIP13 should enhance end resection and promote HDR. We first assayed resection using the single molecule analysis of resection tracts (SMART) method39. In TRIP13−/− cells, we observed a significant decrease in resection tract lengths (Fig. 4a,b), consistent with REV7-Shieldin hyperactivation. On the other hand, REV7−/− cells showed longer resection tracts (Fig. 4a,b). TRIP13 overexpression conferred a similar increase in resection (Extended Data Fig. 4a,b), likely via REV7-Shieldin inactivation.
Fig. 4. TRIP13 promotes homologous recombination.
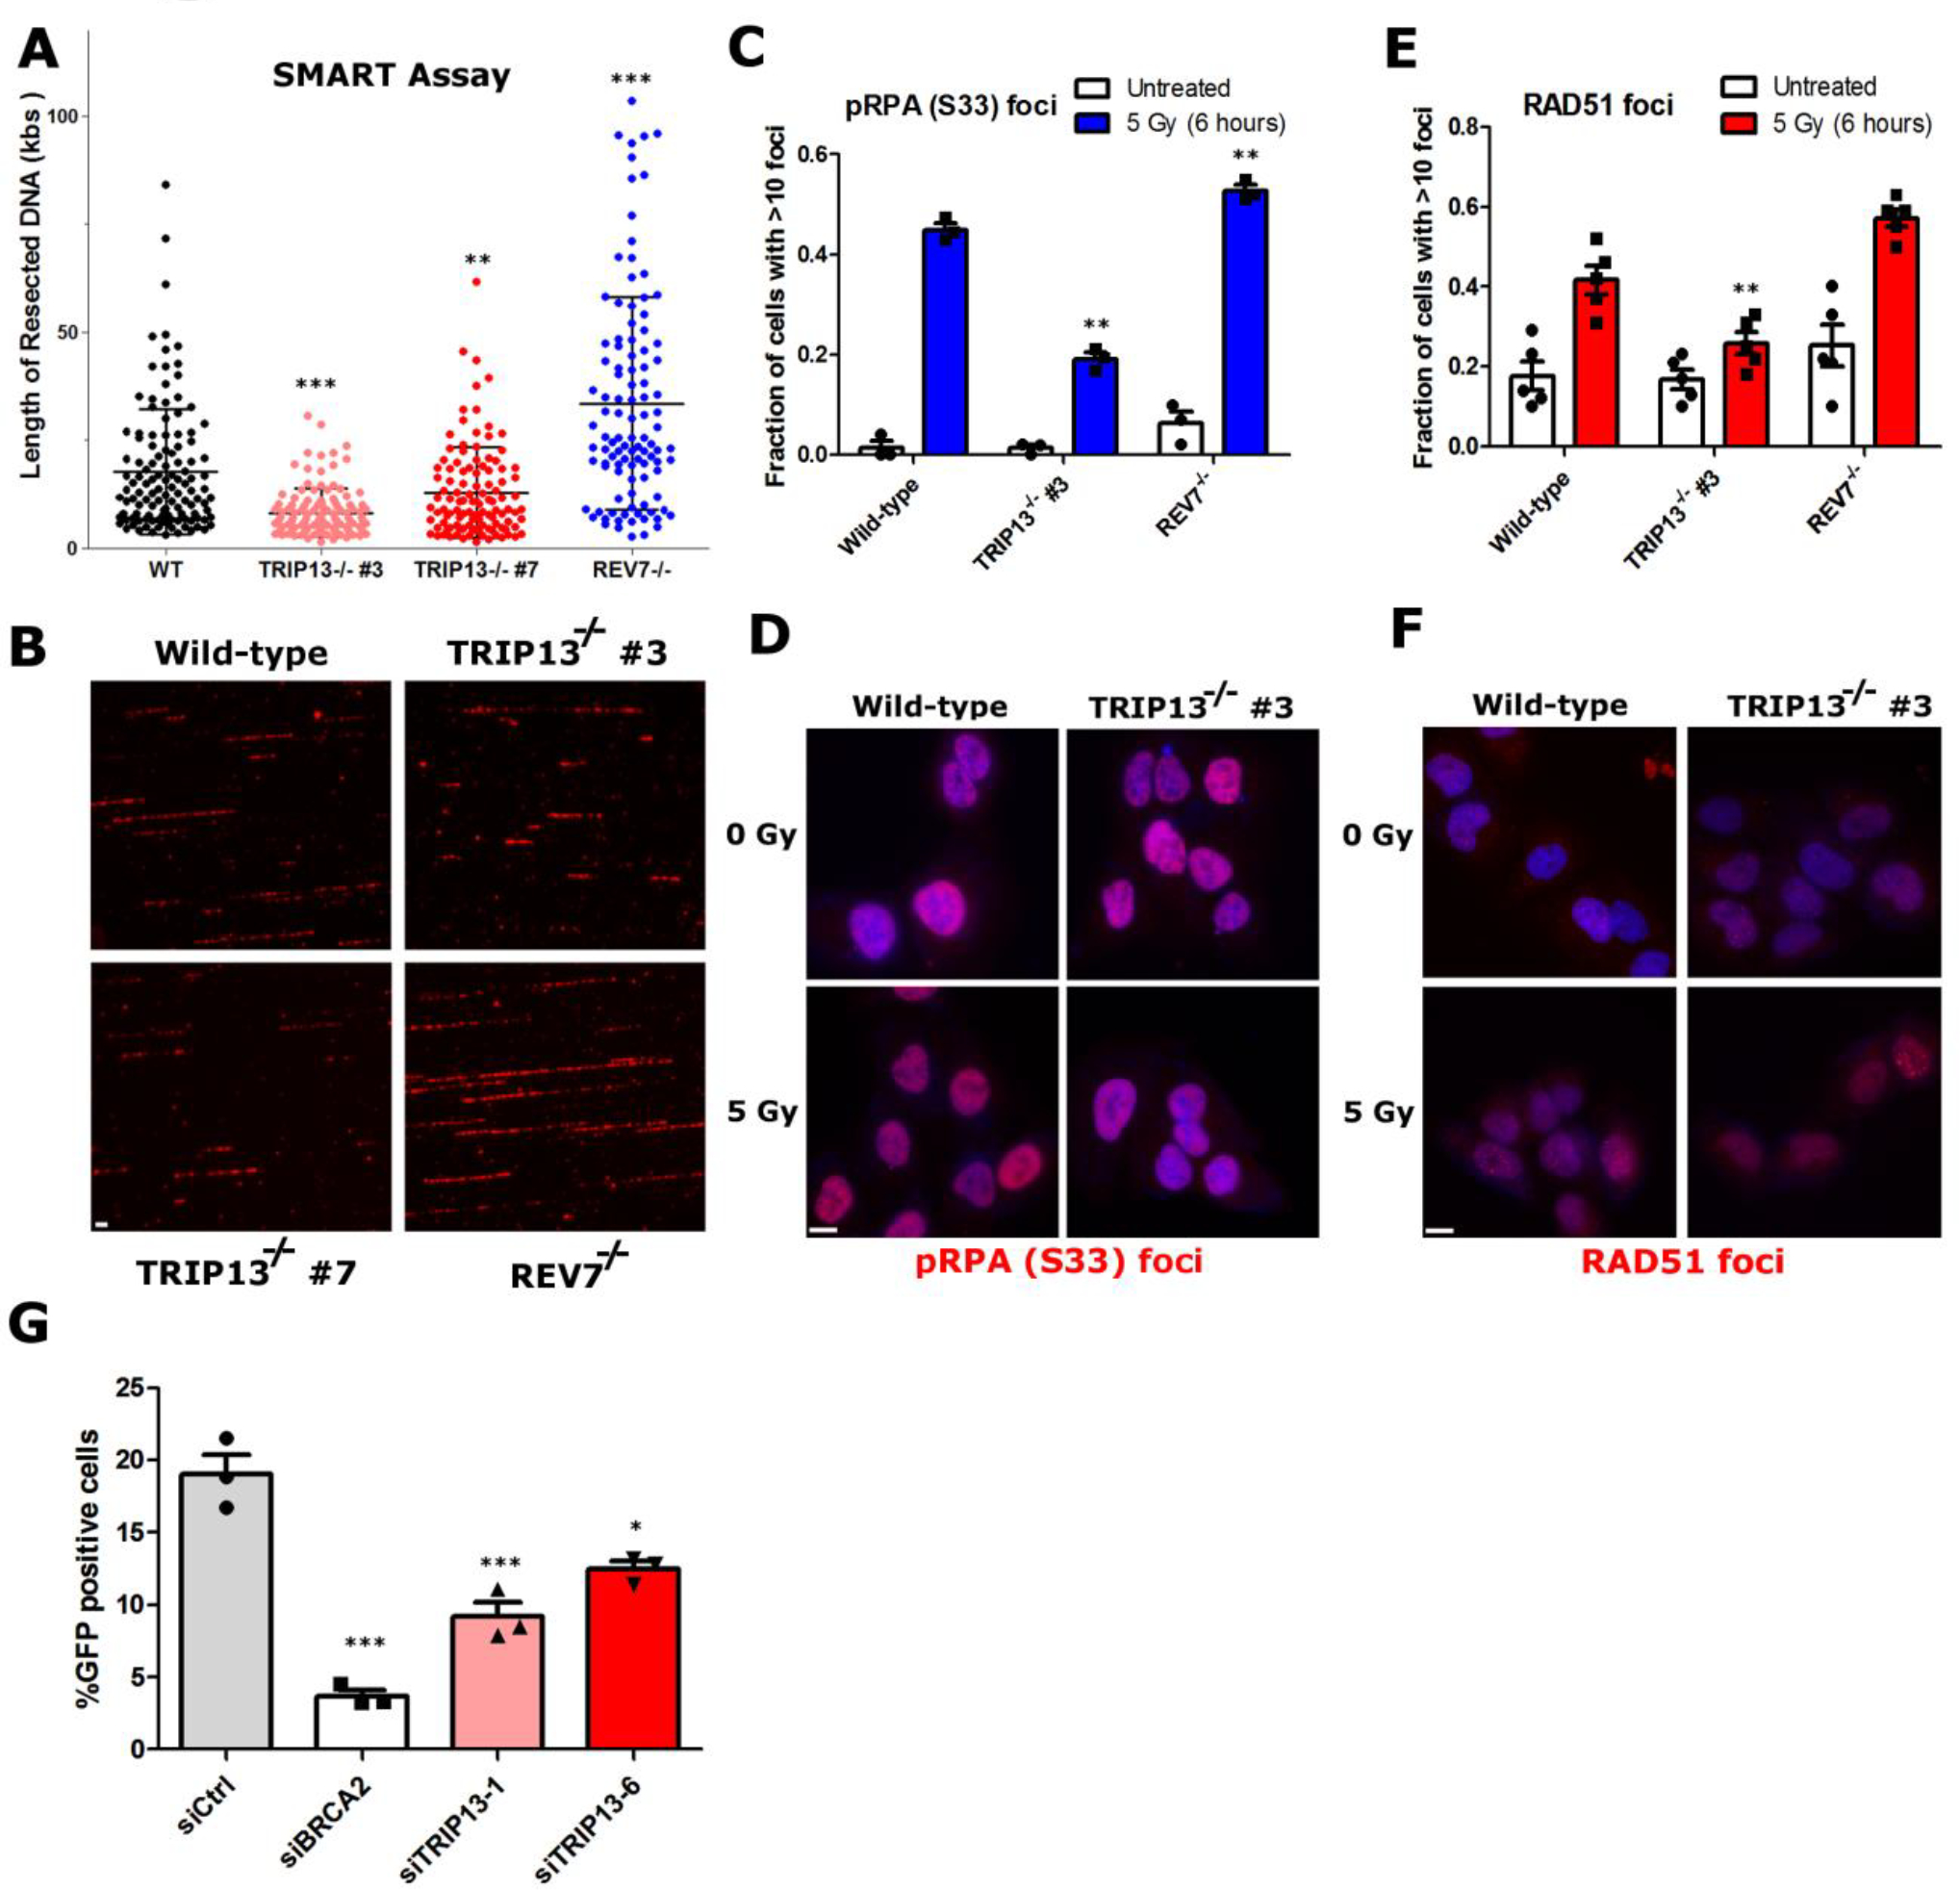
a. Quantification of resected ssDNA in U2OS wild-type, TRIP13−/− (two clones) and REV7−/− cells measured by SMART assay, ~100 fibers were counted per experiment, Wild Type vs. TRIP13−/− #3: p < 0.0001, Wild Type vs. TRIP13−/− #7: p = 0.004, Wild Type vs. REV7−/−: p < 0.0001 (Mann-Whitney test, two-tailed), bars indicate mean and SEM. b. Representative images for (a), with BrdU in exposed ssDNA tracts labeled red. (Scale bar: 1 μm) c. Proportion of U2OS cells with greater than 10 p-RPA32(S33) foci 6 hours following IR treatment. n=3 biologically independent experiments, Wild Type vs. TRIP13−/− #3: p = 0.001, Wild Type vs. REV7−/−: p = 0.01 (Student’s t-test, two-tailed). d. Representative images of data in (c) (Scale bar: 10 μm). e. Proportion of U2OS cells with greater than 10 RAD51 foci 6 hours following IR treatment. n=6 biologically independent experiments, Wild Type vs. TRIP13−/− #3: p = 0.01, Wild Type vs. REV7−/−: p = 0.02 (Student’s t-test, two-tailed). f. Representative images of data in (e) (Scale bar: 10 μm). g. Percentage of GFP-positive cells following infection of U2OS DR-GFP cells with I-SceI adenovirus with knockdown of BRCA2 or TRIP13. n=3 biologically independent experiments, siCtrl vs siBRCA2: p = 0.0004, siCtrl vs. siTRIP13–1: p = 0.004, siCtrl vs. TRIP13–6: p = 0.01 (Student’s t-test, two-tailed), all error bars indicate SEM. Statistical source data are provided in Source Data Fig. 4.
As a complementary approach, we monitored phosphorylation of the ssDNA binding protein RPA on S33, which marks resected DNA40. Consistent with our SMART results, fewer TRIP13−/− cells had pRPA foci following IR treatment, whereas REV7−/− and TRIP13 overexpressing cells showed an increase (Fig. 4c,d and Extended Data Fig. 4c). Similar results were observed in HeLa cells and by western blotting (Extended Data Fig. 4d–f). Importantly, this was not rescued by expression of the ATPase-dead form of TRIP13 (Extended Data Fig. 4f).
Following end resection, RPA is replaced by the recombinase RAD51 for HDR to proceed3. TRIP13−/− cells were compromised for RAD51 focus formation, while TRIP13 overexpressing cells showed an increase (Fig. 4e,f and Extended Data Fig. 4g), consistent with its posited REV7-antagonistic function. We again recapitulated these results in HeLa cells (Extended Data Fig. 4h). Notably, a role for TRIP13 in RAD51 loading during meiotic recombination has been reported, although the mechanism remained elusive41. Our findings shed light on this curious result; however, further studies on REV7-Shieldin in meiotic recombination are required.
To assay the effect of TRIP13 on HDR completion, we utilized the DR-GFP reporter cassette assay37. Expectedly, we observed a modest decrease in HDR following TRIP13 knockdown, and an increase upon overexpression (Fig. 4g and Extended Data Fig. 4i,j). Taken together, these data demonstrate that TRIP13 promotes HDR through inactivation of REV7-Shieldin.
TRIP13 also modulates REV7 function in translesion synthesis
REV7-mediated TLS is essential for ICL repair, and homozygous mutation of REV7 causes Fanconi Anemia, a genetic disease characterized by ICL repair deficiency26. We found that overexpression of TRIP13 resulted in cellular sensitivity to MMC and increased formation of chromosome aberrations and radials (Fig. 5a–c), which are hallmarks of defective ICL repair, indicating that TRIP13 also affects REV7 function in ICL repair. TRIP13 overexpression similarly sensitized cells to UV-induced base damage (Fig. 5d). Additionally, knockdown of TRIP13 increased UV-induced mutagenesis, as measured by the SupF assay (Extended Data Fig. 5a and Fig. 5e), further supporting the notion that TRIP13 negatively regulates REV7 in the Pol ζ context.
Fig. 5. TRIP13 antagonizes REV7 function in the translesion synthesis/FA pathway.
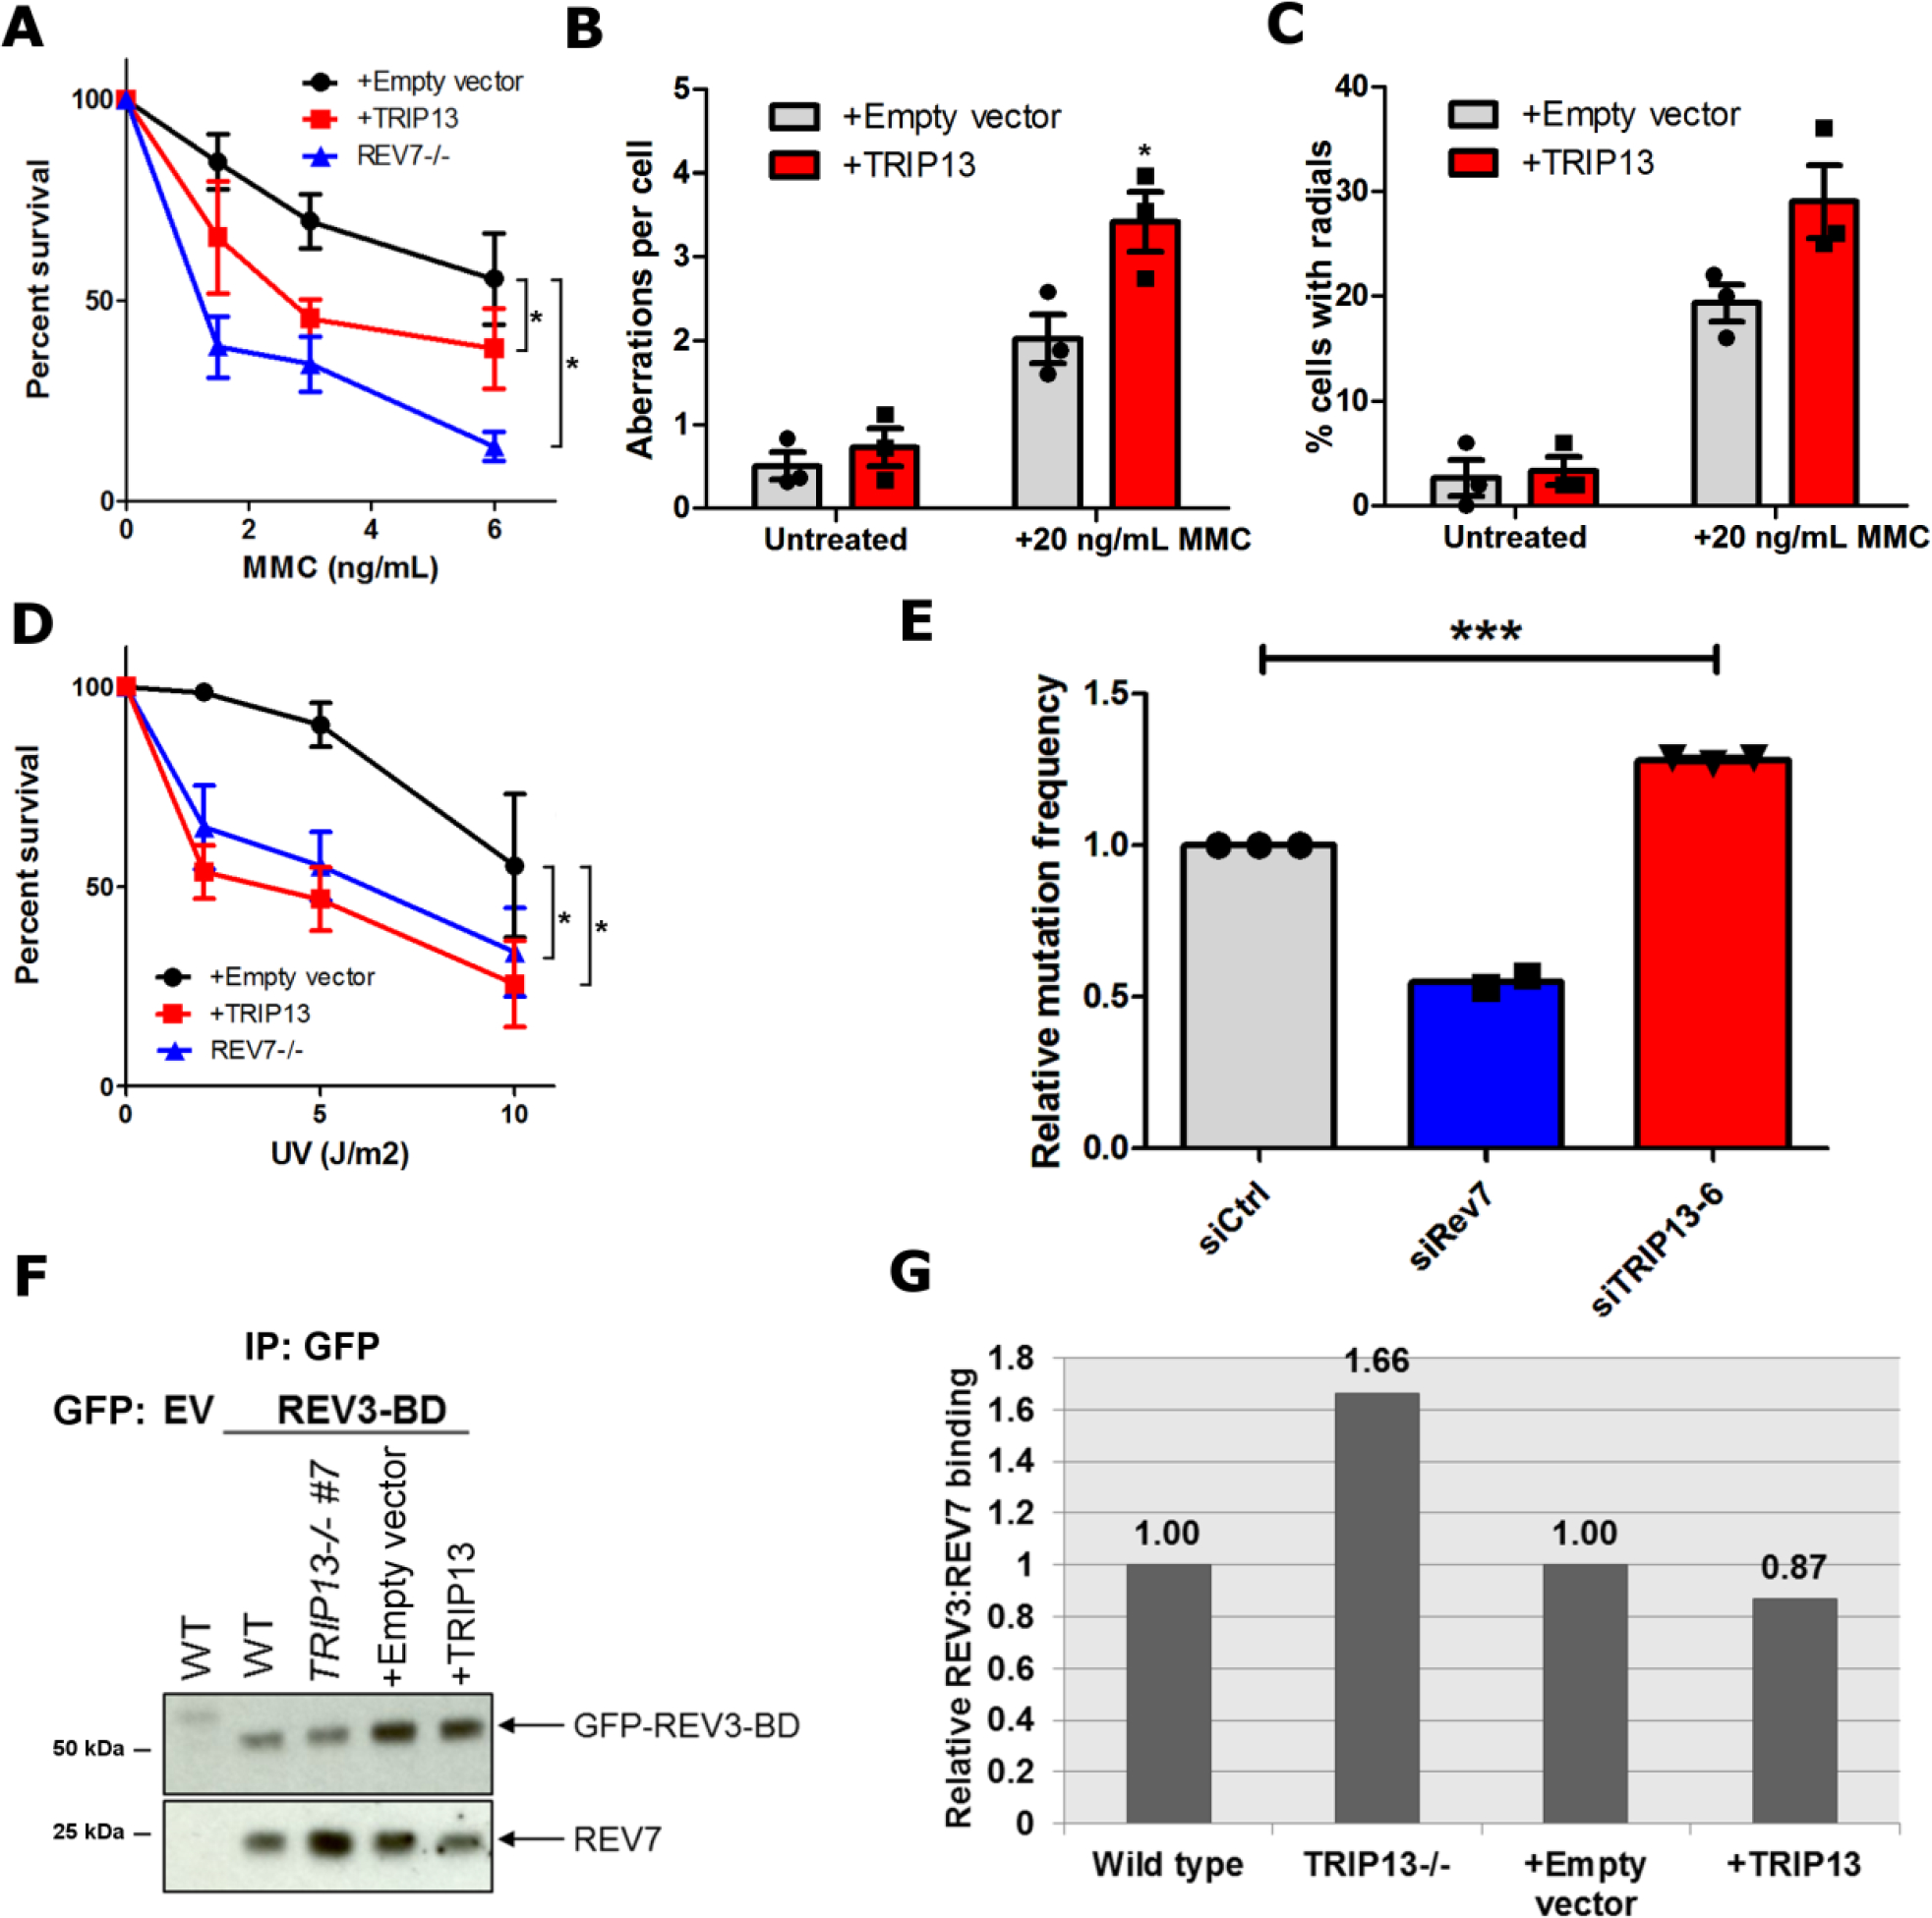
a. 14-day clonogenic survival assay of U2OS wild-type expressing pBabe-empty vector or pBabe-TRIP13 and REV7−/− cell lines treated with the indicated mitomycin C (MMC) doses. n=4 biologically independent experiments (Except for REV7−/−: n=3), Wild-type + Empty vector vs. Wild-type + TRIP13: p = 0.02, Wild-type + Empty vector vs. REV7−/−: p < 0.0001 (2-Way ANOVA). b. Average number of chromosomal aberrations per cell in baseline condition or following treatment with 20 ng/mL of MMC, with or without TRIP13 overexpression. n=3 biologically independent experiments. c. Percentage of cells with radial chromosome formation in baseline condition or following treatment with 20 ng/mL of MMC, with or without TRIP13 overexpression. n=3 biologically independent experiments. d. 14-day clonogenic survival assay of U2OS wild-type expressing pBabe-empty vector or pBabe-TRIP13 and REV7−/− cell lines treated with the indicated UV doses. n=4 biologically independent experiments, Wild-type + Empty vector vs. Wild-type + TRIP13: p < 0.0001, Wild-type + Empty vector vs. REV7−/− : p = 0.002 (2-Way ANOVA). e. Relative UV-induced mutation frequencies in HEK293T cells transfected with nontargeting, REV7- or TRIP13-targeting siRNAs as measured by the SupF assay. n=3 biologically independent experiments (Except for REV7−/−: n=2), siCtrl vs siTRIP13–6: p = 0.0006 (Student’s paired t-test, two-tailed). f. Western blot of GFP IP from U2OS wild type, TRIP13−/−, pBabe and pBabe-TRIP13 cells transfected with GFP-tagged REV3 binding domain (REV3-BD). g. Quantification of western blot in (f). All error bars represent SEM. All immunoblots are representative of at least 2 independent experiments. Statistical source data are provided in Source Data Fig. 5. Unprocessed blots are provided in Unprocessed blots Fig. 5.
Intriguingly, TRIP13−/− cells were not resistant to UV and ICL-inducing agents (Extended Data Fig. 5b,c), suggesting that hyperactive TLS serves only to increase mutation frequency without conferring a survival advantage. Along these lines, knockdown of TRIP13 did not affect radial chromosome prevalence (Extended Data Fig. 5d). It did, however, result in severe cohesinopathy (Extended Data Fig. 5d), likely due to dysfunction of the SAC through MAD234.
We suspected that TRIP13 regulates TLS by antagonizing the seatbelt-dependent REV7-REV3 interaction. To test this, we expressed a GFP-tagged fragment of REV3 containing the REV7-binding SBM and performed immunoprecipitations. As expected, TRIP13−/− cells showed greater REV7-REV3 association, whereas TRIP13-overexpressing cells exhibited a decrease (Fig. 5f,g). These results imply that TRIP13 operates in a similar fashion, whether it is engaged with Pol ζ or Shieldin, thereby regulating two distinct DNA repair pathways.
TRIP13 is often overexpressed in breast cancer and correlates with BRCA1 deficiency
The function of REV7-Shieldin in DSB repair is clinically important because it affects the sensitivity of cancer cells to PARPis42. As TRIP13 overexpression enhances HDR and PARPi resistance even in HDR-proficient cells (Fig. 4) and is frequently observed in many types of cancer (Extended Data Fig. 6a,b), we wondered whether TRIP13 overexpression is a clinically significant factor in HDR-deficient cancer cells.
We first analyzed breast cancer data from the Cancer Genome Atlas (TCGA). Importantly, while the HDR defect of BRCA1-deficient cells can be rescued by Shieldin loss, the same is not true for BRCA2-deficient cancers, as BRCA2 acts downstream of resection8. Consistent with this, BRCA1-mutant breast cancers showed a significant increase in TRIP13 expression compared to BRCA-proficient cells, whereas BRCA2-deficient cells did not (Fig. 6a). This suggests that TRIP13 upregulation may be clinically significant in BRCA1-deficient cancers.
Fig. 6. TRIP13 overexpression correlates with poor prognosis in BRCA1-deficient breast cancer and enhances homologous recombination in a cell line model.
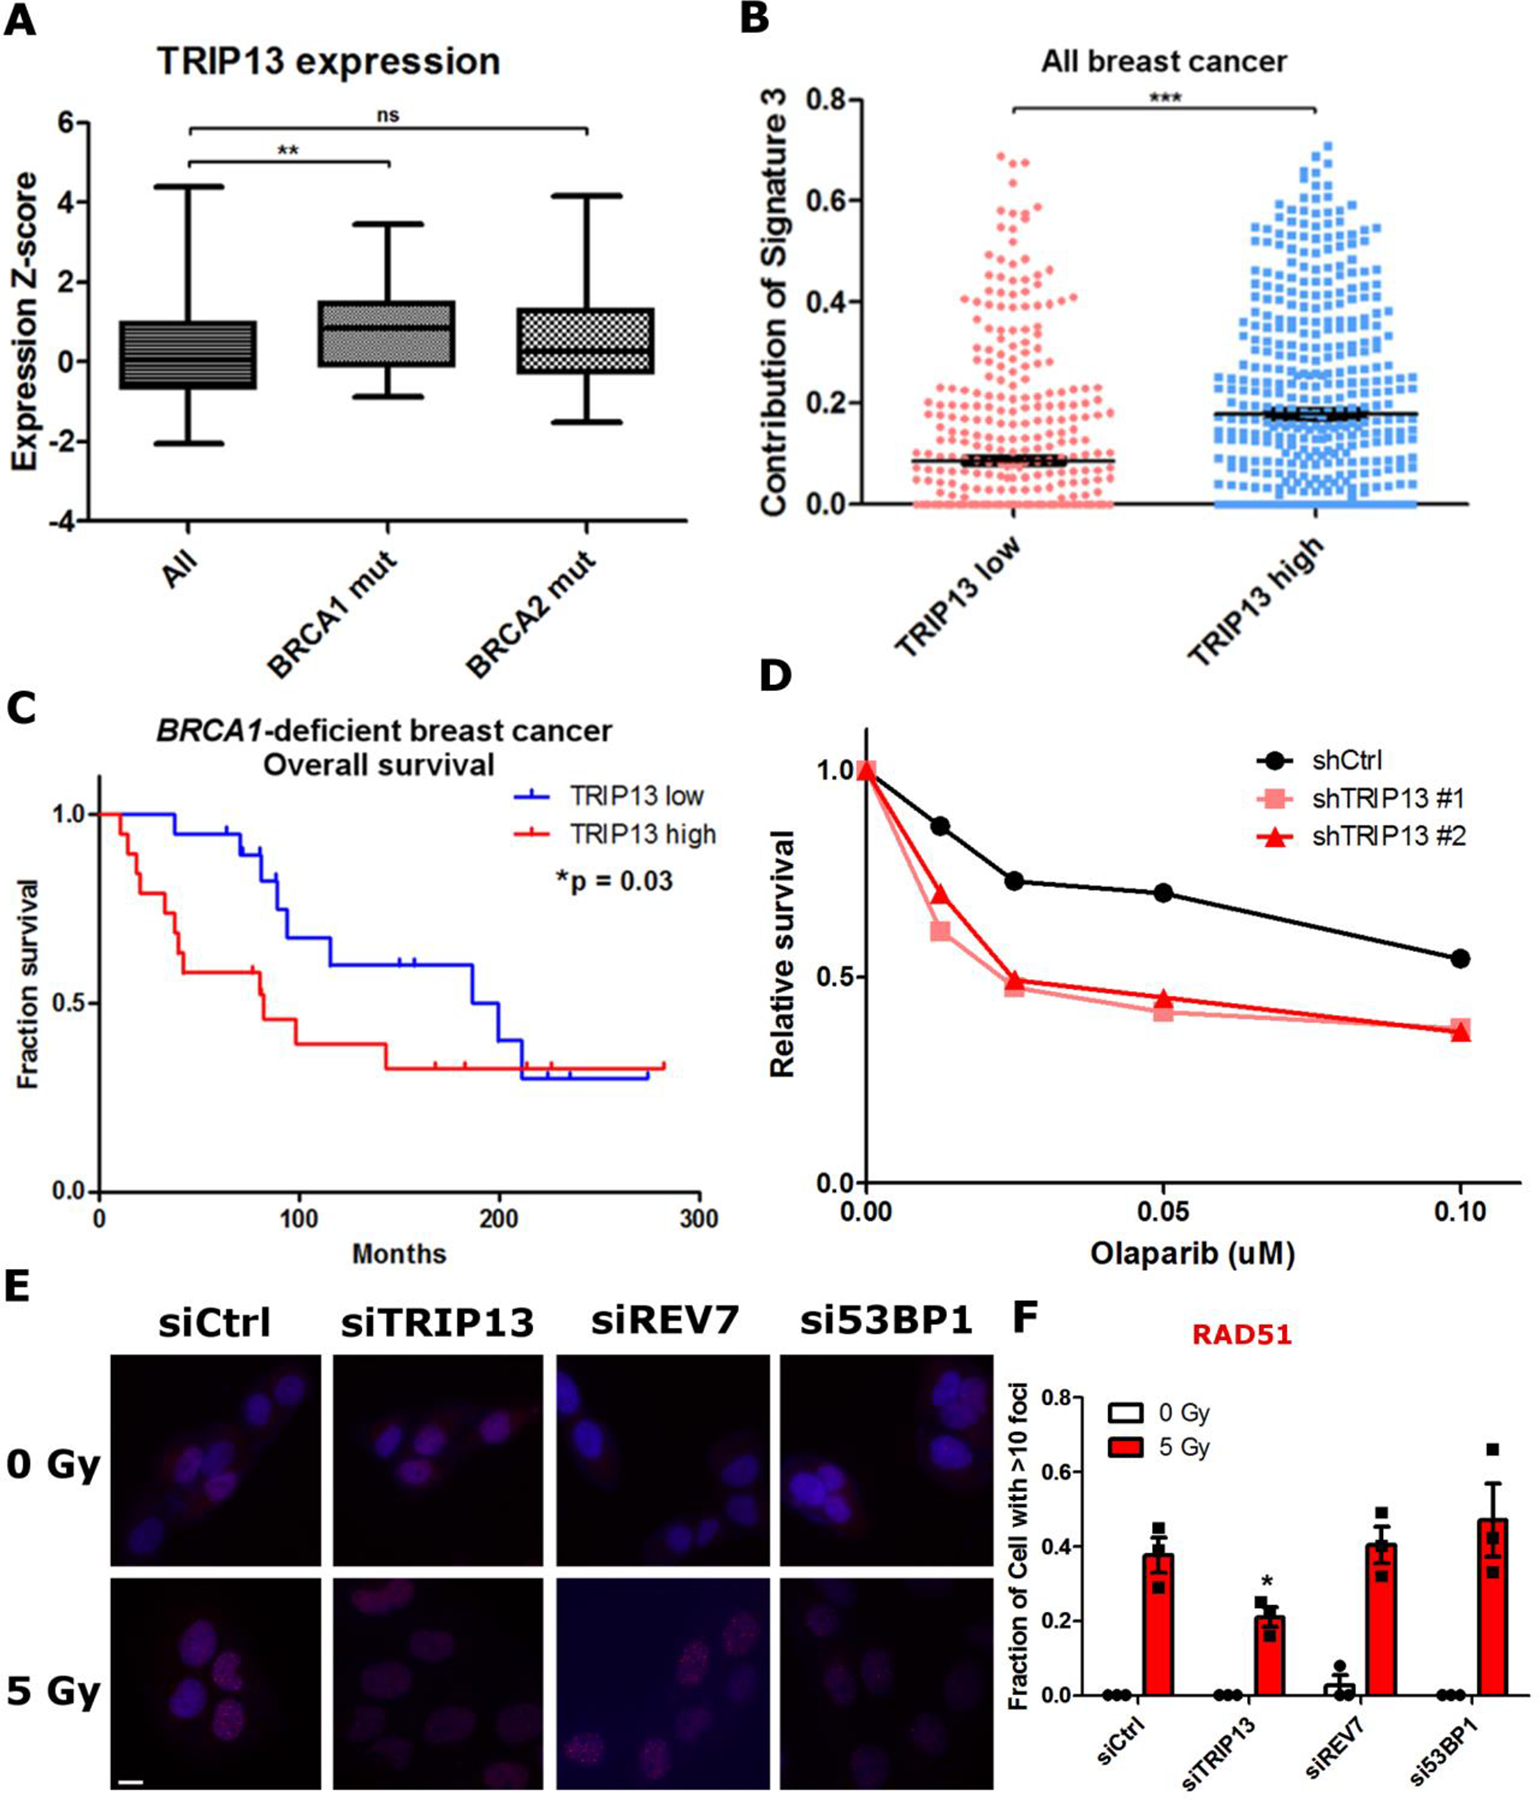
a. Expression Z-scores of TRIP13 in all, BRCA1 mutant and BRCA2 mutant breast cancers from TCGA. All: n = 1898 distinct patients, BRCA1 mut: n = 38 distinct patients, BRCA2 mut: n = 44 distinct patients. All vs. BRCA1 mut: p = 0.0008, All vs. BRCA2 mut: p = 0.06 (Mann-Whitney test, two-tailed). Boxes represent median and quartiles, whiskers represent minima and maxima b. Relative contribution of HR deficiency mutational signature (Signature 3) in breast cancer patients from TCGA cohort stratified by TRIP13 expression levels. TRIP13 high: n = 480 distinct patients, TRIP13 low: n = 480 distinct patients, ***p<0.0001 (Mann-Whitney test, two-tailed). c. Kaplan-Meier overall survival plot of BRCA1-deficient breast cancer patients stratified by median TRIP13 expression level, TRIP13 high: n = 19 distinct patients, TRIP13 low: n = 19 distinct patients (Gehan-Breslow-Wilcoxon test). d. 14-day clonogenic survival assay of SUM149PT cells with nontargeting or TRIP13-targeted shRNAs treated with indicated Olaparib doses, n=2 biologically independent experiments. e. Representative images of IR-induced RAD51 foci in SUM149PT cells. (Scale bar: 10 μm) f. Proportion of SUM149PT cells with more than 10 RAD51 foci 6 h following IR treatment. n = 3 biologically independent experiments, siCtrl vs siTRIP13: *p = 0.04, siCtrl vs. siREV7: p = 0.71, siCtrl vs. si53BP1: p = 0.43 (Student’s t-test, two-tailed). All error bars indicate SEM. Statistical source data are provided in Source Data Fig. 6.
BRCA1 mutations are relatively rare in breast cancer; however, functional HDR deficiency is more prevalent. To correlate TRIP13 expression with functional HDR deficiency in breast cancer, we queried the prevalence of mutation signatures that are associated with defects in different DNA repair pathways43. For this, we used a cohort of 960 breast cancer tumors that had been analyzed for mutation signatures44. We found that only Signature 3, indicative of HDR deficiency, was differentially prevalent between TRIP13 high and low expressing tumors (Fig. 6b). Tellingly, it was elevated in high TRIP13-expressing tumors, implying that HDR-deficient tumors up-regulate TRIP13 expression.
We then asked whether TRIP13 expression correlates with survival among BRCA1-deficient breast cancer patients in TCGA. Though these patients were not treated with Olaparib, BRCA1-deficient cancers are mainly triple negative cancers and treated with chemo and radiation therapy to which HDR-deficient cells are also sensitive. We found that patients with high TRIP13 expression had significantly worse overall survival than those with low TRIP13 expression (Fig. 6c), suggesting that high TRIP13-expressing cancers are more resistant to treatment, potentially through HDR restoration.
TRIP13 overexpression promotes HDR and PARPi resistance in BRCA1-deficient breast cancer cells
We proceeded to directly assay the effect of TRIP13 in BRCA1-deficient breast cancer-derived cell lines. We assessed TRIP13 protein levels in a panel of normal and cancer cell lines and observed wide variation (Extended Data Fig. 6c). We focused on the SUM149PT cell line, as it is a widely used BRCA1-deficient model with high TRIP13 expression. Despite their BRCA1 deficiency, SUM149PT cells were partially HDR-proficient as monitored by RAD51 focus formation and Olaparib resistance (Fig. 6d–f). We therefore asked whether TRIP13 promotes HDR in these cells. Indeed, knockdown of TRIP13 significantly impaired both RAD51 focus formation and Olaparib resistance (Fig. 6d–f and Extended Data Fig. 6d). Interestingly, knockdown of REV7 or 53BP1 did not appreciably increase RAD51 focus formation in SUM149PT cells (Fig. 6e,f and Extended Data Fig. 6e), unlike other BRCA1-deficient contexts7,20. This is likely because the 53BP1-REV7-Shieldin axis in these cells is already inactivated by their high TRIP13 expression.
Having shown that TRIP13 expression is necessary for PARPi resistance in a cancer cell line (Fig. 6), we wanted to determine if it is sufficient for induction of resistance in an engineered BRCA1-mutant RPE-1 cell line45. We confirmed that knockdown of REV7 partially restored Olaparib resistance in this cell line (Extended Data Fig. 6f). Overexpression of TRIP13 in this setting led to a striking induction of Olaparib resistance (Extended Data Fig. 6g), demonstrating that TRIP13 overexpression is a bona fide mechanism of PARPi resistance.
Discussion
Post-translational regulation of proteins is ubiquitous in the DNA damage response (DDR)46,47. Unlike conventional covalent modifications of residues, we unveil a post-translational regulatory mechanism, unprecedented in the DDR, wherein REV7 is regulated by stable modifications to its tertiary structure. Additionally, we pinpoint the REV7-interacting protein, TRIP13, as a negative regulator of REV7 by promoting its conformational transition.
Given the importance of the Shieldin complex in dictating PARPi resistance, its mechanism of regulation is an important open question. Here, we reveal a significant player in the conserved AAA+ ATPase TRIP13; however, the stimuli that control the action of TRIP13 and association and dissociation of REV7-Shieldin, remain enigmatic. Additionally, unbound CREV7 rapidly converts to inactive O-REV7, thus strongly suggesting that the generation of C-REV7 is an active process requiring other factors, discovery of which will shed light on REV7 function.
We have shown that TRIP13 regulates REV7 function in two distinct complexes: Shieldin and Pol ζ. It is curious that cells use the same regulatory system for multiple DNA repair pathways. While the pathways have not previously been known to be linked, they are related in that both DSBs and replication blockage present a decision point for the cell. A DSB can be repaired via quick, albeit error-prone, NHEJ or through high-fidelity HDR. Similarly, a replication fork can proceed past a lesion using mutagenic TLS or more energy- and time-intensive, error-free pathways of fork regression or template-switching bypass48. TRIP13 is thus positioned to play a critical role in the choice between mutagenic and high-fidelity pathways.
We further show that TRIP13 activity is clinically relevant. Previous studies have noted that TRIP13 is overexpressed in various cancers and is a negative prognostic marker49–51. Intriguingly, biallelic loss-of-function TRIP13 mutations were recently reported in Wilms tumors, and these cells expectedly have an SAC defect52. Whether they additionally have lower HDR capacity and chemotherapeutic resistance is an important question for future study.
While we have learned a great deal about PARPi resistance mechanisms through the discovery of 53BP1, RIF1, Shieldin and CST-Polα, there has been little progress in identifying a druggable target. As an enzymatic, negative regulator of the Shieldin complex, TRIP13 is an ideal drug target. It is of great clinical importance to further explore the utility of TRIP13 inhibition to potentiate the clinical effectiveness of PARPis.
Online Methods
Cell Culture and transfections
Human HeLa, HEK293T and U2OS cells were grown in DMEM (Invitrogen), SUM149PT and RPE-1 cells were cultured in DMEM-F12 (Invitrogen), and HCC1937 cells were maintained in RPMI (Invitrogen) medium, all supplemented with 10% Fetal Calf Serum (FCS) and penicillin-streptomycin (1%). Breast and ovarian cell lines used in Fig. 6 were cultured according to recommendations in the literature. DNA transfections and siRNA knockdowns were performed using Lipofectamine LTX (Invitrogen) and RNAiMax (Invitrogen) respectively according to the manufacturer’s protocols. RNAi target sequences used in this study are: CAGGGTATCGACGATTACAAA (siCtrl), AAGATGCAGCTTTACGTGGAA (siREV7), TTGGGACAGCTTGGTATACGA (siTRIP13–1), AAGCAAATCACTGGGTTCTAC (siTRIP13–6), TGTCTGATCACTGAACGGAAA (siMAD2), TTGAAGAATGCAGGTTTAATA (siBRCA2).
Antibodies and chemicals
Antibodies used in this study were: Santa Cruz sc-135977 (REV7, IF, 1:100 dilution), Abcam ab180579 (REV7, IB, 1:1000 dilution), Abcam ab128171 (TRIP13, 1:1000 dilution), Cell Signaling 2144 (Tubulin, 1:5000 dilution), Novus NB100544 (pRPA32 S33, IF, 1:5000 dilution), Santa Cruz sc-8349 (RAD51, IF, 1:100 dilution), Cell Signaling 4937 (53BP1, IF, 1:1000 dilution), Bethyl A300–569A (RIF1, IF, 1:1000 dilution), Santa Cruz sc-138 (GST, 1:1000 dilution). Mitomycin C (MMC) was purchased from Sigma and Olaparib was purchased from Selleckchem.
Mass spectrometry analysis of Tandem Affinity Purified protein complexes
Purified protein complexes from three independent biological replicates were analyzed by mass spectrometry as described with minor modifications1: Cysteine residues were first reduced with 10 mM DTT for 30 minutes at 56 °C in the presence of 0.1% RapiGest SF (Waters) and subsequently alkylated with 20 mM iodoacetamide for 20 minutes at room temperature in the dark. Proteins were digested overnight at 37 °C using 5 micrograms of trypsin after adjusting the pH to 8.0 with Tris. Digests were acidified by adding trifluoroacetic acid (TFA) to a final concentration of 1% and incubated at 37°C for 30 minutes. Cleaved RapiGest products were pelleted at 20.000 × g at room temperature for 10 minutes. Supernatants were desalted by batch-mode reverse phase (Poros 10R2, Applied Biosystems) solid phase extraction and concentrated in a vacuum concentrator. Peptides were solubilized in 0.1% Formic Acid containing 25% Acetonitrile and further purified by batch-mode strong cation exchange (Poros 10HS, Applied Biosystems). Peptides were finally eluted with 0.1% formic acid containing 25% acetonitrile and 300 mM KCl and concentrated by vacuum centrifugation. Purified peptides were loaded onto a precolumn (4 cm × 150 μm POROS 10R2, Applied Biosystems) and eluted with an HPLC gradient (NanoAcquity UPLC system, Waters; 10%–40% B in 60 min; A = 0.2 M acetic acid in water, B = 0.2 M acetic acid in acetonitrile). Peptides were resolved on a self-packed analytical column (50 cm × 150 μm Monitor C18, Column Engineering) and introduced in the mass spectrometer (Q Exactive HF mass spectrometer, Thermo) equipped with a Digital PicoView electrospray source platform (New Objective). The spectrometer was operated in data dependent mode where the top 10 most abundant ions in each MS scan were subjected to HCD fragmentation (30% normalized collision energy) and subjected to MS2 scans. Dynamic exclusion was enabled with a repeat count of 1 and exclusion duration of 30 seconds. Peak lists were extracted using multiplierz scripts2–4and converted into a Mascot generic file format (.mgf). Spectra were searched using Mascot (version 2.6) against three appended databases consisting of: i) human protein sequences (downloaded from RefSeq on 07/11/2011); ii) common lab contaminants and iii) a decoy database generated by reversing the sequences from these two databases. Precursor tolerance was set to 10 ppm and product ion tolerance to 0.02 Da. Search parameters included trypsin specificity with up to 2 missed cleavages, fixed carbamidomethylation (C, +57 Da) and variable oxidation (M, +16 Da). Spectra matching to peptides from the reverse database were used to calculate a global false discovery rate and were discarded. Data were further processed to remove peptide spectral matches (PSMs) to the forward database with an FDR greater than 1.0%. Peptides shared by two or more genes were excluded from consideration when constructing the final protein list. Protein abundance was estimated based on the average MS signal response for the three most intense gene-unique tryptic peptides5. We generated the final list of binding partners as follows: Proteins identified in any of a set of 108 negative control TAP experiments6 or in any of the 3 control TAP experiments performed alongside the 3 REV7 TAP experiments were excluded from consideration. Finally, we only considered binding partners identified and quantified in at least 2 of the 3 replicate REV7 purifications.
Immunoprecipitation
Cells were first lysed in 150 mM NaCl NP40 buffer for 30 minutes with rocking at 4 °C. Clarified lysates were then incubated with the appropriate antibody-bead conjugate from between 2 hours to overnight at 4 °C. Beads were washed at least three times with 150 mM NaCl NP40 buffer and immunoprecipitates were eluted either by competition with 0.5 mg/mL FLAG peptide or by boiling.
Drug sensitivity and functional cell-based reporter assays
To assess clonogenic survival, cells were twice transfected with the indicated siRNAs over 48 h, collected and seeded at a low density (1000–3000 cells/well) in 6-well plates in triplicates. Drugs at the indicated doses were added after 12 hours and cells were allowed to grow for 14 days. Colony formation was scored by fixing and staining with 0.5% (w/v) crystal violet in methanol. For short term survival assays, siRNA-transfected cells were plated in 96-well plates at 1000 cells/well, and treated with drugs at the indicated concentration after 12 hours. Three days later, cellular viability was assayed using CellTiterGlo (Promega). Survival at each drug concentration for both clonogenic and CellTiterGlo assays was calculated as a percentage relative to the corresponding untreated control. Direct repeat homologous recombination efficiency was measured using the U2OS DR-GFP reporter cell line as previously described7.
Generation of knockout cell lines with CRISPR-Cas9
All guide RNA sequences were cloned into the pSpCas9(BB)-2A-GFP vector, a gift from Feng Zhang (Addgene plasmid # 48138). Cells were transfected with Cas9-gRNA plasmids and 48 hours later, GFP+ cells were selected and seeded as single cells using a BD FACSAria II cell sorter. Single cells were grown for approximately three weeks and colonies were screened for knockouts by western blotting. The guide RNA target sequences used in this study were GAGGTCTTGTCGTGTGAGCG (REV7), CGAGTCGCCAACGGTCCACG (TRIP13 #1), CACGTGGACCGTTGGCGACT (TRIP13 #2).
Cellular fractionation and immunoblot analysis
Cells were lysed with NP40 buffer (1% NP40, 300 mM NaCl, 0.1 mM EDTA, 50 mM Tris pH 7.5) supplemented with protease inhibitor cocktail (Roche). Cell lysate was resolved by gel electrophoresis using NuPAGE Novex gels (Invitrogen), and proteins were transferred onto nitrocellulose membranes, sequentially incubated with primary and secondary antibodies and detected by chemiluminescence. For chromatin fractionation, cell pellets obtained above were resuspended in MNase buffer (1% NP40, 150 mM NaCl, 1 mM EDTA, 50 mM Tris pH 7.5, 0.5% NP40, 10% Glycerol, 2mM CaCl2) with MNase (Roche) at a final concentration of 3 U/ul and incubated at 37 °C with shaking for 15 minutes. An equal volume of 2X HA-IP buffer (1% NP40, 150 mM NaCl, 1 mM EDTA, 50 mM Tris pH 7.5, 0.05% NP40, 10% Glycerol) was added and tubes were incubated on ice for 15 minutes. The supernatant was collected after spinning at maximum speed, and chromatin-bound proteins were precipitated using 50% TCA (trichloroacetic acid) and resuspended in NP40 buffer. Fractions were probed with different antibodies using gel electrophoresis.
Protein purification
cDNA encoding REV7R124A and REV7R124A, Δseatbelt were cloned into the pET28a vector with an N-terminal His-tag fusion. TRIP13 and SHLD3 cDNA were closed into pGEX-GP6 with an N-terminal GST-tag fusion, TRIP13 was cloned with a TEV-cleavable His tag C-terminal to GST. Proteins were expressed in BL21 (DE3) or BL21 (DE3) Rosetta E. coli strains (EMD Millipore). Expression was induced by addition of 1 mM IPTG at 16 °C to logarithmically growing cultures. Cells were lysed in lysis buffer (50 mM Tris-HCl, pH 7.5, 350 mM NaCl, 20 mM Imidazole, 0.5 mM EDTA, 1 mM DTT, 1 mM PMSF, 10% Glycerol for His-purification; 1xPBS + 150 mM NaCl, 0.5 mM EDTA, 1 mM DTT, 1 mM PMSF for GST-purification) by successive freeze-thaw cycles followed by sonication. Lysates were incubated with Ni-NTA agarose (Qiagen) or Glutathione agarose (Life technologies) for 1–4 hours and beads were then washed with wash buffer (50 mM Tris-HCl, pH 7.5, 1 M NaCl, 20 mM Imidazole, 0.5 mM TCEP, 10% Glycerol for His-purification; 1xPBS + 350 mM NaCl, 0.5 mM TCEP for GST-purification) and eluted with 300 mM Imidazole for His-purification or 10 mM reduced glutathione for GST-purification. The GST tag was cleaved from TRIP13 using Prescission protease (GE Healthcare) and His-TRIP13 was subjected to another round of purification using the above protocol. The His-tag was subsequently cleaved by TEV protease (Sigma Aldrich).
Analytical and Preparative Protein Chromatography
Size exclusion and anion exchange chromatography were performed using an AKTApurifier system. SEC was performed using the Superdex Increase 10/300 column (GE Healthcare) and AEC was performed using the HiTrap Q HP 1 mL column (GE Healthcare). For purified REV7, the eluate was concentrated to 500 μL and injected onto the SEC column equilibrated with buffer A (20 mM Tris-HCl, pH 7.5, 20 mM NaCl, 0.5 mM TCEP, 10% Glycerol), 500 μL fractions were eluted and analyzed by SDS-PAGE and Coomassie Blue staining. Fractions containing monomeric REV7 were pooled and directly injected into the AEC column, 500 μL fractions were eluted as a gradient of 0%−50% Buffer B (20 mM Tris-HCl, pH 7.5, 1 M NaCl, 0.5 mM TCEP, 10% Glycerol). Fractions were again analyzed by SDS-PAGE and either Coomassie staining or western blotting. The REV3 SBM used for C-REV7 stabilization experiments was N-terminally biotinylated RTANILKPLMSPPSREEIMA (Selleck). For SEC on cell lysates, 300 μL of clarified cell lysate was injected onto the SEC column equilibrated with 50 mM Tris pH 7.5, 150 mM NaCl, 0.5 mM EDTA, 10% Glycerol and 500 μL fractions were collected. To enhance signal, proteins in each fraction were precipitated using TCA and the protein was dissolved in 20 μL SDS loading buffer and loaded for SDS-PAGE. Endogenous REV7 was visualized by western blot.
15N-labelled HSQC NMR
The 15 N-HSQC spectra of 15 N-labeled REV7 proteins were acquired in 20 mM HEPES, 100 mM NaCl, 10 mM DTT, pH 7.4 with 10% D2O at 25°C, on a 600 MHz Bruker Avance II spectrometer with a Prodigy cryoprobe. The data was collected with 48 number of scans, 512 complex points in the direct 1 H dimension and 64 complex points in the 15 N indirect dimension.
GST pulldowns
GST-tagged proteins were expressed in the Rosetta (DE3) E. coli strain by induction with 1 mM IPTG overnight at 16 °C. Lysates were incubated with glutathione agarose beads (Thermo Scientific) for 4 hours. Beads were then washed sequentially with PBS with 300 mM NaCl and PBS with 500 mM NaCl. Beads were then rinsed with 150 mM NaCl NP40 buffer and purified REV7 was added, after adjusting salt concentrations to 150 mM NaCl as required. Beads-REV7 mixture was then incubated overnight with rocking at 4 °C. The beads were washed at least three times with 150 mM NaCl NP40 buffer and GST-protein complexes were eluted with 10 mM reduced glutathione and analyzed by western blotting.
ATPase Assays
TRIP13 ATPase activity was measured using the ADP-Glo Kit (Promega). Purified TRIP13 was diluted to the appropriate concentration in ATPase dilution buffer such that the final buffer makeup was 25 mM Tris-HCl pH 7.5, 200 mM NaCl, 10 mM MgCl2, 1 mM DTT, 5% glycerol8 with 1 mM Ultrapure ATP (Promega). 5 μL reactions were set up in triplicate in opaque 384 well plates and allowed to proceed for various times. The reaction was stopped by the addition of 5 μL ADP-Glo reagent. 10 μL of Kinase detection reagent and ATP consumption was measured by the luminescence generated from each well.
In vitro TRIP13 dissociation assays
Glutathione-agarose bound REV7-SHLD3 complexes were pre-assembled by incubation of beads with GST-SHLD3 followed by incubation with His-REV7 and washing to remove any unbound protein. The SHLD3:REV7 bound beads were then incubated with purified TRIP13 in assay buffer (25 mM Tris-HCl pH 7.5, 200 mM NaCl, 10 mM MgCl2, 1 mM DTT, 5% glycerol) with or without addition of 2 mM ATP or AMP-PNP. The tubes were shaken at 37 °C. At various timepoints, aliquots were collected from the reaction and the soluble, unbound fraction was separated from the complex-bound beads using spin columns (EMD Millipore). The collected samples were then analyzed by SDS-PAGE and western blotting for REV7.
SMART DNA fiber assays
The SMART assay procedure was largely performed as described9. Cells were grown in the presence of BrdU for 24 hours to label genomic DNA. Cells were then exposed to X-ray irradiation to induce DSB formation. Cells were harvested 6 hours following irradiation. To avoid DNA breakage, cells were encased in low melting point agarose plugs prior to lysis overnight in 0.5 M EDTA, 1% Sarkosyl with proteinase K (Fisher) at 50 °C. Genomic DNA containing plugs were then washed with TE buffer. The plugs were then placed in spreading buffer (0.5 M MES pH 5.5) and melted at 68 °C; agarose was digested by overnight incubation at 42 °C with β-Agarase (NEB). The next day, the genomic DNA solution was spread onto silanized coverslips using the Fiber Comb system (Genomic Vision). Combed coverslips were then dried in a 65 °C oven for 2 hours prior to blocking with 3% BSA for 30 minutes at 37 °C.
Coverslips were then incubated with primary αBrdU antibody (GE Healthcare) in 3% BSA overnight at 4 °C. The following day, coverslips were washed with PBST and incubated with secondary Alexa 594 labelled Goat αMouse antibody (Life Technologies) for 30 minutes at 37 °C. Coverslips were again washed and mounted on slides with Vectashield mounting medium (Vector laboratories). Images were captured using a Zeiss AX10 fluorescence microscope and Zen software and fiber lengths were measured using ImageJ. At least 100 fibers were scored per condition.
Immunofluorescence assays
Cells were plated on glass cover slips in 12-well plates the previous day. They were then either left untreated or irradiated at the indicated doses and harvested at the indicated time points by pre-extracting with 0.5% Triton X-100 for 5 min, followed by fixation with 4% paraformaldehyde for 10 min at 4 °C. For REV7 foci, an additional 10 min methanol extraction step was performed. The wells were washed three times with PBS, blocking was done with 3% BSA in PBS for 1 hour at room temperature, followed by primary and secondary antibody incubations for 1 hour at room temperature or overnight at 4 °C. The coverslips were then mounted into glass slides with DAPI-containing medium (Vector Laboratories). Foci were scored and images were captured using a Zeiss AX10 fluorescence microscope and Zen software. At least 100 cells were counted for each sample.
Chromosomal breakage analysis
HEK293T cells were transfected twice with the indicated siRNAs or once with the indicated expression constructs and incubated for 48 hours with or without the indicated doses of MMC. Cells were treated for 2 hours with 100 ng/ml of colcemid, followed by a hypotonic solution (0.075 M KCl) for 20 min and fixed with 3:1 methanol/acetic acid. Slides were stained with Wright’s stain and 50 metaphase spreads were scored for aberrations. The relative number of chromosomal breaks and radials was calculated relative to control cells or empty vector control as indicated in the figure legends.
SupF mutagenesis assay
SupF assays were performed mainly as described previously10. In brief: HEK293T cells treated with the indicated siRNAs were transfected with either undamaged or UVC-treated (1000 J/m2 using a 2400 UV Stratalinker) pSP189 plasmid using Lipofectamine LTX reagent. Repair was allowed to proceed for 48 hours, after which plasmid DNA was retrieved from the cells using the Wizard Plus SV miniprep kit (Promega). Unreplicated plasmid DNA was eliminated by a DpnI digest and repaired plasmid was precipitated by ethanol and electroporated into MBM7070 reporter bacterial strain with an amber mutation in the β-galactosidase gene. Transformed bacteria were plated onto media containing 100 μg/ml ampicillin, 1mM isopropyl-1-thio-b-D-galactopyranoside (IPTG) and 100 μg/ml X-gal. Mutant colonies were detected as white colonies, and mutation frequency was scored as the ratio of white to total number of colonies.
TCGA data acquisition and analysis
TCGA mutation and expression data was downloaded from cBioportal11,12. The METABRIC data set was used for survival analysis and TRIP13 expression in BRCA1 mutant breast cancers13. For the breast cancer analysis, tumors were stratified by median TRIP13 expression, ovarian cancers were stratified by presence or absence of TRIP13 amplification. Mutation signature analysis was done for breast cancer using the TCGA 2012 dataset, with signature data acquired from mSignatureDB14,15. For this analysis, tumors were stratified by median TRIP13 expression.
Statistical analysis
Data are represented as mean ± SEM for n=2 or more independent experiments. For clonogenic survival assays, significance was calculated using 2-way ANOVA tests. For focus formation and DR-GFP assays, significance was calculated using the Student’s 2-tailed t-test. For the SMART assay, significance was determined using the Mann-Whitney test. For survival analysis of TCGA data, significance was determined using the Gehan-Breslow-Wilcoxon test. For mutation signature and TRIP13 expression analysis from TCGA data significance was determined using the Mann-Whitney test. All statistical analysis was performed using GraphPad Prism 6 software (GraphPad Software).
Data availability
Mass spectrometry data will be deposited in MASSive data repository upon publication (https://massive.ucsd.edu/ProteoSAFe/static/massive.jsp).
All TCGA breast cancer data was accessed from the METABRIC study through cBioportal (https://www.cbioportal.org/study/summary?id=brca_metabric).
Mutation signature data was accessed from mSignatureDB (http://tardis.cgu.edu.tw/msignaturedb/).
All other data supporting the findings of this study are available from the corresponding author on reasonable request.
Extended Data
Extended Data Fig. 1. Organization and physical interaction of TRIP13 with Shieldin, and lack of contribution of MAD2 to HDR repair.
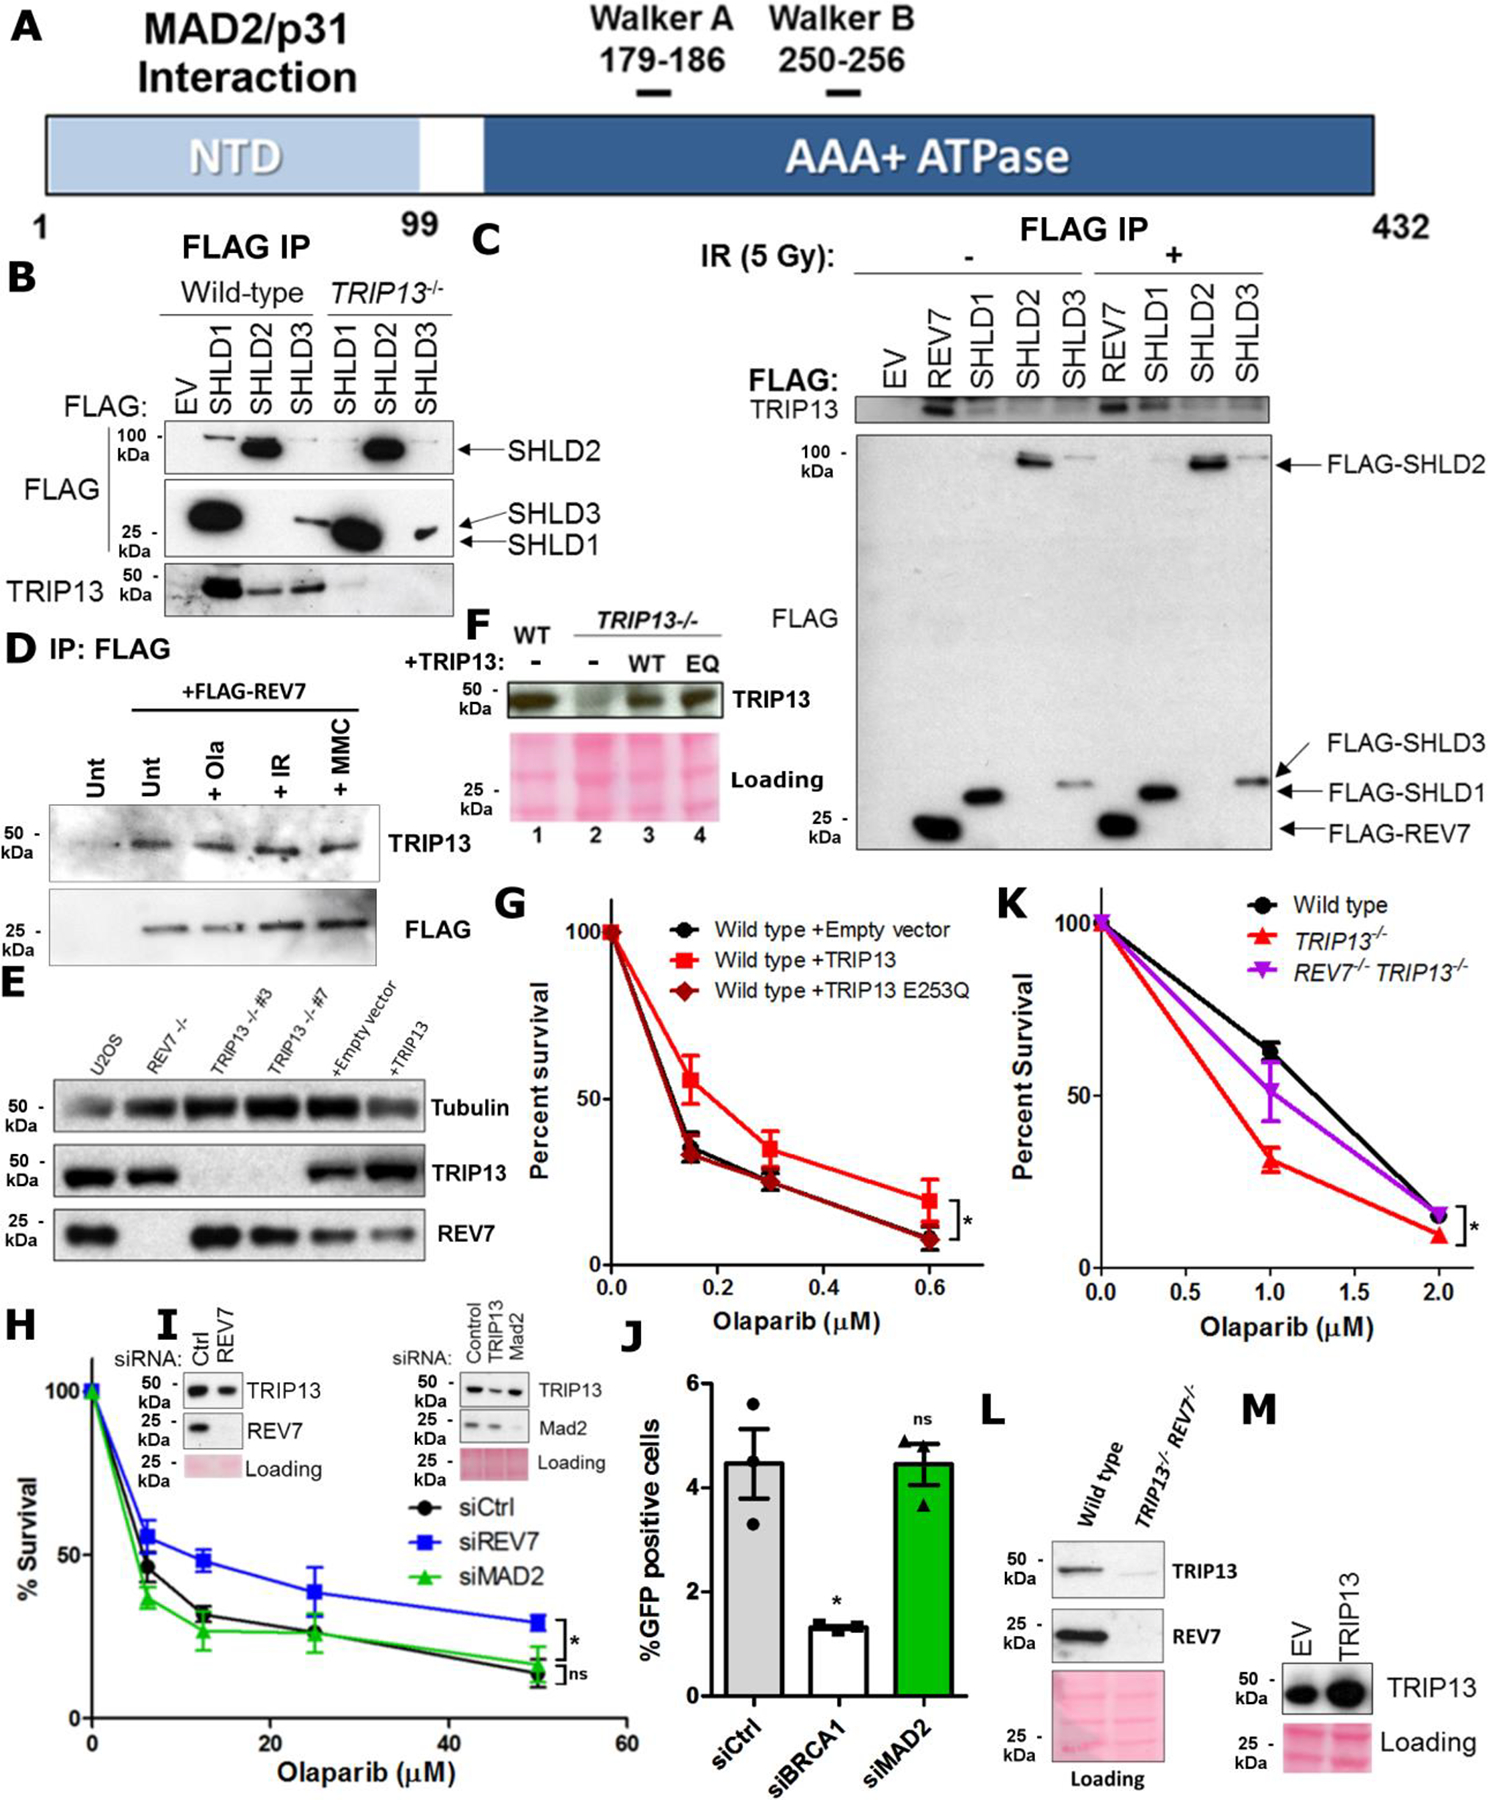
a. Schematic of TRIP13 functional domains. b. Western blot of FLAG IP from HEK293T cells transfected with FLAG-empty vector or FLAG-REV7, SHLD1, SHLD2 or SHLD3. c. Repeats of pulldowns in (b) with or without DNA damage. d. Western blot FLAG-REV7 IPs showing the interaction with endogenous TRIP13 following treatment with the indicated DNA damaging agents. e. Western blot of REV7 and TRIP13 from U2OS wild type, REV7−/−, TRIP13−/−, pBabe empty vector and pBabe-TRIP13. f. Western blot showing the expression of Wild-type and E252Q ATPase-dead forms of TRIP13. g. 14-day clonogenic survival assay of U2OS cells expressing Empty vector, wild-type TRIP13 or TRIP13-E253Q treated with indicated doses of olaparib. n=3 biologically independent experiments, Empty vector vs. TRIP13 wild-type: p = 0.005, Empty vector vs. TRIP13-E253Q: p = 0.81 (2-Way ANOVA). h. 5-day cytotoxicity analysis of U2OS cells transfected with nontargeting, REV7- or MAD2-targeted siRNA and treated with indicated doses of Olaparib. n=3 biologically independent experiments, siCtrl vs siREV7: p < 0.0001, siCtrl vs. siMAD2: p = 0.12 (2-Way ANOVA). i. Western blot showing knockdown of MAD2 and REV7 in U2OS cells used for (h). j. Percentage of GFP-positive cells following infection of U2OS DR-GFP cells with I-SceI adenovirus with knockdown of BRCA1 or MAD2. n=3 biologically independent experiments, siCtrl vs. siBRCA1: p = 0.009, siCtrl vs. siMAD2: p = 0.99. k. 14-day clonogenic survival assay of wild-type, TRIP13−/− or TRIP13−/− REV7−/− U2OS cells treated with indicated doses of olaparib. n=3 biologically independent experiments, TRIP13−/− vs. TRIP13−/− REV7−/−: p = 0.02 (2-Way ANOVA). l. Western blot showing REV7−/− TRIP13−/− double knockout cell lines. m. Western blot showing overexpression of TRIP13 in HCC1937 cells. All error bars indicate SEM. All immunoblots are representative of at least 2 independent experiments.
Extended Data Fig. 2. Characterization of the REV7 conformers and REV7 seatbelt interactions.
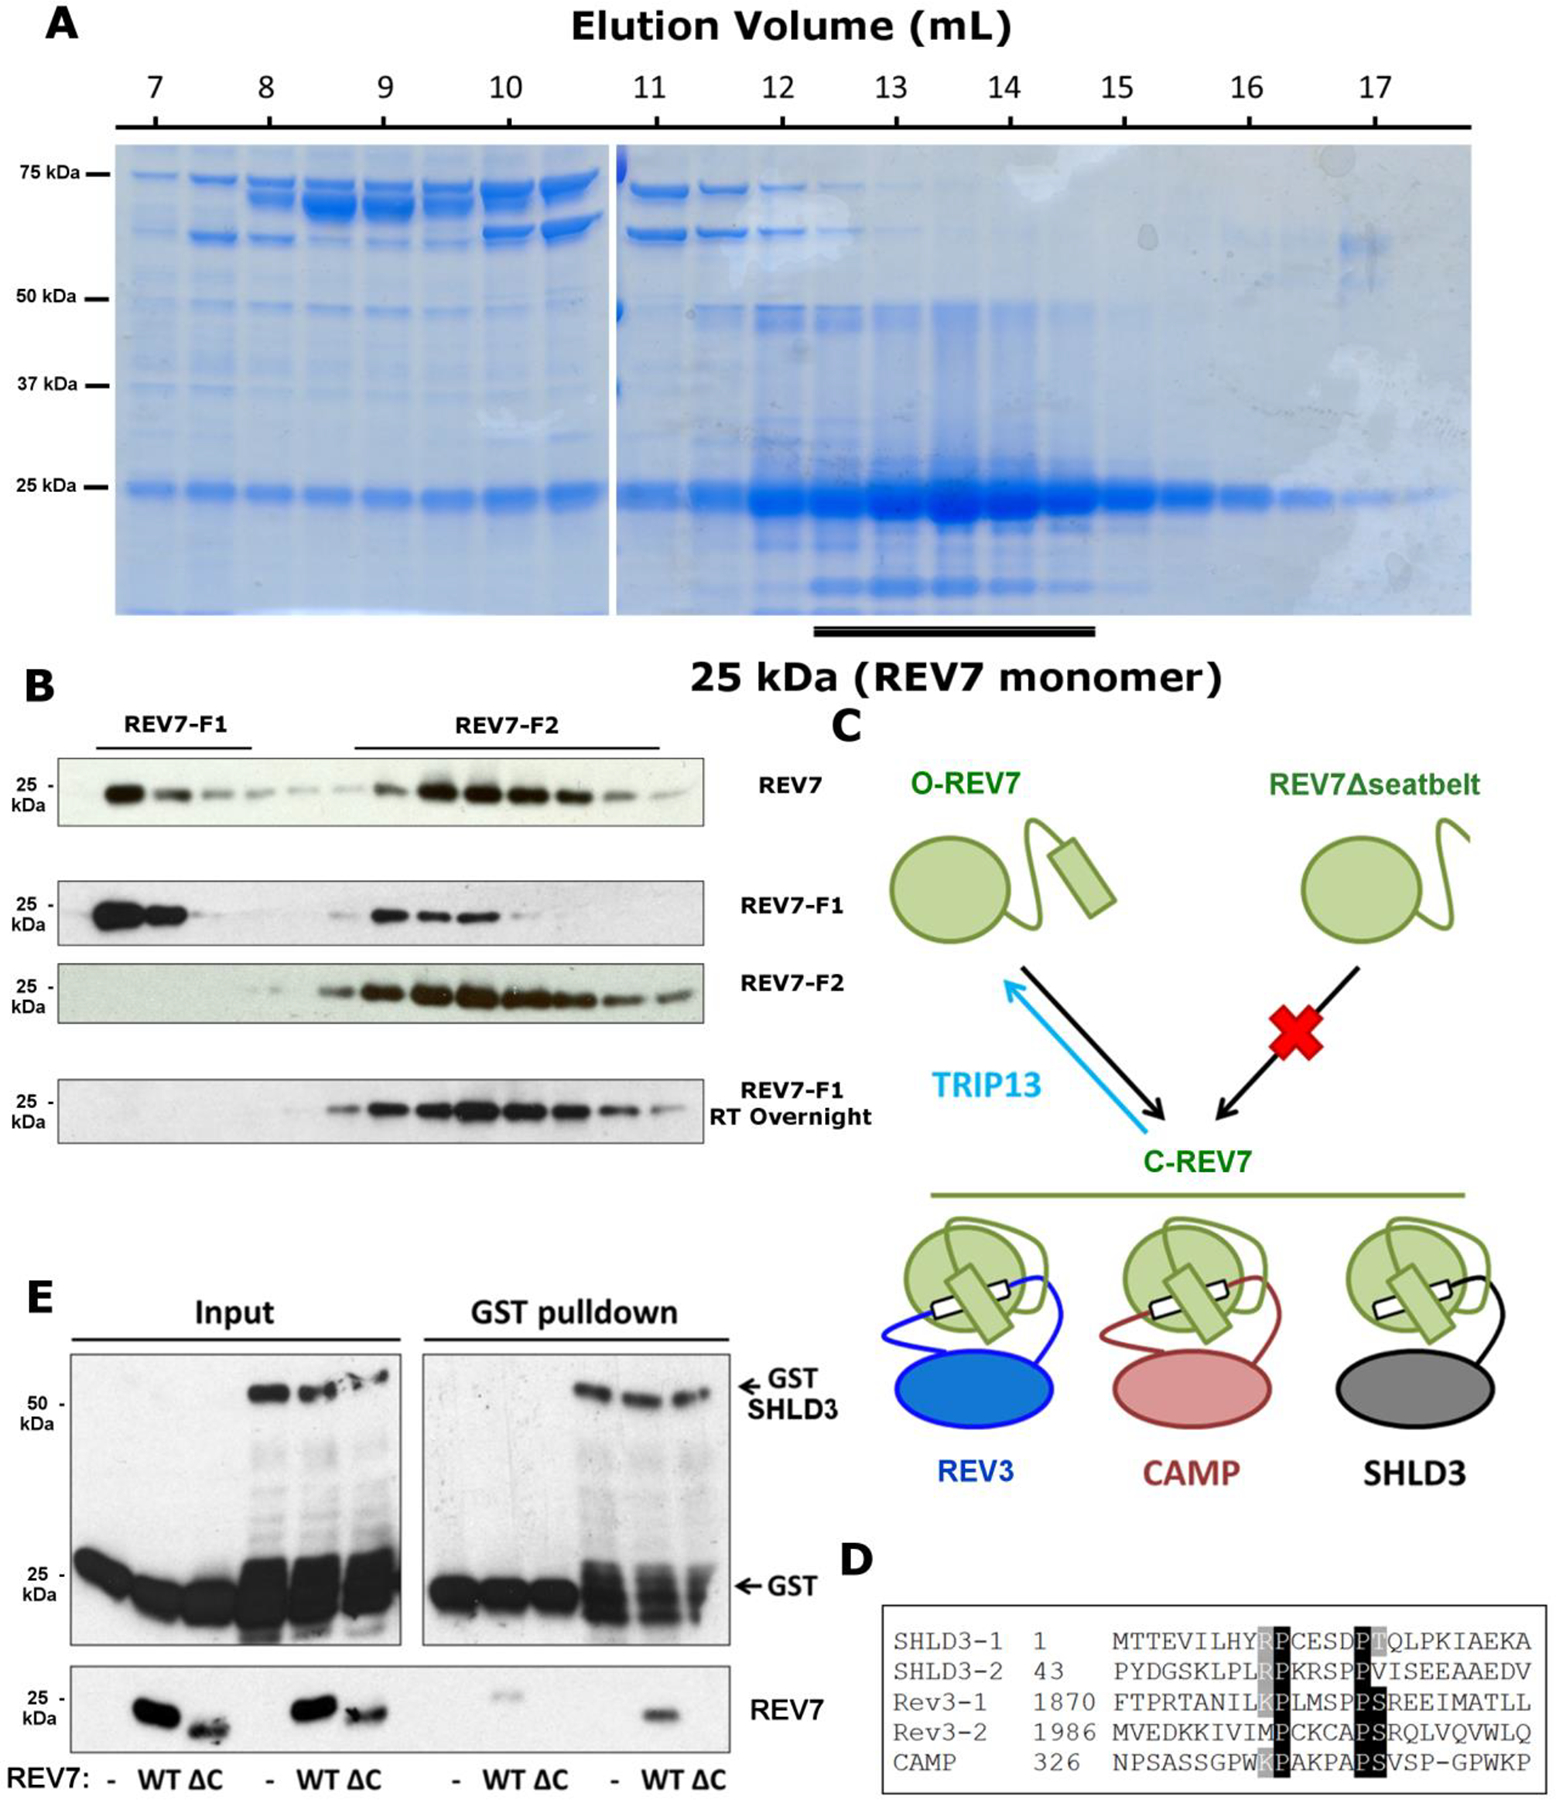
a. Elution profile of purified REV7 upon size exclusion chromatography. b. From top to bottom: western blot of REV7 AEC fractions from total purified REV7, isolated REV7-F1, isolated REV7-F2 and isolated REV7-F1 after overnight incubation at 37 °C. c. Schematic of TRIP13 regulation of seatbelt-SBM binding. REV7 binds to REV3, SHLD3 and CAMP by adopting a closed seatbelt conformation encircling their respective SBM (in white). The REV7Δseatbelt mutant is unable to adopt the closed conformation and therefore unable to bind via its seatbelt. TRIP13 negatively regulates seatbelt-SBM interactions by promoting REV7 opening. d. Alignment of REV7 seatbelt binding motifs (SBM) from three different human proteins: REV3, SHLD3 and CAMP showing the conserved (R/K)PxxxxP(S/T) motif. e. GST pulldown of E. coli-produced GST-SHLD3 and REV7 or REV7Δseatbelt. ΔC refers to the Δseatbelt mutant form of REV7. All immunoblots and Coomassie stained gels are representative of at least 2 independent experiments.
Extended Data Fig. 3. Effect of TRIP13 on REV7 binding to Shieldin and recruitment to DNA damage.
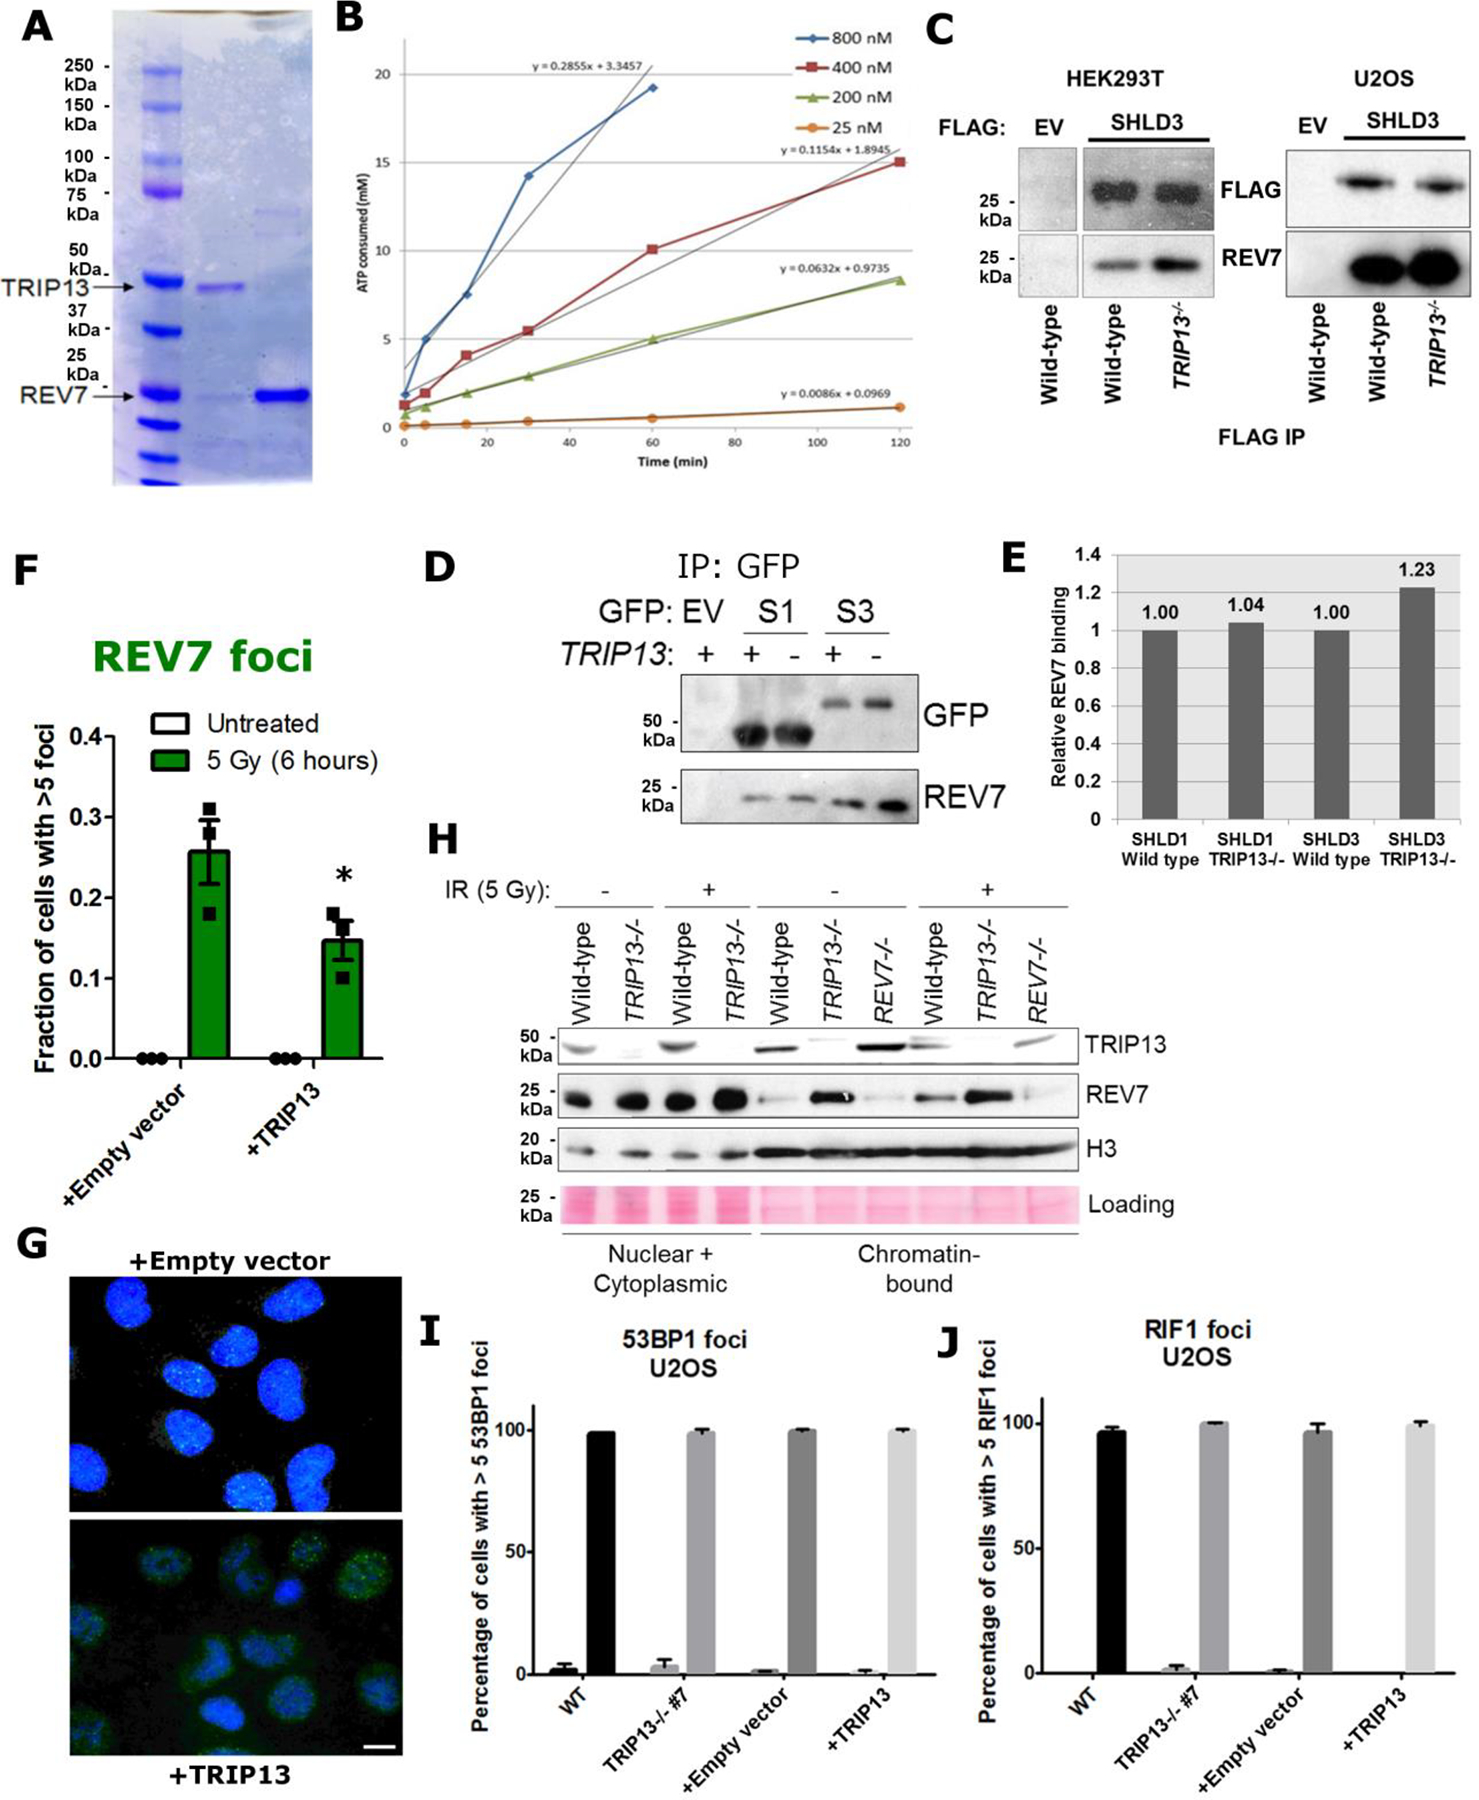
a. Coomassie-stained gel showing purification of TRIP13 and REV7. b. Measurement of ATPase activity by ADP-Glo assay with indicated concentrations of purified TRIP13 protein. c. Western blots showing co-IP of FLAG-SHLD3 and REV7 in wild-type and TRIP13−/− U2OS and HEK293T cells. d. Western blot showing co-IP of GFP-tagged SHLD1 (S1) and SHLD3 (S3) with endogenous REV7 in wild-type or TRIP13−/− cells. e. Quantification of western blot in (d). f. Proportion of U2OS cells expressing either pBabe-empty vector or pBabe-TRIP13 with more than 5 REV7 foci. n = 3 biologically independent experiments, p = 0.02 (Student’s paired t-test, two-tailed). g. Representative pictures for (e) showing REV7 focus formation 6 h after IR treatment. (Scale bar: 10 μm) h. Chromatin fractionation of REV7 in U2OS wild-type, TRIP13−/− and REV7−/− cells with or without IR treatment. Histone H3 is used as control for chromatin isolation. i. Percentage of U2OS cells forming more than five 53BP1 foci 2 hours following IR treatment. Bars show untreated (left) and irradiated (right) for each sample. j. Percentage of U2OS cells forming greater than five RIF1 foci 2 hours following IR treatment. Bars show untreated (left) and irradiated (right) for each sample. All error bars represent SEM. All immunoblots and coomassie stained gels are representative of at least 2 independent experiments.
Extended Data Fig. 4. Effects of TRIP13 knockout and overexpression in HDR assays.
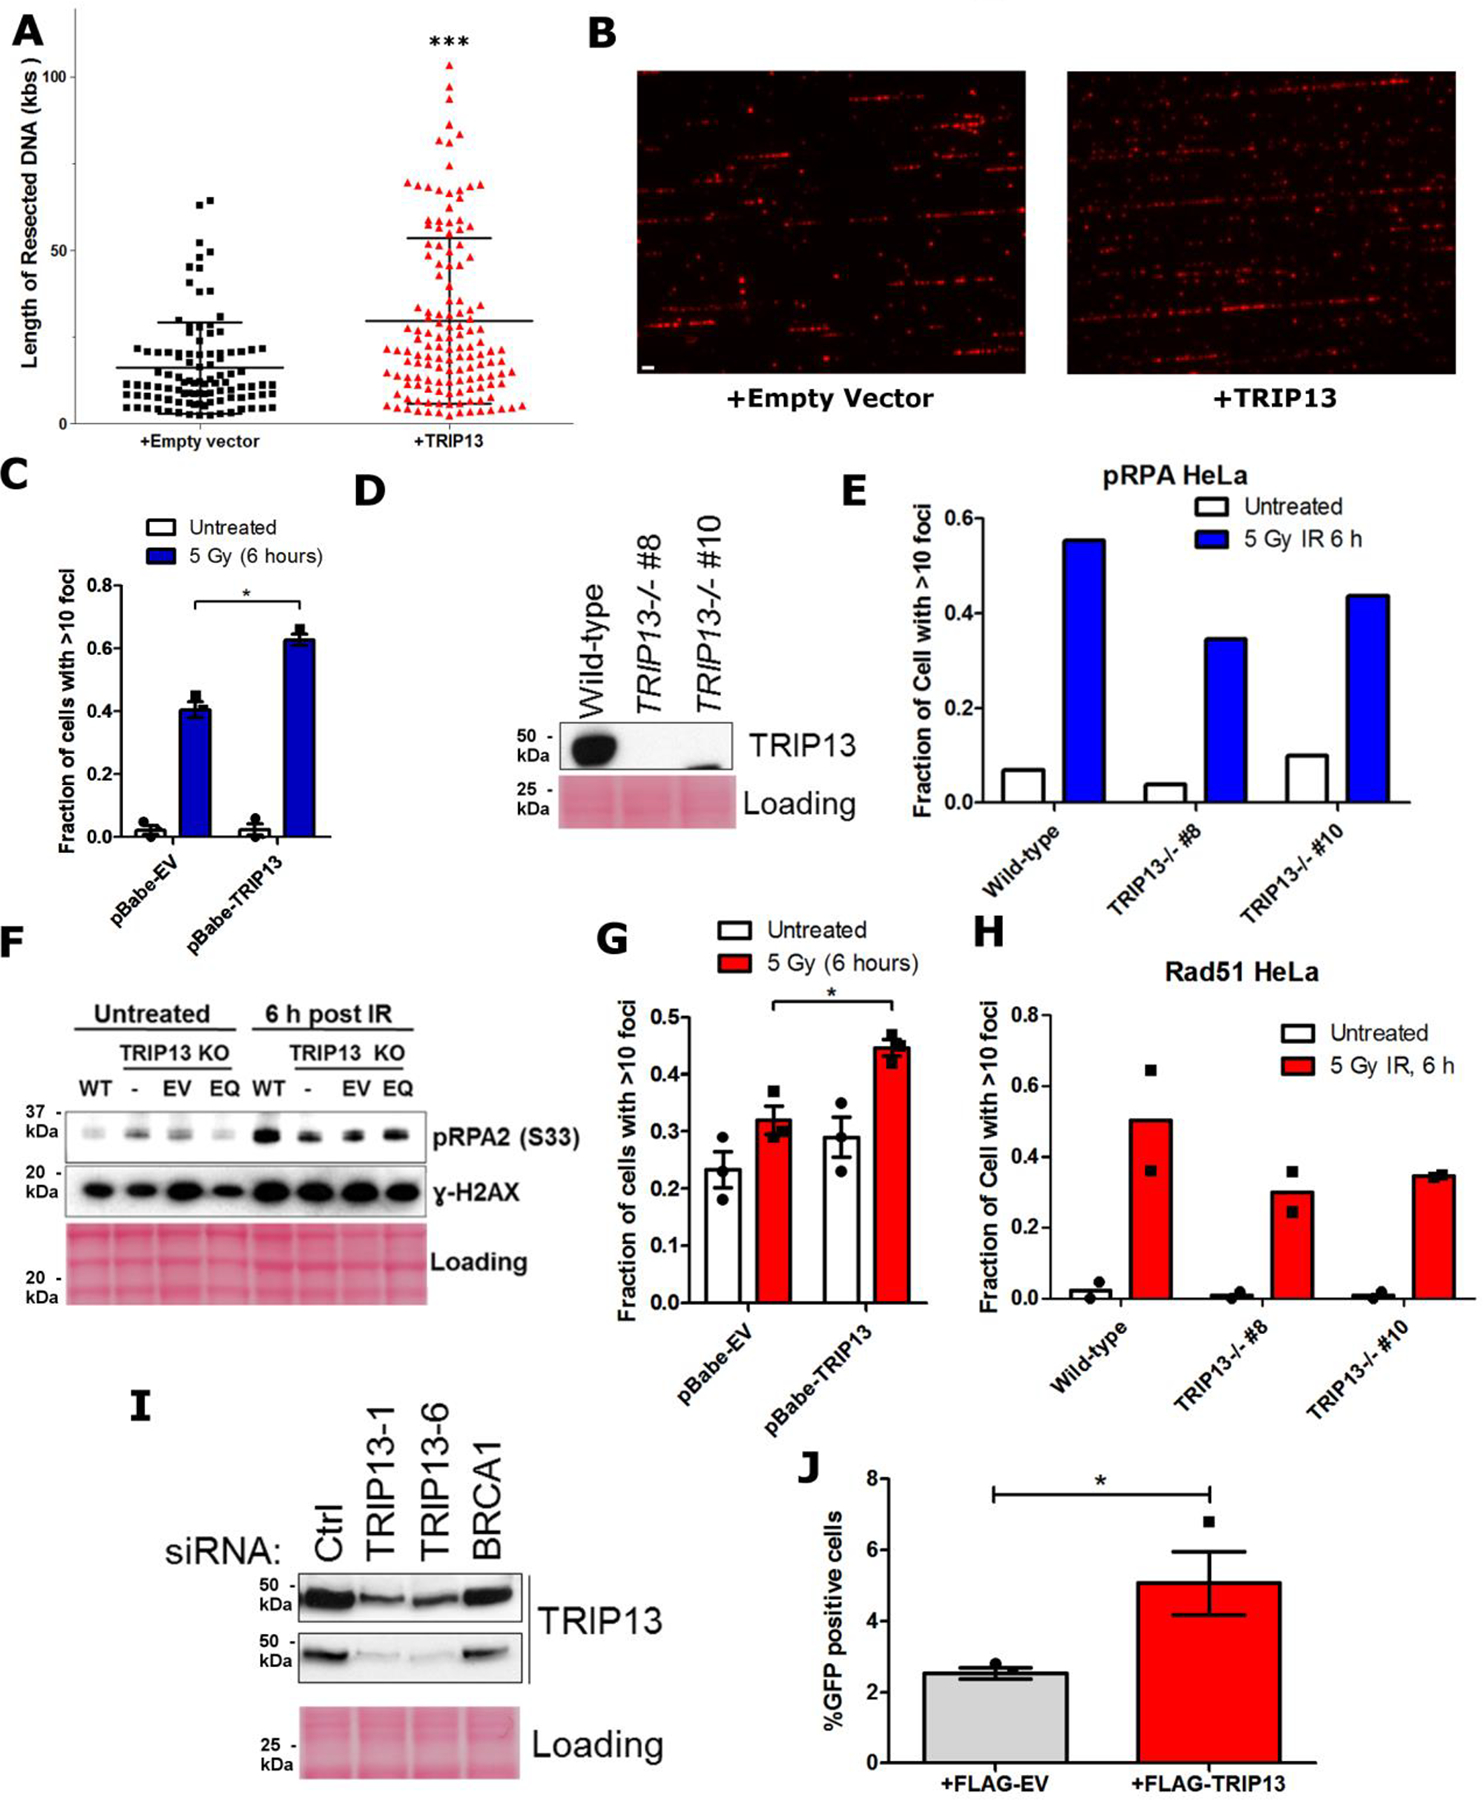
a. Quantification of resected ssDNA in U2OS cells expressing pBabe-empty vector or pBabe-TRIP13 measured by SMART assay. Lines indicate mean and SEM, n = approximately 100 fibers per genotype, p<0.0001 (Mann-Whitney test, two-tailed). b. Representative images for (a), with BrdU in exposed ssDNA tracts labeled red. (Scale bar: 1 μm) c. Proportion of U2OS cells expressing pBabe-empty vector or pBabe-TRIP13 with greater than 10 p-RPA32(S33) foci 6 hours following IR treatment. n = 3 biologically independent experiments, p = 0.002 (Student’s t-test, two-tailed). d. Western blot showing TRIP13 knockout in HeLa cells. e. Proportion of HeLa cells with greater than 10 p-RPA32(S33) foci 6 hours following IR treatment. f. Western blot showing RPA32 phosphorylation (S33) and H2AX phosphorylation, with or without irradiation in wild-type or TRIP13−/− U2OS cells, expressing Empty vector or TRIP13-E253Q. g. Proportion of U2OS cells expressing Empty vector or TRIP13 with greater than 10 RAD51 foci 6 hours following IR treatment. n = 3 biologically independent experiments, p = 0.01 (Student’s t-test, two-tailed). h. Proportion of HeLa cells with more than 10 RAD51 foci 6 hours following IR treatment. n=2 biologically independent experiments. i. Western blot showing TRIP13 knockdown for DR-GFP experiment in 4g. j. Percentage of GFP-positive cells following infection of U2OS DR-GFP cells expressing FLAG empty vector or FLAG-TRIP13 with I-SceI adenovirus. n = 3 biologically independent experiments, p = 0.05 (Student’s t-test, two-tailed). All error bars indicate SEM. All immunoblots are representative of at least 2 independent experiments.
Extended Data Fig. 5. Effects of TRIP13 deficiency in TLS assays.
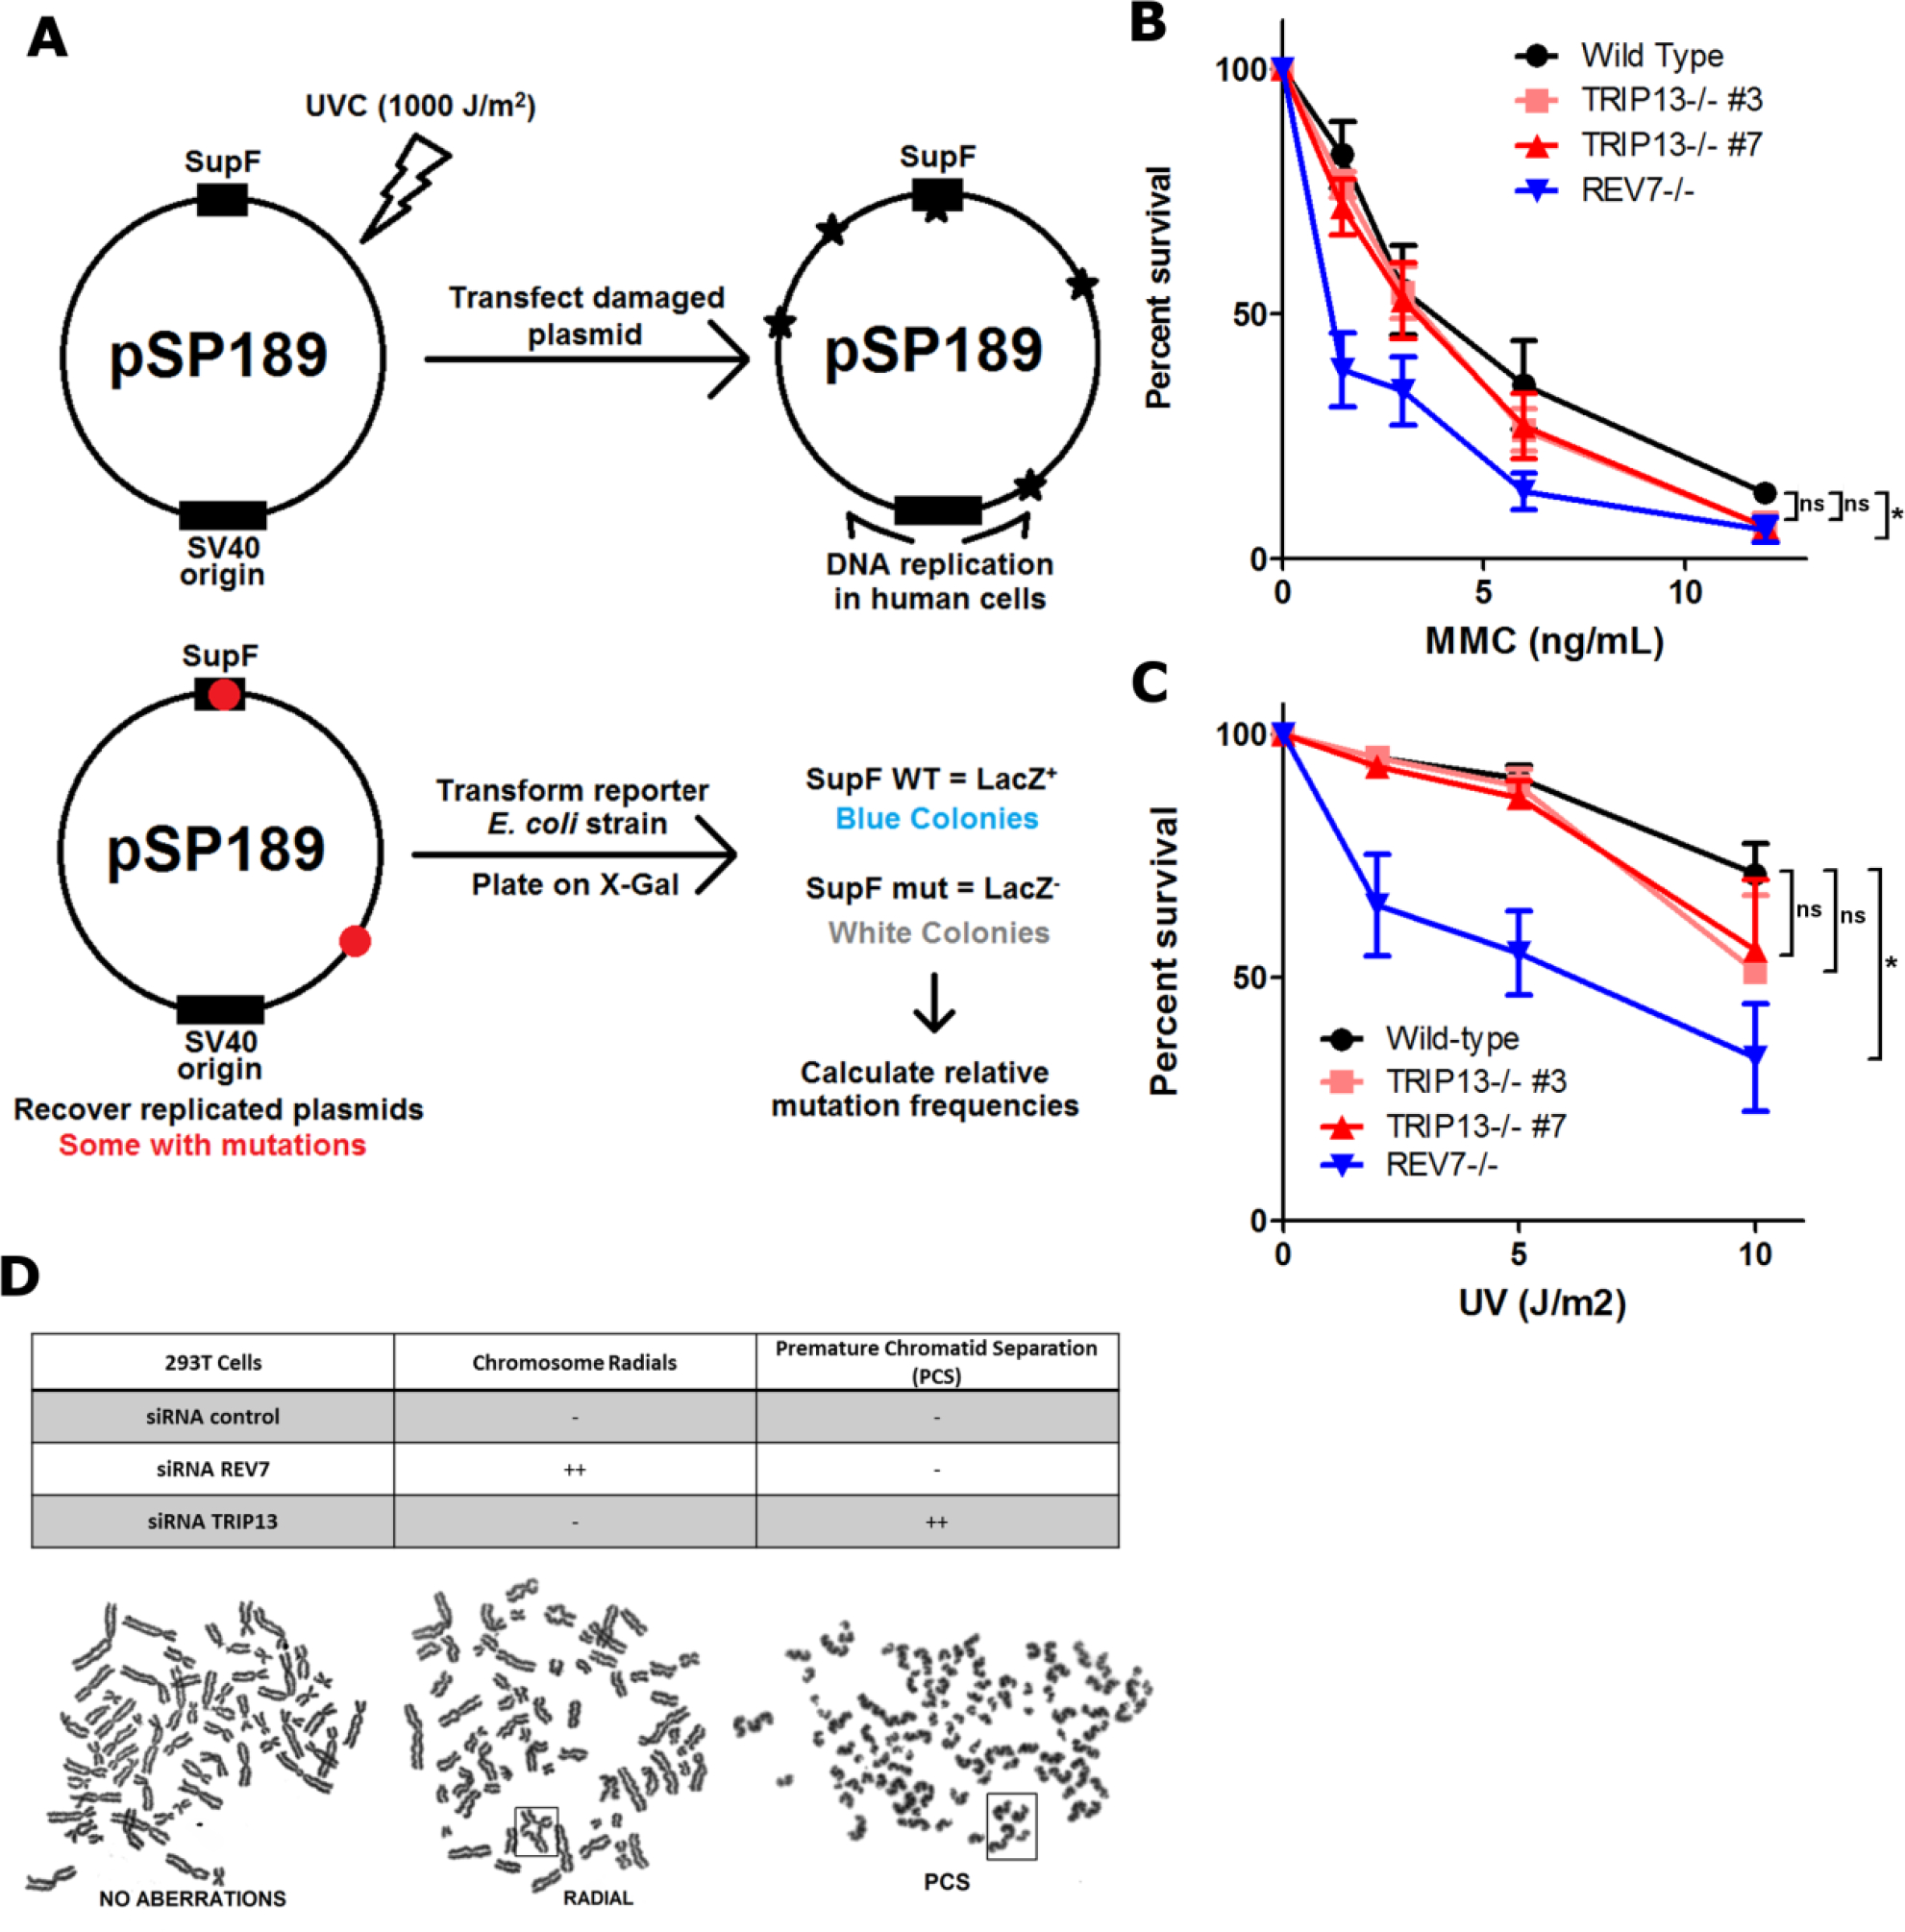
a. Schematic of the SupF assay. Plasmids are damaged by exposure to a high UV dose. Damaged plasmids are transfected into HEK293T cells and allowed to replicate, accumulating mutations. Plasmids are isolated from cells and transformed into a reporter E. coli strain. Functional SupF expression allows for readthrough of a premature stop codon in the LacZ gene. Any mutations in SupF give LacZ- colonies. b. 14-day clonogenic survival assay of U2OS wild-type, TRIP13−/− or REV7−/− cell lines treated with indicated mitomycin C (MMC) doses. n=3 biologically independent experiments, Wild-type vs. TRIP13−/− #3: p = 0.19, Wild-type vs. TRIP13−/− #7: p = 0.15, Wild-type vs. REV7−/−: p < 0.0001 (2-Way ANOVA) c. 14-day clonogenic survival assay of U2OS wild-type, TRIP13−/− or REV7−/− cell lines treated with indicated UV doses. n=4 biologically independent experiments, Wild-type vs. TRIP13−/− #3: p = 0.23, Wild-type vs. TRIP13−/− #7: p = 0.21, Wild-type vs. REV7−/−: p < 0.0001 (2-Way ANOVA). d. (Top) Table summarizing effect of nontargeting, REV7- or TRIP13-targeting siRNAs on chromosome radial formation, a hallmark of FA pathway dysfunction, and premature chromatid separation (PCS), indicative of SAC dysfunction. (Bottom) Metaphase spreads from HEK293T cells transfected with specified siRNAs showing radials and PCS in boxes.
Extended Data Fig. 6. TRIP13 alterations, expression levels and effect on Olaparib resistance in cancers, cancer cell lines and a BRCA1-deficient model.
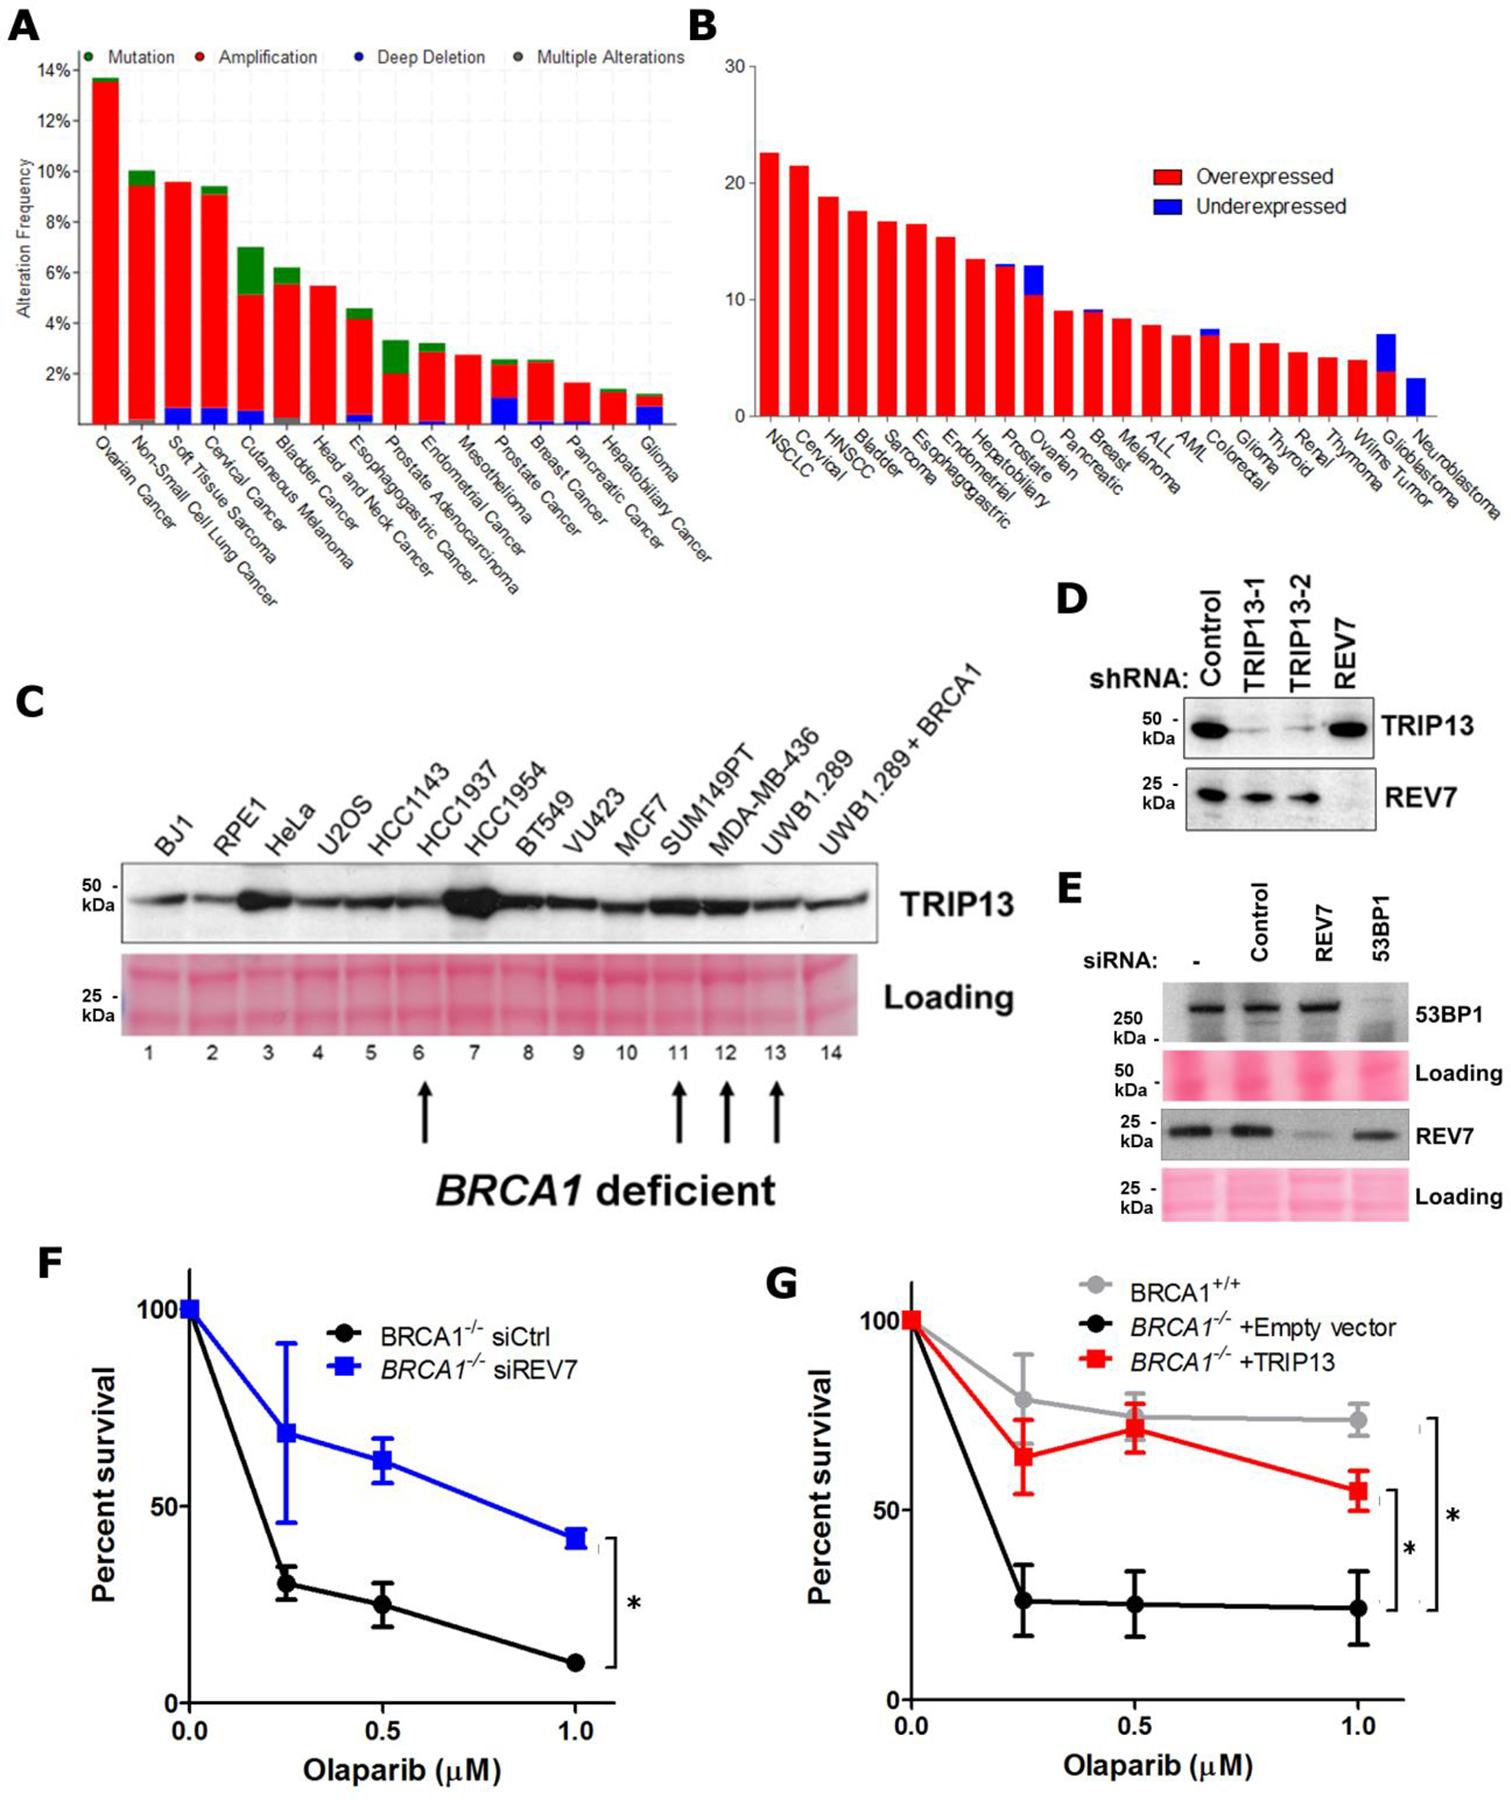
a. Summary of TRIP13 genomic alterations across various cancer types in TCGA. b. Summary of TRIP13 transcriptional alterations across various cancer types in TCGA. c. Western blot showing TRIP13 protein levels from a panel of breast and ovarian cancer cell lines and Ponceau S staining as loading control. BRCA1-mutant cell lines are indicated with arrows. d. Western blot showing knockdown of TRIP13 and REV7 in the SUM149PT cells. e. Western blot showing knockdown of REV7 and 53BP1 in SUM149PT cells. f. 14-day clonogenic survival assay of RPE-1 TP53BP1−/− and TP53BP1−/− BRCA1−/− cell lines with siRNAs targeting control, TRIP13 or REV7 and treated with indicated olaparib doses. n=3 biologically independent experiments, siCtrl vs. siREV7: p = 0.005 (2-Way ANOVA). g. 14-day clonogenic survival assay of BRCA1+/+ and BRCA1−/− cells expressing Empty vector or TRIP13 treated with indicated Olaparib doses, n=3 biologically independent experiments, BRCA1+/+ vs. BRCA1−/− +Empty vector: p <0.0001, BRCA1−/− +Empty vector vs. BRCA1−/− + TRIP13: p<0.0001 (2-Way ANOVA). All immunoblots are representative of at least 2 independent experiments.
Supplementary Material
Acknowledgements
We thank the Structural and Chemical Biology Center at DFCI for the NMR data. This research was supported by a Stand Up To Cancer-Ovarian Cancer Research Fund Alliance-National Ovarian Cancer Coalition Dream Team Translational Research Grant (Grant Number: SU2CAACR-DT16-15). Stand Up To Cancer is a program of the Entertainment Industry Foundation. Research grants are administered by the American Association for Cancer Research, the scientific partner of SU2C. This work was also supported by grants from the U.S. National Institutes of Health (R37HL052725, P01HL048546), the U.S. Department of Defense (BM110181), the Breast Cancer Research Foundation, the Fanconi Anemia Research Fund, the Ludwig Center at Harvard and the Smith Family Foundation to A.D.D., the U.S. National Institutes of Health (P01 CA203655, R01 CA215489) to J.A.M. and the Leukemia and Lymphoma Society (5440-16) and the Claudia Adams Barr Program in Innovative Basic Cancer Research to P.S.
Footnotes
Competing interests statement
J.A.M. serves on the Scientific Advisory Board of 908 Devices.
References
- 1.Chatterjee N & Walker GC Mechanisms of DNA damage, repair, and mutagenesis. Environ Mol Mutagen 58, 235–263, doi: 10.1002/em.22087 (2017). [DOI] [PMC free article] [PubMed] [Google Scholar]
- 2.Tubbs A & Nussenzweig A Endogenous DNA Damage as a Source of Genomic Instability in Cancer. Cell 168, 644–656, doi: 10.1016/j.cell.2017.01.002 (2017). [DOI] [PMC free article] [PubMed] [Google Scholar]
- 3.Ceccaldi R, Rondinelli B & D’Andrea AD Repair Pathway Choices and Consequences at the Double-Strand Break. Trends Cell Biol 26, 52–64, doi: 10.1016/j.tcb.2015.07.009 (2016). [DOI] [PMC free article] [PubMed] [Google Scholar]
- 4.Chang HHY, Pannunzio NR, Adachi N & Lieber MR Non-homologous DNA end joining and alternative pathways to double-strand break repair. Nat Rev Mol Cell Biol 18, 495–506, doi: 10.1038/nrm.2017.48 (2017). [DOI] [PMC free article] [PubMed] [Google Scholar]
- 5.Bunting SF & Nussenzweig A End-joining, translocations and cancer. Nat Rev Cancer 13, 443–454, doi: 10.1038/nrc3537 (2013). [DOI] [PMC free article] [PubMed] [Google Scholar]
- 6.Boersma V et al. MAD2L2 controls DNA repair at telomeres and DNA breaks by inhibiting 5’ end resection. Nature 521, 537–540, doi: 10.1038/nature14216 (2015). [DOI] [PMC free article] [PubMed] [Google Scholar]
- 7.Xu G et al. REV7 counteracts DNA double-strand break resection and affects PARP inhibition. Nature 521, 541–544, doi: 10.1038/nature14328 (2015). [DOI] [PMC free article] [PubMed] [Google Scholar]
- 8.Dev H et al. Shieldin complex promotes DNA end-joining and counters homologous recombination in BRCA1-null cells. Nat Cell Biol 20, 954–965, doi: 10.1038/s41556-018-0140-1 (2018). [DOI] [PMC free article] [PubMed] [Google Scholar]
- 9.Findlay S et al. FAM35A co-operates with REV7 to coordinate DNA double-strand break repair pathway choice. bioRxiv, 365460, doi: 10.1101/365460 (2018). [DOI] [PMC free article] [PubMed] [Google Scholar]
- 10.Ghezraoui H et al. 53BP1 cooperation with the REV7-shieldin complex underpins DNA structure-specific NHEJ. Nature 560, 122–127, doi: 10.1038/s41586-018-0362-1 (2018). [DOI] [PMC free article] [PubMed] [Google Scholar]
- 11.Gupta R et al. DNA Repair Network Analysis Reveals Shieldin as a Key Regulator of NHEJ and PARP Inhibitor Sensitivity. Cell 173, 972–988 e923, doi: 10.1016/j.cell.2018.03.050 (2018). [DOI] [PMC free article] [PubMed] [Google Scholar]
- 12.Mirman Z et al. 53BP1-RIF1-shieldin counteracts DSB resection through CST- and Polalpha-dependent fill-in. Nature 560, 112–116, doi: 10.1038/s41586-018-0324-7 (2018). [DOI] [PMC free article] [PubMed] [Google Scholar]
- 13.Noordermeer SM et al. The shieldin complex mediates 53BP1-dependent DNA repair. Nature 560, 117–121, doi: 10.1038/s41586-018-0340-7 (2018). [DOI] [PMC free article] [PubMed] [Google Scholar]
- 14.Tomida J et al. FAM35A associates with REV7 and modulates DNA damage responses of normal and BRCA1-defective cells. EMBO J 37, doi: 10.15252/embj.201899543 (2018). [DOI] [PMC free article] [PubMed] [Google Scholar]
- 15.Barazas M et al. The CST Complex Mediates End Protection at Double-Strand Breaks and Promotes PARP Inhibitor Sensitivity in BRCA1-Deficient Cells. Cell Rep 23, 2107–2118, doi: 10.1016/j.celrep.2018.04.046 (2018). [DOI] [PMC free article] [PubMed] [Google Scholar]
- 16.Gao S et al. An OB-fold complex controls the repair pathways for DNA double-strand breaks. Nat Commun 9, 3925, doi: 10.1038/s41467-018-06407-7 (2018). [DOI] [PMC free article] [PubMed] [Google Scholar]
- 17.Densham RM et al. Human BRCA1-BARD1 ubiquitin ligase activity counteracts chromatin barriers to DNA resection. Nat Struct Mol Biol 23, 647–655, doi: 10.1038/nsmb.3236 (2016). [DOI] [PMC free article] [PubMed] [Google Scholar]
- 18.Bryant HE et al. Specific killing of BRCA2-deficient tumours with inhibitors of poly(ADP-ribose) polymerase. Nature 434, 913–917, doi: 10.1038/nature03443 (2005). [DOI] [PubMed] [Google Scholar]
- 19.Farmer H et al. Targeting the DNA repair defect in BRCA mutant cells as a therapeutic strategy. Nature 434, 917–921, doi: 10.1038/nature03445 (2005). [DOI] [PubMed] [Google Scholar]
- 20.Bunting SF et al. 53BP1 inhibits homologous recombination in Brca1-deficient cells by blocking resection of DNA breaks. Cell 141, 243–254, doi: 10.1016/j.cell.2010.03.012 (2010). [DOI] [PMC free article] [PubMed] [Google Scholar]
- 21.Jaspers JE et al. Loss of 53BP1 causes PARP inhibitor resistance in Brca1-mutated mouse mammary tumors. Cancer Discov 3, 68–81, doi: 10.1158/2159-8290.CD-12-0049 (2013). [DOI] [PMC free article] [PubMed] [Google Scholar]
- 22.Zimmermann M, Lottersberger F, Buonomo SB, Sfeir A & de Lange T 53BP1 regulates DSB repair using Rif1 to control 5’ end resection. Science 339, 700–704, doi: 10.1126/science.1231573 (2013). [DOI] [PMC free article] [PubMed] [Google Scholar]
- 23.Prakash S, Johnson RE & Prakash L Eukaryotic translesion synthesis DNA polymerases: specificity of structure and function. Annu Rev Biochem 74, 317–353, doi: 10.1146/annurev.biochem.74.082803.133250 (2005). [DOI] [PubMed] [Google Scholar]
- 24.Kikuchi S, Hara K, Shimizu T, Sato M & Hashimoto H Structural basis of recruitment of DNA polymerase zeta by interaction between REV1 and REV7 proteins. J Biol Chem 287, 33847–33852, doi: 10.1074/jbc.M112.396838 (2012). [DOI] [PMC free article] [PubMed] [Google Scholar]
- 25.Budzowska M, Graham TG, Sobeck A, Waga S & Walter JC Regulation of the Rev1-pol zeta complex during bypass of a DNA interstrand cross-link. EMBO J 34, 1971–1985, doi: 10.15252/embj.201490878 (2015). [DOI] [PMC free article] [PubMed] [Google Scholar]
- 26.Bluteau D et al. Biallelic inactivation of REV7 is associated with Fanconi anemia. J Clin Invest 126, 3580–3584, doi: 10.1172/JCI88010 (2016). [DOI] [PMC free article] [PubMed] [Google Scholar]
- 27.Nozawa RS et al. Human POGZ modulates dissociation of HP1alpha from mitotic chromosome arms through Aurora B activation. Nat Cell Biol 12, 719–727, doi: 10.1038/ncb2075 (2010). [DOI] [PubMed] [Google Scholar]
- 28.Itoh G et al. CAMP (C13orf8, ZNF828) is a novel regulator of kinetochore-microtubule attachment. EMBO J 30, 130–144, doi: 10.1038/emboj.2010.276 (2011). [DOI] [PMC free article] [PubMed] [Google Scholar]
- 29.Rosenberg SC & Corbett KD The multifaceted roles of the HORMA domain in cellular signaling. J Cell Biol 211, 745–755, doi: 10.1083/jcb.201509076 (2015). [DOI] [PMC free article] [PubMed] [Google Scholar]
- 30.Luo X et al. The Mad2 spindle checkpoint protein has two distinct natively folded states. Nat Struct Mol Biol 11, 338–345, doi: 10.1038/nsmb748 (2004). [DOI] [PubMed] [Google Scholar]
- 31.West AMV, Komives EA & Corbett KD Conformational dynamics of the Hop1 HORMA domain reveal a common mechanism with the spindle checkpoint protein Mad2. Nucleic Acids Res 46, 279–292, doi: 10.1093/nar/gkx1196 (2018). [DOI] [PMC free article] [PubMed] [Google Scholar]
- 32.Mapelli M, Massimiliano L, Santaguida S & Musacchio A The Mad2 conformational dimer: structure and implications for the spindle assembly checkpoint. Cell 131, 730–743, doi: 10.1016/j.cell.2007.08.049 (2007). [DOI] [PubMed] [Google Scholar]
- 33.Ye Q et al. TRIP13 is a protein-remodeling AAA+ ATPase that catalyzes MAD2 conformation switching. Elife 4, doi: 10.7554/eLife.07367 (2015). [DOI] [PMC free article] [PubMed] [Google Scholar]
- 34.Ma HT & Poon RYC TRIP13 Regulates Both the Activation and Inactivation of the Spindle-Assembly Checkpoint. Cell Rep 14, 1086–1099, doi: 10.1016/j.celrep.2016.01.001 (2016). [DOI] [PubMed] [Google Scholar]
- 35.Hara K et al. Crystal structure of human REV7 in complex with a human REV3 fragment and structural implication of the interaction between DNA polymerase zeta and REV1. J Biol Chem 285, 12299–12307, doi: 10.1074/jbc.M109.092403 (2010). [DOI] [PMC free article] [PubMed] [Google Scholar]
- 36.Hara K et al. Dynamic feature of mitotic arrest deficient 2-like protein 2 (MAD2L2) and structural basis for its interaction with chromosome alignment-maintaining phosphoprotein (CAMP). J Biol Chem 292, 17658–17667, doi: 10.1074/jbc.M117.804237 (2017). [DOI] [PMC free article] [PubMed] [Google Scholar]
- 37.Pierce AJ, Johnson RD, Thompson LH & Jasin M XRCC3 promotes homology-directed repair of DNA damage in mammalian cells. Genes Dev 13, 2633–2638 (1999). [DOI] [PMC free article] [PubMed] [Google Scholar]
- 38.Rizzo AA et al. Rev7 dimerization is important for assembly and function of the Rev1/Polzeta translesion synthesis complex. Proc Natl Acad Sci U S A 115, E8191–E8200, doi: 10.1073/pnas.1801149115 (2018). [DOI] [PMC free article] [PubMed] [Google Scholar]
- 39.Cruz-Garcia A, Lopez-Saavedra A & Huertas P BRCA1 accelerates CtIP-mediated DNA-end resection. Cell Rep 9, 451–459, doi: 10.1016/j.celrep.2014.08.076 (2014). [DOI] [PubMed] [Google Scholar]
- 40.Shiotani B & Zou L Single-stranded DNA orchestrates an ATM-to-ATR switch at DNA breaks. Molecular cell (2009). [DOI] [PMC free article] [PubMed] [Google Scholar]
- 41.Roig I et al. Mouse TRIP13/PCH2 is required for recombination and normal higher-order chromosome structure during meiosis. PLoS Genet 6, doi: 10.1371/journal.pgen.1001062 (2010). [DOI] [PMC free article] [PubMed] [Google Scholar]
- 42.Lord CJ & Ashworth A PARP inhibitors: Synthetic lethality in the clinic. Science 355, 1152–1158, doi: 10.1126/science.aam7344 (2017). [DOI] [PMC free article] [PubMed] [Google Scholar]
- 43.Alexandrov LB & Stratton MR Mutational signatures: the patterns of somatic mutations hidden in cancer genomes. Curr Opin Genet Dev 24, 52–60, doi: 10.1016/j.gde.2013.11.014 (2014). [DOI] [PMC free article] [PubMed] [Google Scholar]
- 44.Huang PJ et al. mSignatureDB: a database for deciphering mutational signatures in human cancers. Nucleic Acids Res 46, D964–D970, doi: 10.1093/nar/gkx1133 (2018). [DOI] [PMC free article] [PubMed] [Google Scholar]
- 45.Lim KS et al. USP1 Is Required for Replication Fork Protection in BRCA1-Deficient Tumors. Mol Cell 72, 925–941 e924, doi: 10.1016/j.molcel.2018.10.045 (2018). [DOI] [PMC free article] [PubMed] [Google Scholar]
- 46.Polo SE & Jackson SP Dynamics of DNA damage response proteins at DNA breaks: a focus on protein modifications. Genes Dev 25, 409–433, doi: 10.1101/gad.2021311 (2011). [DOI] [PMC free article] [PubMed] [Google Scholar]
- 47.Jackson SP & Durocher D Regulation of DNA damage responses by ubiquitin and SUMO. Mol Cell 49, 795–807, doi: 10.1016/j.molcel.2013.01.017 (2013). [DOI] [PubMed] [Google Scholar]
- 48.Zeman MK & Cimprich KA Causes and consequences of replication stress. Nat Cell Biol 16, 2–9, doi: 10.1038/ncb2897 (2014). [DOI] [PMC free article] [PubMed] [Google Scholar]
- 49.Wang K et al. Thyroid hormone receptor interacting protein 13 (TRIP13) AAA-ATPase is a novel mitotic checkpoint-silencing protein. J Biol Chem 289, 23928–23937, doi: 10.1074/jbc.M114.585315 (2014). [DOI] [PMC free article] [PubMed] [Google Scholar]
- 50.Kurita K et al. TRIP13 is expressed in colorectal cancer and promotes cancer cell invasion. Oncol Lett 12, 5240–5246, doi: 10.3892/ol.2016.5332 (2016). [DOI] [PMC free article] [PubMed] [Google Scholar]
- 51.Li W et al. Thyroid hormone receptor interactor 13 (TRIP13) overexpression associated with tumor progression and poor prognosis in lung adenocarcinoma. Biochem Biophys Res Commun 499, 416–424, doi: 10.1016/j.bbrc.2018.03.129 (2018). [DOI] [PubMed] [Google Scholar]
- 52.Yost S et al. Biallelic TRIP13 mutations predispose to Wilms tumor and chromosome missegregation. Nat Genet 49, 1148–1151, doi: 10.1038/ng.3883 (2017). [DOI] [PMC free article] [PubMed] [Google Scholar]
- 53.Adelmant G et al. DNA ends alter the molecular composition and localization of Ku multicomponent complexes. Mol Cell Proteomics 11, 411–421, doi: 10.1074/mcp.M111.013581 (2012). [DOI] [PMC free article] [PubMed] [Google Scholar]
- 54.Askenazi M, Parikh JR & Marto JA mzAPI: a new strategy for efficiently sharing mass spectrometry data. Nat Methods 6, 240–241, doi: 10.1038/nmeth0409-240 (2009). [DOI] [PMC free article] [PubMed] [Google Scholar]
- 55.Parikh JR et al. multiplierz: an extensible API based desktop environment for proteomics data analysis. BMC Bioinformatics 10, 364, doi: 10.1186/1471-2105-10-364 (2009). [DOI] [PMC free article] [PubMed] [Google Scholar]
- 56.Alexander WM, Ficarro SB, Adelmant G & Marto JA multiplierz v2.0: A Python-based ecosystem for shared access and analysis of native mass spectrometry data. Proteomics 17, doi: 10.1002/pmic.201700091 (2017). [DOI] [PubMed] [Google Scholar]
- 57.Silva JC, Gorenstein MV, Li GZ, Vissers JP & Geromanos SJ Absolute quantification of proteins by LCMSE: a virtue of parallel MS acquisition. Mol Cell Proteomics 5, 144–156, doi: 10.1074/mcp.M500230-MCP200 (2006). [DOI] [PubMed] [Google Scholar]
- 58.Rozenblatt-Rosen O et al. Interpreting cancer genomes using systematic host network perturbations by tumour virus proteins. Nature 487, 491–495, doi: 10.1038/nature11288 (2012). [DOI] [PMC free article] [PubMed] [Google Scholar]
- 59.Kraemer KH & Seidman MM Use of supF, an Escherichia coli tyrosine suppressor tRNA gene, as a mutagenic target in shuttle-vector plasmids. Mutation Research/Reviews in Genetic … (1989). [DOI] [PubMed] [Google Scholar]
- 60.Cerami E et al. The cBio cancer genomics portal: an open platform for exploring multidimensional cancer genomics data. Cancer Discov 2, 401–404, doi: 10.1158/2159-8290.CD-12-0095 (2012). [DOI] [PMC free article] [PubMed] [Google Scholar]
- 61.Gao J et al. Integrative analysis of complex cancer genomics and clinical profiles using the cBioPortal. Sci. Signal (2013). [DOI] [PMC free article] [PubMed] [Google Scholar]
- 62.Pereira B et al. The somatic mutation profiles of 2,433 breast cancers refine their genomic and transcriptomic landscapes. Nature (2016). [DOI] [PMC free article] [PubMed] [Google Scholar]
- 63.Network CGAR Comprehensive molecular portraits of human breast tumours. Nature (2012). [DOI] [PMC free article] [PubMed] [Google Scholar]
Associated Data
This section collects any data citations, data availability statements, or supplementary materials included in this article.
Supplementary Materials
Data Availability Statement
Mass spectrometry data will be deposited in MASSive data repository upon publication (https://massive.ucsd.edu/ProteoSAFe/static/massive.jsp).
All TCGA breast cancer data was accessed from the METABRIC study through cBioportal (https://www.cbioportal.org/study/summary?id=brca_metabric).
Mutation signature data was accessed from mSignatureDB (http://tardis.cgu.edu.tw/msignaturedb/).
All other data supporting the findings of this study are available from the corresponding author on reasonable request.


